Fetal heart rate regresses toward the mean in the third trimester
- PMID: 22787377
- PMCID: PMC3390730
- DOI: 10.3346/jkms.2012.27.7.794
Fetal heart rate regresses toward the mean in the third trimester
Abstract
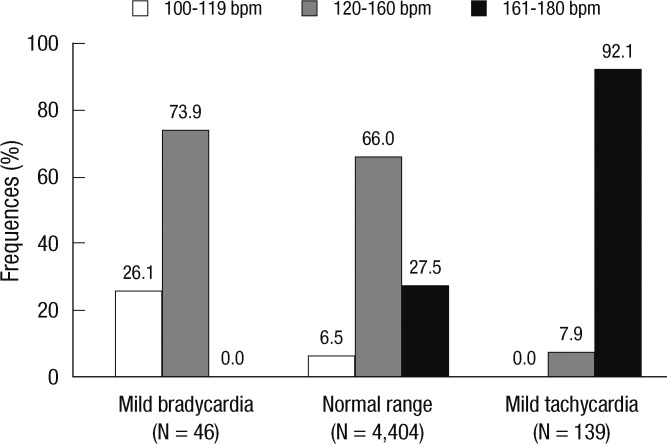
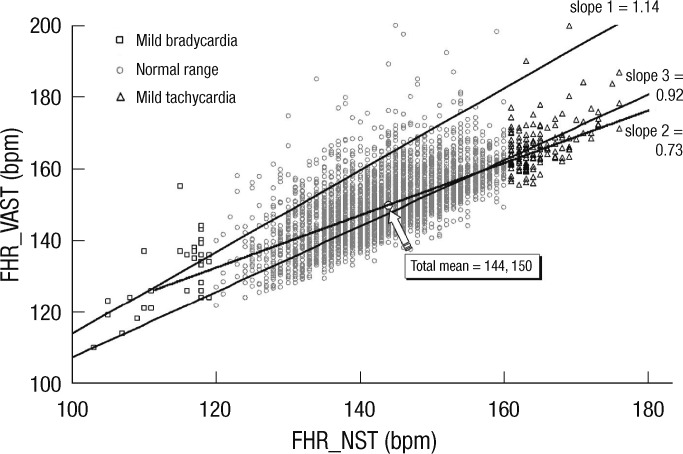
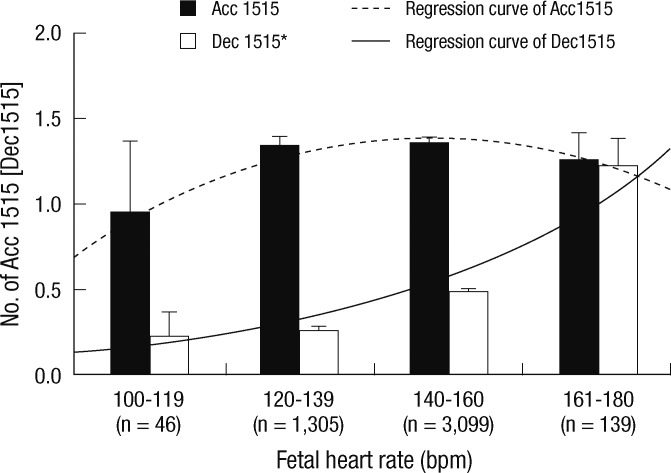
The purpose of this study was to investigate the feasibility of different fetal heart rate (FHR) ranges in the nonstress test (NST) and to better understand the meaning of mild bradycardia and/or tachycardia without non-reassuring patterns. We employed the heredity to show that mild bradycardia (100-119 beats per minute, bpm) and mild tachycardia (161-180 bpm) regressed to the normal FHR range (120-160 bpm). We used linear regression to analyze FHR data from FHR tracings recorded 10 min before (NST, as the predictor) and 10 min after vibroacoustic stimulation testing (as the dependent variable). Acceleration for 15 bpm-15 seconds (Acc1515) and deceleration for 15 bpm-15 seconds (Dec1515) in the NST were also analyzed for each group. The slope of the best-fit line was the largest in the mild bradycardia group and the smallest in the normal range group. Dec1515 was most prominent in mild tachycardia and both the mild bradycardia and tachycardia groups regressed towards the mean FHR range. Therefore, we propose that both mild bradycardia and tachycardia of FHR in non-acute situations (range between 100 and 180 bpm) are not regarded a pathologic signal for clinical use.
Keywords: Bradycardia; Fetal Heart Rate Range; Regression; Tachycardia.
Figures

Similar articles
-
[Fetal heart rate during labour: definitions and interpretation].J Gynecol Obstet Biol Reprod (Paris). 2008 Feb;37 Suppl 1:S34-45. doi: 10.1016/j.jgyn.2007.11.009. Epub 2008 Jan 8. J Gynecol Obstet Biol Reprod (Paris). 2008. PMID: 18191915 Review. French.
-
Uncomplicated baseline fetal tachycardia or bradycardia in postterm pregnancies and perinatal outcome.Am J Perinatol. 1998 May;15(5):335-8. doi: 10.1055/s-2007-993953. Am J Perinatol. 1998. PMID: 9643641
-
Clinical significance of fetal heart rate tracings during the second stage of labor.Obstet Gynecol. 2001 May;97(5 Pt 1):747-52. doi: 10.1016/s0029-7844(01)01188-7. Obstet Gynecol. 2001. PMID: 11339928
-
The significance of amplitude and duration of fetal heart rate acceleration in non-stress test analysis.Taiwan J Obstet Gynecol. 2012 Sep;51(3):397-401. doi: 10.1016/j.tjog.2012.07.014. Taiwan J Obstet Gynecol. 2012. PMID: 23040924
-
Fetal heart rate monitoring in nonobstetric surgery: a systematic review of the evidence.Am J Obstet Gynecol MFM. 2019 Nov;1(4):100048. doi: 10.1016/j.ajogmf.2019.100048. Epub 2019 Sep 27. Am J Obstet Gynecol MFM. 2019. PMID: 33345838
References
-
- Manassiev N. What is the normal heart rate of a term fetus? Br J Obstet Gynaecol. 1996;103:1272–1273. - PubMed
-
- Gibb D, Arulkumaran S. Fetal monitoring in practice. 2nd ed. Oxford: Butterworth Heinmann; 1997. pp. 20–22.
-
- Spencer J. Anteparturn tocography. In: Chamberlain G, editor. Modern antenatal care of the fetus. Oxford: Blackwell Science Ltd; 1990. pp. 163–188.
-
- American College of Obstetricians and Gynecologists. Fetal heart rate patterns: monitoring, interpretation, and management. ACOG Technical Bulletin 207. Washington, DC: American College of Obstetricians and Gynecologists; 1995.
-
- Sweha A, Hacker TW, Nuovo J. Interpretation of the electronic fetal heart rate during labor. Am Fam Physician. 1999;59:2487–2500. - PubMed
Publication types
MeSH terms
LinkOut - more resources
Full Text Sources