. 2012 Sep;23(9):1003-15.
doi: 10.1089/hum.2012.046. Epub 2012 Aug 27.

Synergistic and Selective Cancer Cell Killing Mediated by the Oncolytic Adenoviral Mutant AdΔΔ and Dietary Phytochemicals in Prostate Cancer Models

Affiliations

Synergistic and Selective Cancer Cell Killing Mediated by the Oncolytic Adenoviral Mutant AdΔΔ and Dietary Phytochemicals in Prostate Cancer Models

Virginie Adam et al. Hum Gene Ther. 2012 Sep.

Abstract

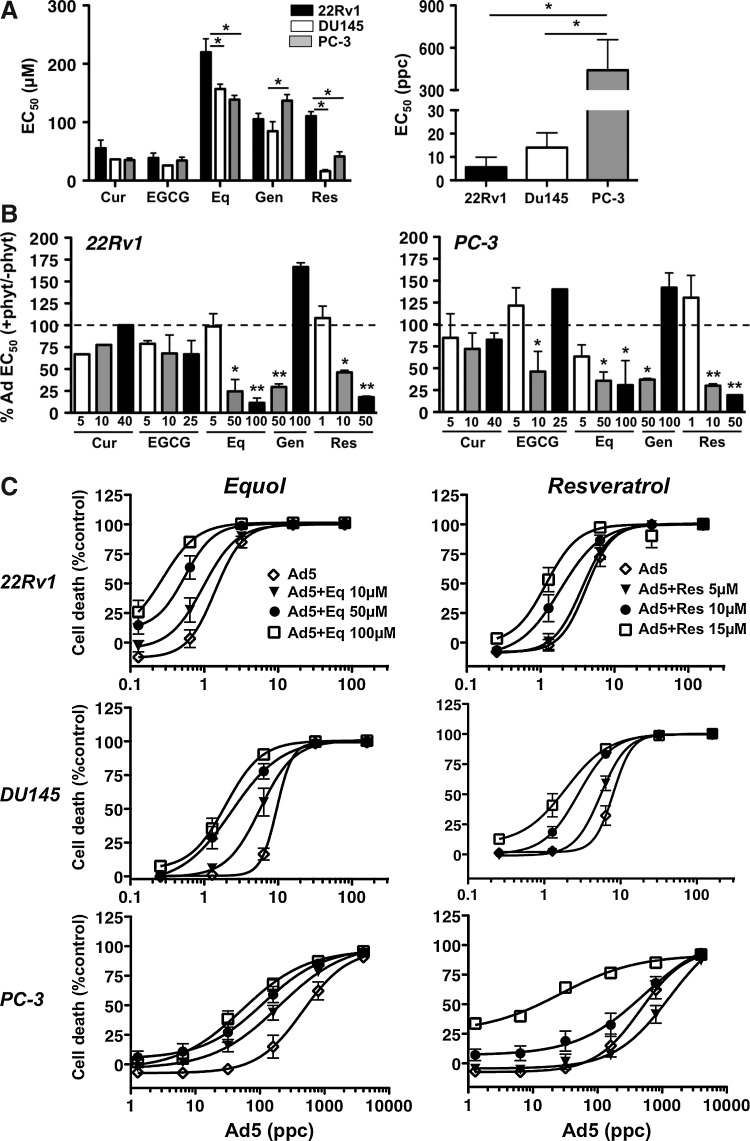
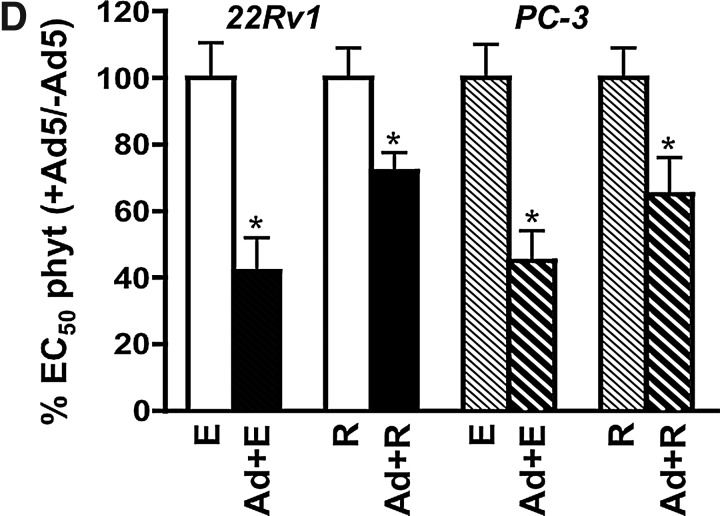
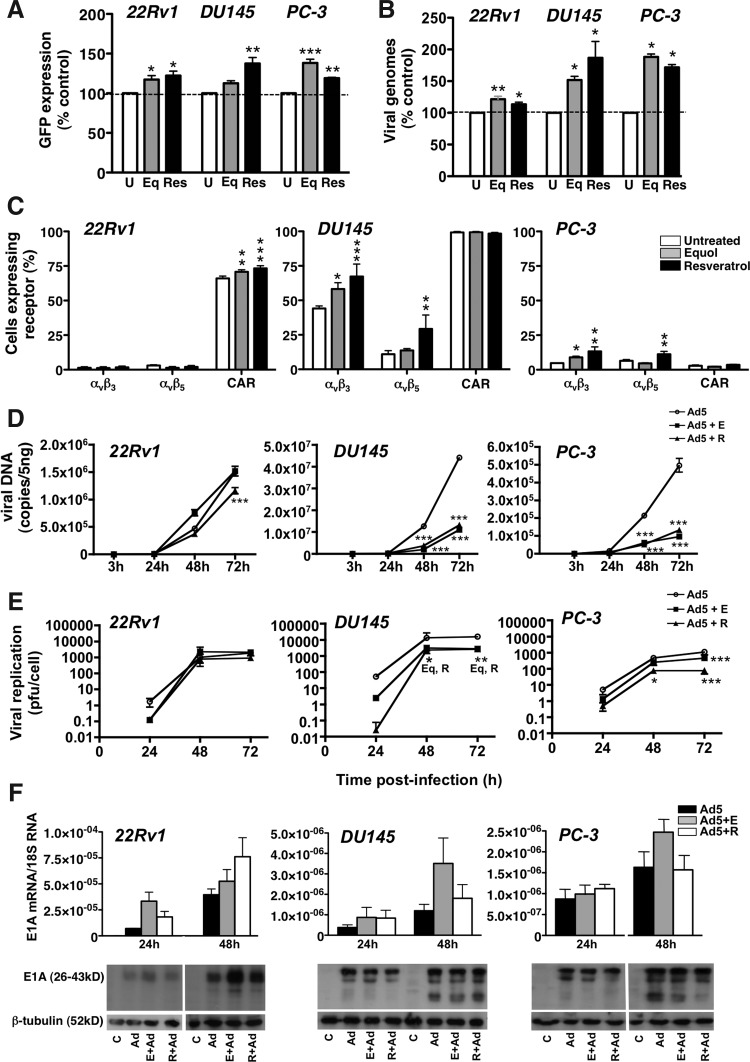
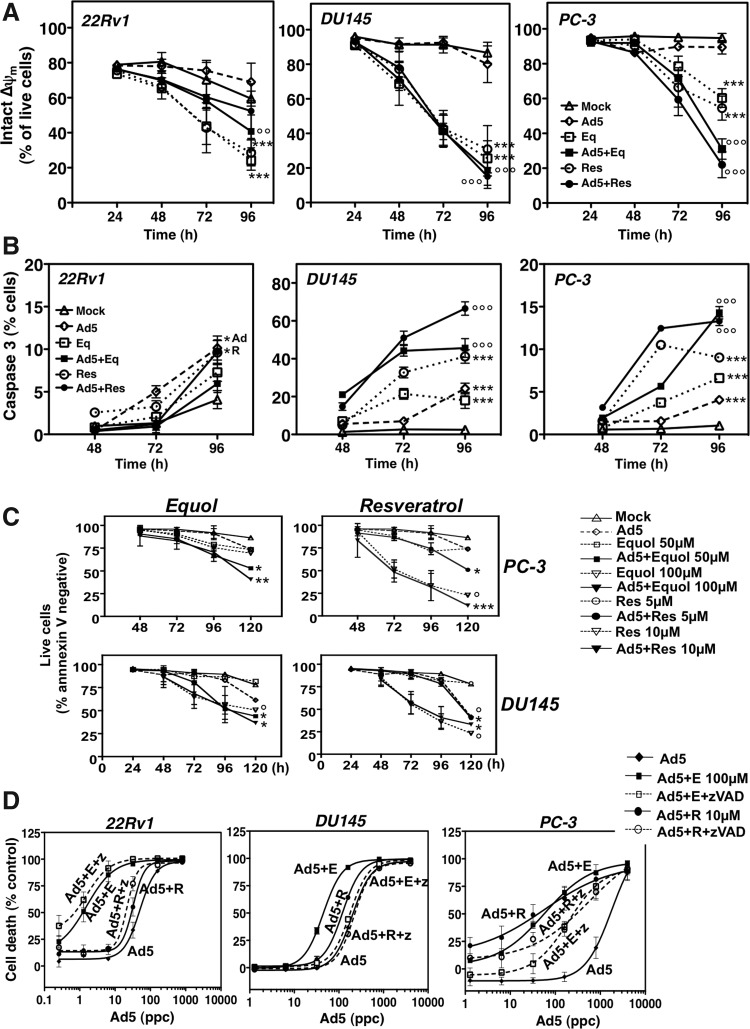
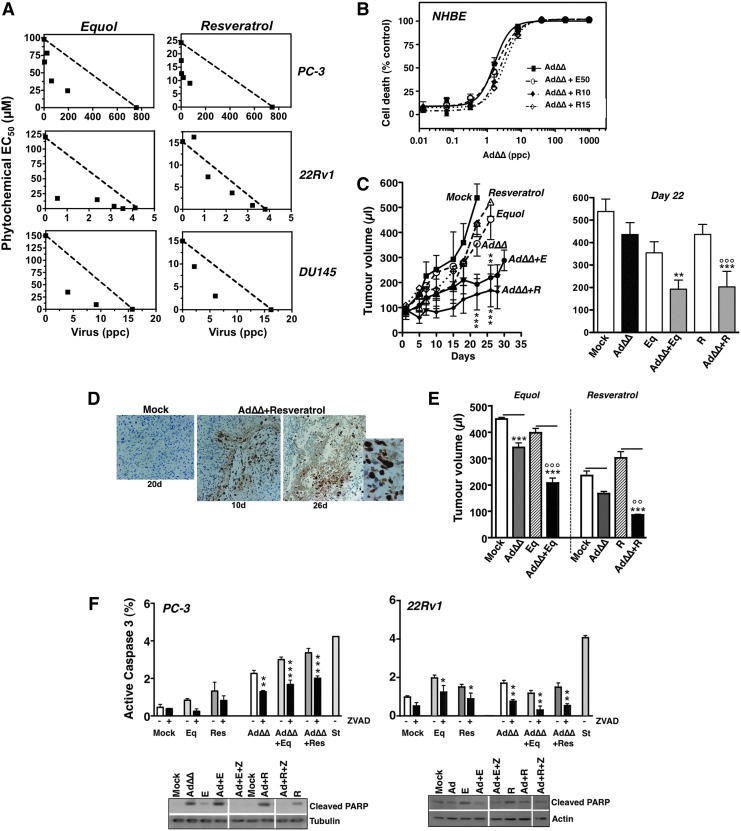
AdΔΔ is an oncolytic adenoviral mutant that has been engineered to selectively target tumors with deregulated cell cycle and apoptosis pathways. AdΔΔ potentiates apoptotic cell death induced by drugs, including mitoxantrone and docetaxel, which are commonly used to treat prostate cancer. Here, we demonstrate that AdΔΔ can also interact synergistically with dietary phytochemicals known to have anti-cancer activities, without incurring the toxic side effects of chemodrugs. Curcumin, genistein, epigallocatechin-gallate, equol, and resveratrol efficiently killed both androgen-receptor positive (22Rv1) and negative cell lines (PC-3, DU145) in combination with adenoviral mutants. Synergistic cell killing was demonstrated with wild-type virus (Ad5) and AdΔΔ in combination with equol and resveratrol. EC(50) values for both phytochemicals and viruses were reduced three- to eightfold in all three combination-treated cell lines. The most potent efficacy was achieved in the cytotoxic drug- and virus-insensitive PC-3 cells, both in vitro and in vivo, while cell killing in normal bronchial epithelial cells was not enhanced. Although equol and resveratrol induced only low levels of apoptosis when administered alone, in combination with wild-type virus or AdΔΔ, the level of apoptotic cell death was significantly increased in PC-3 and DU145 cells. In vivo studies using suboptimal doses of AdΔΔ and equol or resveratrol, showed reduced tumor growth without toxicity to normal tissue. These findings identify novel functions for AdΔΔ and phytochemicals in promoting cancer cell killing and apoptosis, suggesting the use of these natural nontoxic compounds might be a feasible and currently unexploited anti-cancer strategy.


Figures

FIG. 1.
FIG. 1.
Adenovirus-induced cell killing is significantly increased in combination with phytochemicals in prostate cancer cells. (A) EC50 values for curcumin (Cur), epigallocatechin gallate (EGCG), equol (Eq), genistein (Gen), resveratrol (Res), and adenovirus wild type (right panel; Ad5) in 22Rv1, PC-3, and DU145 cells 6 days after treatment, averages±SEM, n≥2, *p<0.05; two-way ANOVA with Bonferroni post-test (left panel); one-way ANOVA with Tukey's multiple comparison test (right panel). (B) Changes in Ad5 EC50 values when combined with increasing doses (1–100 μM) of each phytochemical in 22Rv1 and PC-3 cells. Data are percentages of the EC50 for Ad5 alone, averages±SEM, n≥2, one-way ANOVA with Tukey's multiple comparison test on EC50 values; bars below the dashed lines illustrate sensitization compared with Ad5 alone. (C) Ad5 dose–response curves in 22Rv1, DU145, and PC-3 cells with and without equol or resveratrol at three doses. Cell death expressed as percentages of uninfected controls, averages±SD, n=3, dose-dependent sensitization for all conditions compared with virus infection alone, except for 5 μM resveratrol. The EC50 values for Ad5 and each phytochemical+Ad5 were analyzed for statistical significance; one-way ANOVA with Bonferroni multiple comparison tests, p<0.05 for the two highest doses of phytochemicals in all cell lines except in PC-3 cells with resveratrol, for which only the highest dose was significant. (D) Dose–response to equol (E) or resveratrol (R) alone or in combination with Ad5 (22Rv1: 1 particle per cell (ppc), PC-3: 100 ppc) in 22Rv1 and PC-3 cells. Data are shown as percentages of the EC50 for phytochemicals alone, averages±SEM of two experiments. EC50 values were analyzed for statistical differences for each phytochemical in each cell line, unpaired two-tailed Student's t-test.
FIG. 1.
FIG. 1.
Adenovirus-induced cell killing is significantly increased in combination with phytochemicals in prostate cancer cells. (A) EC50 values for curcumin (Cur), epigallocatechin gallate (EGCG), equol (Eq), genistein (Gen), resveratrol (Res), and adenovirus wild type (right panel; Ad5) in 22Rv1, PC-3, and DU145 cells 6 days after treatment, averages±SEM, n≥2, *p<0.05; two-way ANOVA with Bonferroni post-test (left panel); one-way ANOVA with Tukey's multiple comparison test (right panel). (B) Changes in Ad5 EC50 values when combined with increasing doses (1–100 μM) of each phytochemical in 22Rv1 and PC-3 cells. Data are percentages of the EC50 for Ad5 alone, averages±SEM, n≥2, one-way ANOVA with Tukey's multiple comparison test on EC50 values; bars below the dashed lines illustrate sensitization compared with Ad5 alone. (C) Ad5 dose–response curves in 22Rv1, DU145, and PC-3 cells with and without equol or resveratrol at three doses. Cell death expressed as percentages of uninfected controls, averages±SD, n=3, dose-dependent sensitization for all conditions compared with virus infection alone, except for 5 μM resveratrol. The EC50 values for Ad5 and each phytochemical+Ad5 were analyzed for statistical significance; one-way ANOVA with Bonferroni multiple comparison tests, p<0.05 for the two highest doses of phytochemicals in all cell lines except in PC-3 cells with resveratrol, for which only the highest dose was significant. (D) Dose–response to equol (E) or resveratrol (R) alone or in combination with Ad5 (22Rv1: 1 particle per cell (ppc), PC-3: 100 ppc) in 22Rv1 and PC-3 cells. Data are shown as percentages of the EC50 for phytochemicals alone, averages±SEM of two experiments. EC50 values were analyzed for statistical differences for each phytochemical in each cell line, unpaired two-tailed Student's t-test.
FIG. 2.
FIG. 2.
Equol and resveratrol enhance viral uptake but attenuate viral replication. (A) Cells were infected with the nonreplicating Ad5GFP mutant alone (22Rv1, 25 ppc; DU145, 50 ppc; PC-3, 300 ppc) and in combination with equol (100 μM) or resveratrol (10 μM) and analyzed by flow cytometry 48 hr later. Results are percent GFP-positive cells in combination-treated versus AdGFP infected alone; averages±SD, n=3. (B) Cells were infected with wild-type virus (Ad5) (22Rv1, 25 ppc; DU145, 50 ppc; PC3, 300 ppc) and treated with equol or resveratrol as above. Viral E2A DNA was quantified by quantitative PCR (qPCR) 4 hr after infection. Data are normalized to cellular GAPDH DNA in each sample and to viral E2A DNA in cells infected with Ad5 alone, averages±SD, n=3. (C) Equol (100 μM) and resveratrol (10 μM) increase expression of cell surface receptors essential for adenoviral entry. The proportion of receptor-positive cells was determined by flow cytometry 24 hr after treatment, averages±SD, n=3. (A–C) Data analyzed in each cell line by one-way ANOVA with Bonferroni multiple comparison test, compared to untreated cells. (D) Viral DNA amplification over time (3–72 hr) was determined by qPCR analysis with primers to hexon DNA in 22Rv1, DU145, and PC-3 cells infected with Ad5 (100 ppc) with and without the addition of equol (E, 100 μM) or resveratrol (R, 10 μM). Results are normalized to cellular actin DNA in each sample and to viral DNA present 3 hr after infection with Ad5 alone, averages±SD, n=3. (E) Viral replication over time (3–72 hr) was determined by TCID50 assays in samples treated as described above for 22Rv1, DU145, and PC-3 cells. Results are averages±SD, n=3. (D–E) Two-way ANOVA with Bonferroni post-tests comparing each result over the time period to Ad-infected untreated cells for each time point. (F) Cells infected with Ad5 (22Rv1 and DU145, 100 ppc; PC-3, 300 ppc) with and without simultaneous additions of equol (E, 100 μM) or resveratrol (R, 10 μM) analyzed for viral E1A mRNA and protein expression 24 and 48 hr later, averages±SD, n=2–3, representative immunoblots.
FIG. 3.
FIG. 3.
Resveratrol and equol induce apoptosis. (A) Cells infected with Ad5 (22Rv1 and DU145, 100 ppc; PC-3, 300 ppc) (open diamond dashed line) and equol at 100 μM (open square dashed line) or resveratrol at 10 μM (open circle dashed line) were added alone or in combination with Ad5 (equol; black square solid line or resveratrol black circle solid line). Cells were stained with tetramethylrhodamine ethyl ester perchlorate (TMRE) and 4′,6-diamidino-2-phenylindole (DAPI) and analyzed by flow cytometry after 24–96 hr. Cells that retained TMRE staining (intact, active mitochondria) and remained negative for DAPI (intact cellular membrane) were considered live, means of duplicates±SD, n=3, expressed as percent of live cells (Δψm). Two-way ANOVA with Bonferroni post-tests, significant differences indicated at 96 hr: 22Rv1; °°combination-treated or ***single agent treated compared to untreated cells, DU145; °°°combination-treated or ***single-agent treated compared to untreated or virus infected cells, PC-3: °°°combination-treated compared to each single agent treatment, and ***single agent treatments compared to untreated cells. B) Cells infected with Ad5 and treated with phytochemicals as described in A, analyzed by flow cytometry for active caspase 3, averages±SD of one experiment representative of three independent studies. Significant results at 96 hr, two-way ANOVA with Bonferroni post-tests: 22Rv1; *single agents compared to untreated cells, PC-3 and DU145; °°°combination-treated compared to each single agent treated; and ***single agents compared to untreated cells. (C) Cells were infected with Ad5 as described in A and treated with equol at 50 or 100 μM or resveratrol at 5 or 10 μM. After 24–96 hr, cells were stained with Alexa fluor 488–conjugated annexin V and propidium iodide (PI). Cells that were negative for annexin V and PI cells were plotted as live cells under each condition. Results are means of duplicates from two to four experiments±SD. Significant results at 96–120 hr, two-way ANOVA with Bonferroni post-tests: DU145; *treatments compared to single agent or to °untreated, PC-3; Eq combinations compared to single agent treated, Res combinations compared to virus-infected cells. (D) Cells infected with Ad5 (0.256–10,000 ppc), with or without the pan-caspase inhibitor zVAD-fmk at 25 μM, and with or without equol 100 μM or resveratrol 10 μM. Cell viability was assessed 6 days post-infection, one representative study out of two to three. Two-way ANOVA with Bonferroni post-tests on the corresponding average EC50 values; ***Ad5 EC50 versus both phytochemicals in all three cell lines, sensitization was significantly reduced with zVADfmk in DU145 (***) and PC-3 cells (**).
FIG. 4.
FIG. 4.
AdΔΔ interacts synergistically with equol and resveratrol and inhibits tumor growth in vivo. (A) Isobolographs generated from EC50 values at two to four constant ratios of equol or resveratrol in combination with the replication-selective AdΔΔ in PC-3, 22Rv1, and DU145 cells. The straight lines represent the theoretical additive values with synergistic (CI ≤0.9) and antagonistic (CI ≥1.1) interactions illustrated by data points under and above the lines, respectively. Representative data, n=3. (B) Dose–response to AdΔΔ with and without equol (50 μM) or resveratrol (10 and 15 μM) in normal primary epithelial (NHBE) cells. Representative data, n=2. (C) PC-3 tumor xenografts were grown subcutaneously in one flank in C57Bl6 athymic mice and treated with suboptimal doses of AdΔΔ (3×10⁸ vp per injection) on day 2, 4, and 6, or equol (40 mg/kg) or resveratrol (20 mg/kg) on day 1, 3, and 5, or a combination of AdΔΔ and each phytochemical, 5–8 animals/group, repeated twice. Two-way ANOVA with Bonferroni multiple comparisons post-tests, *** resveratrol and virus at 22 and 26 days compared to resveratrol alone; **equol and virus treated compared to equol alone. Right panel: At day 22 after treatment combination-treated tumors were smaller than AdΔΔ-treated and mock-treated tumors (***). AdΔΔ+resveratrol–treated tumors were significantly different from resveratrol-only tumors (°°°). (D) Immunohistochemistry (IHC) staining for the late viral hexon protein in tumors treated with AdΔΔ and resveratrol, 10 days (10× magnification) and 26 days (right two images; 10× and 40× magnification) after treatment. Mock-treated (nonreplicating dl312 mutant) tumors 20 days after treatment (left image; 20× magnification). (E) Tumor growth in animals with two tumors each; one tumor injected with AdΔΔ or dl312 and both tumors subjected to resveratrol, equol, or vehicle administered intraperitoneally. Tumor measurements on day 16 after treatment, n=8. Simultaneous infection with AdΔΔ significantly reduced tumor growth compared to corresponding noninfected cells (***), and compared to AdΔΔ alone (°° and °°°). The horizontal lines indicate the paired tumors in each animal group. Two-way ANOVA with Bonferroni multiple comparisons post-tests. (F) Activation of caspase 3 in PC-3 and 22Rv1 cells infected with AdΔΔ (PC-3, 300 ppc; 22Rv1, 10 ppc) and treated with equol (E, 100 μM), resveratrol (R, 10 μM), or zVAD-fmk (25 μM) for 72 hr at the indicated combinations. Activation of caspase 3 was determined by flow cytometry, averages±SD, n=3; two-way ANOVA with Bonferroni multiple comparisons post-tests comparing cells treated with and without zVADfmk. Lower panels: Immunoblotting of cells treated as described for the caspase 3 analysis and cleaved PARP was identified. E, equol; R, resveratrol; Z, zVADfmk.

References

    1. Abou El Hassan M.A. van der Meulen-Muileman I. Abbas S. Kruyt F.A. Conditionally replicating adenoviruses kill tumor cells via a basic apoptotic machinery-independent mechanism that resembles necrosis-like programmed cell death. J. Virol. 2004;78:12243–12251. - PMC - PubMed
    1. Akaza H. Miyanaga N. Takashima N., et al. Comparisons of percent equol producers between prostate cancer patients and controls: case-controlled studies of isoflavones in Japanese, Korean and American residents. Jpn. J. Clin. Oncol. 2004;34:86–89. - PubMed
    1. Anders M. Christian C. McMahon M., et al. Inhibition of the Raf/MEK/ERK pathway up-regulates expression of the coxsackievirus and adenovirus receptor in cancer cells. Cancer Res. 2003;63:2088–2095. - PubMed
    1. Arico S. Petiot A. Bauvy C., et al. The tumor suppressor PTEN positively regulates macroautophagy by inhibiting the phosphatidylinositol 3-kinase/protein kinase B pathway. J. Biol. Chem. 2001;276:35243–35246. - PubMed
    1. Bewley M.C. Springer K. Zhang Y.B., et al. Structural analysis of the mechanism of adenovirus binding to its human cellular receptor, CAR. Science. 1999;286:1579–1583. - PubMed

Publication types