. 2012 Jul 10;22(1):51-65.
doi: 10.1016/j.ccr.2012.05.019.

Inhibition of RNA polymerase I as a therapeutic strategy to promote cancer-specific activation of p53

Affiliations

Inhibition of RNA polymerase I as a therapeutic strategy to promote cancer-specific activation of p53

Megan J Bywater et al. Cancer Cell. .

Abstract

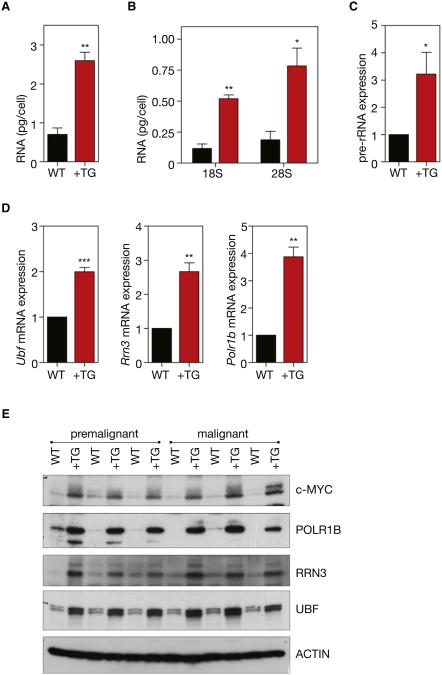
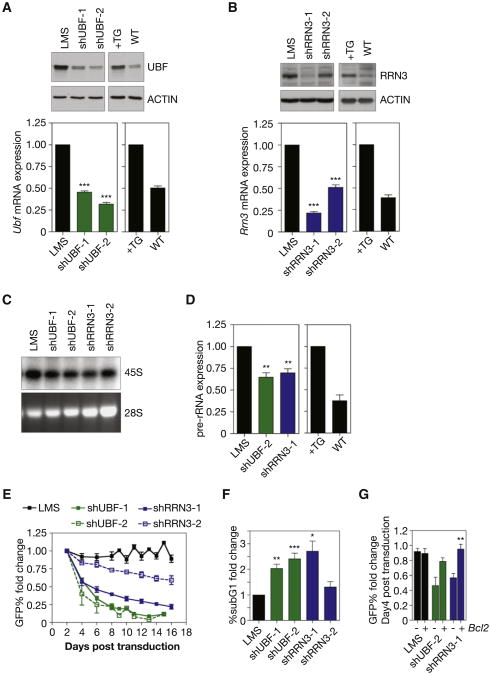
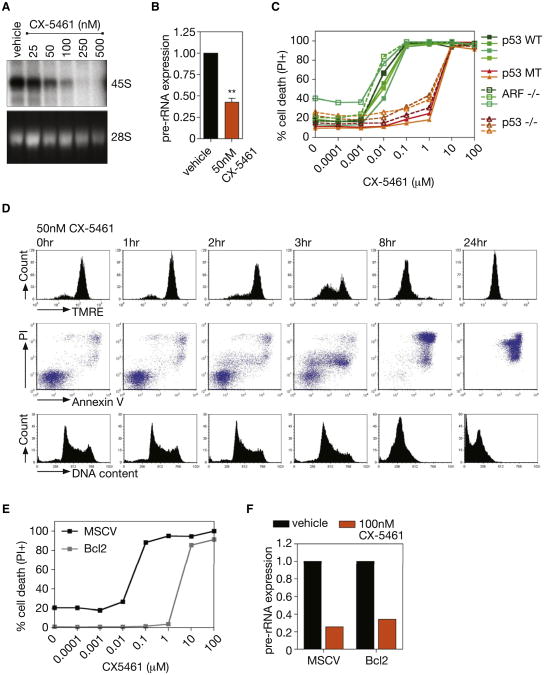
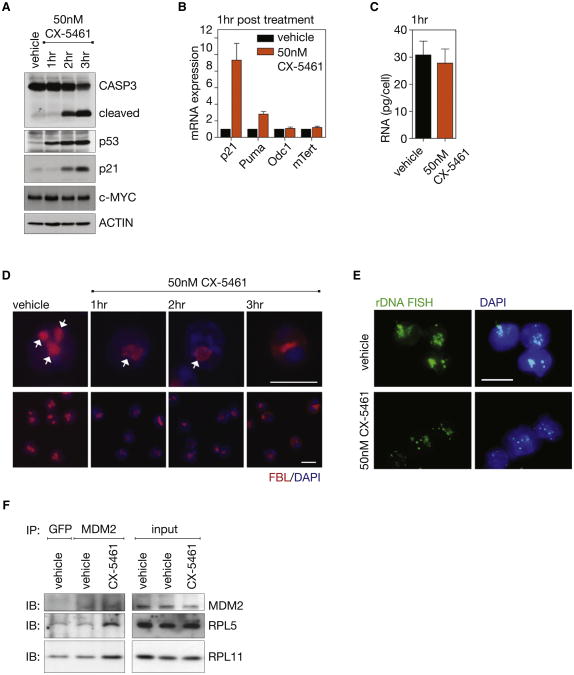
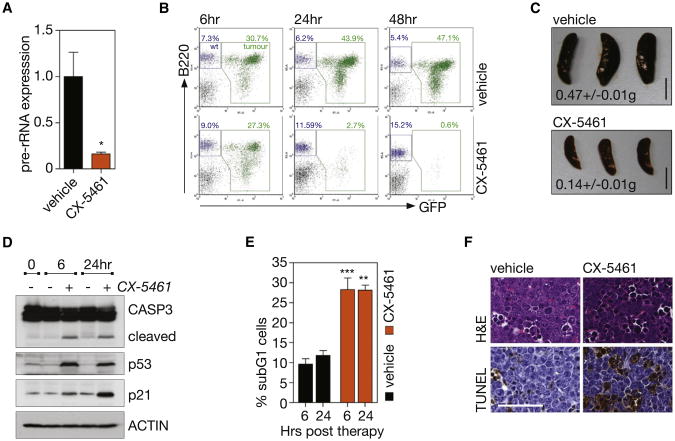
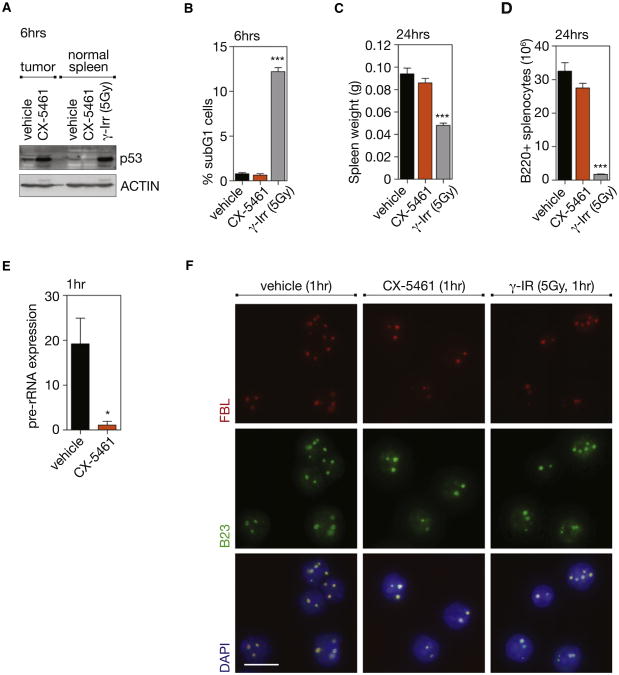
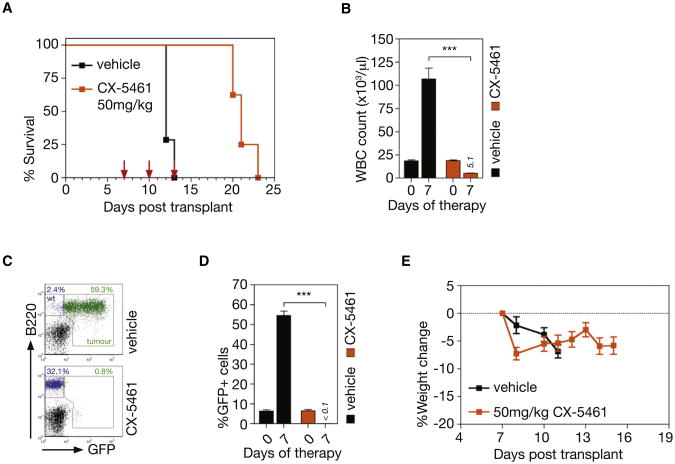
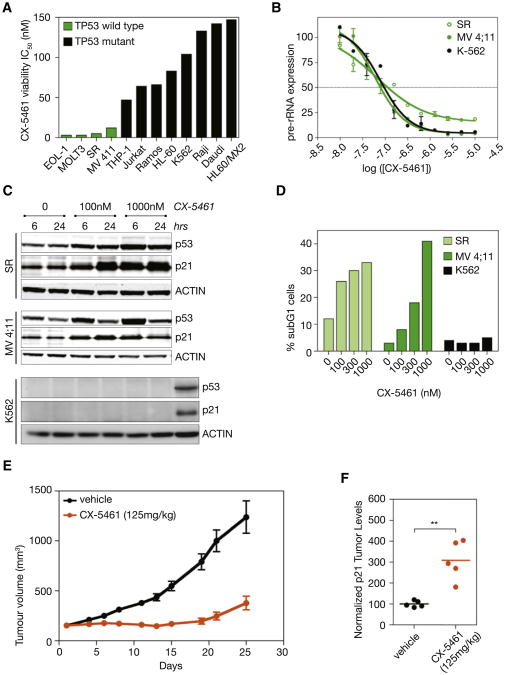
Increased transcription of ribosomal RNA genes (rDNA) by RNA Polymerase I is a common feature of human cancer, but whether it is required for the malignant phenotype remains unclear. We show that rDNA transcription can be therapeutically targeted with the small molecule CX-5461 to selectively kill B-lymphoma cells in vivo while maintaining a viable wild-type B cell population. The therapeutic effect is a consequence of nucleolar disruption and activation of p53-dependent apoptotic signaling. Human leukemia and lymphoma cell lines also show high sensitivity to inhibition of rDNA transcription that is dependent on p53 mutational status. These results identify selective inhibition of rDNA transcription as a therapeutic strategy for the cancer specific activation of p53 and treatment of hematologic malignancies.


Figures

Figure 1
Figure 1. Regulation of Pol I Transcription in Transgenic Eμ-MycB Cells
(A) Premalignant B220+ splenic B cells were isolated from premalignant (4- to6-week-old) Eμ-Myc mice (+TG) and their respective wild-type litter-mates (WT), lysed, and total RNA content per cell determined (p < 0.01, n = 3). (B) Total 18S (p < 0.01, n = 3) and 28S (p < 0.05, n =3)rRNA per cell, as determined using an Agilent Bioanalyzer. (C) Pre-rRNA expression determined by quantitative reverse transcription real-time (qRT) PCR of the internally transcribed spacer 1 (ITS1) (+742 to +874) of the 47S pre-rRNA (p < 0.05; n = 5). (D) Relative mRNA expression of Pol I transcription factors Ubf, Rrn3, and Polr1b, determined by qRT-PCR (Ubf, p < 0.001; Rrn3, p < 0.01; Polr1b, p < 0.01; n = 5). (E) Western blot analysis of ACTIN, c-MYC and Pol I transcription factors, UBF, RRN3 and POL1RB in premalignant and malignant (tumor bearing) B220+ B cells isolated from +TG mice and their respective WT littermates. Student's two-tailed t test for all comparisons. Error bars represent SEM. See also Figure S1.
Figure 2
Figure 2. Reducing Pol I Transcription Rates in Eμ-MycLymphoma Cells Using shRNA-mirs Against UBF or RRN3 Strongly Activates Programmed Cell Death
(A) Western blot analysis of UBF in cultured in Eμ-Myc lymphoma cells transduced with one of two independent shRNA-mirs targeting UBF (shUBF-1 and -2) or empty vector (LMS), and in B220+ splenic B cells isolated from 4- to 6-week-old Eμ-Myc mice (+TG) and their respective wild-type littermates (WT). Relative Ubf mRNA expression determined by qRT-PCR (LMS versus shUBF-1, p < 0.001; LMS versus shUBF-2, p < 0.001; n = 3). (B) Western blot analysis of RRN3 as for UBF in (a) utilizing two independent shRNA-mirs targeting RRN3 (shRRN3-1 and -2). Relative Rrn3 mRNA expression determined by qRT-PCR (LMS versus shRRN3-1, p < 0.001; LMS versus shRRN3-2, p < 0.001; n = 4). (C) 47S pre-rRNA synthesis determined by [32P] orthophosphate labeling in cells transduced with shRNA-mirs targeting UBF or RRN3 as compared to LMS alone (representative of n = 2). (D) Pre-rRNA expression determined by qRT-PCR of the ITS1 in cells transduced with select shRNA-mirs and B cells described in (a) (LMS versus shUBF-2, p < 0.01; LMS versus shRRN3-1, p < 0.01; n = 4). (E) GFP competition assay of GFP+, transduced Eμ-Myc lymphoma cells (LMS, shUBF, shRRN3) cocultured with GFP–, mock transduced Eμ-Myc lymphoma cells. Data expressed as fold change in percentage of GFP+ cells compared to Day 2 posttransduction (n = 3). (F) Percentage of apoptotic cells determined by subG1 DNA content analysis expressed as fold change over LMS (6.3% ± 0.61 SEM) (LMS versus shUBF-1, p < 0.01; LMS versus shUBF-2, p < 0.001; n = 3) (LMS versus shRRN3-1, p < 0.05; n = 6). See also Figures S2A and S2B. (G) GFP competition assay in Eμ-Myc lymphoma cells with BCL2 overexpression, expressed as fold change in percentage of GFP+ cells on Day 4 compared to Day 2 posttransduction (shRRN3-1 p < 0.01; n = 3). One-way ANOVA with Tukey's multiple comparison posttest (a,b,d,f). Student's two-tailed t test (g). Error bars represent SEM. See also Figures S2C and S2D.
Figure 3
Figure 3. CX-5461 Induces Rapid, p53-Dependent, Apoptotic Cell Death of Eμ-Myc Lymphoma Cells
(A) 47S pre-rRNA synthesis in cultured Eμ-Myc lymphoma cells treated with increasing nM concentrations of CX-5461, determined by [32P] orthophosphate labeling (representative of n = 3). See also Figure S3A. (B) Pre-rRNA expression determined by qRT-PCR in cells treated with 50 nm CX-5461 as compared to vehicle alone (p < 0.01; n = 3). See also Figures S3B and S3C. (C) CX-5461 cell death curve of cultured Eμ-Myc lymphoma cell lines(including wild-type[WT], mutant [MT], and homozygous deleted [−/−]for indicated genes) 16 hr posttreatment, quantified by percentage of cells incorporating PI (representative of n = 3). See also Figures S3D and S3E. (D) Induction of apoptosis in cultured Eμ-Myc lymphoma cells treated with 50 nM CX-5461, shown by loss of TMRE staining; increased Annexin V/PI costaining; increased cells with subG1 DNA content. See also Figures S3F-S3H. (E) CX-5461 cell death curve of a p53 WT Eμ-Myc lymphoma cell line overexpressing BCL2 at 16 hr posttreatment, quantified by percentage of cells incorporating PI (representative of n = 2). (F) Pre-rRNA expression in an Eμ-Myc lymphoma cell line overexpressing BCL2 in comparison to vector alone (MSCV), and treated with 100 nM CX-5461 as compared to vehicle as determined by qRT-PCR (n = 1). Student's two-tailed t test for all comparisons. Error bars represent SEM.
Figure 4
Figure 4. CX-5461 Activates p53 via the Nucleolar Stress Response in Eμ-MycLymphoma Cells
(A) Western blot analysis over 3 hr of cleavage of CASPASE 3 (CASP3), total p53, p21, and c-MYC in a p53 wt wild-type Eμ-Myc lymphoma cell line treated with 50 nM CX-5461 in culture. See also Figure S4A. (B) Relative p21, Puma, Odc1, and mTert mRNA expression determined by qRT-PCR (n = 3). (C) Total RNA per cell (p > 0.05; n = 3) in cells from (a) at 1 hr of CX-5461 treatment. (D) Nucleolar disruption shown in cells from (a) by fibrillarin (FBL) immunofluorescence with DAPI counterstain, nucleoli indicated by white arrows. See also Figure S4B. (E) rDNA fluorescent in situ hybridization (FISH) with DAPI counterstain 2 hr post CX-5461 treatment. See also Figures S4C and S4D. (F) Coimmunoprecipitation of ribosomal proteins L5 (RPL5) andL11(RPL11) with MDM2 (as comparedto GFP control)in vehicle-treated Eμ-Myc lymphoma cells overexpressing BCL2 cells versus cells treated with 500 nM CX-5461, as shown by western immunoblot (IB) analysis. Images taken at 60× magnification. Scale bar represents 10 μm. Student's two-tailed t test for all comparisons. Error bars represent SEM. See also Figure S4D.
Figure 5
Figure 5. Therapeutic Administration of CX-5461 Selectively Kills Transplanted p53 Wild-type Eμ-MycLymphoma Cells In Vivo
(A) Pre-rRNA expression in tumor bearing lymph nodes of mice transplanted with p53 wild-type Eμ-Myc lymphoma cells (clone 4242) 1 hr posttreatment with 50 mg/kg CX-5461, determined by qRT-PCR (p < 0.05; n = 4). See also Figures S5A and S5B. (B) FACS analysis of tumor burden in lymph node; stained with antibody against pan B cell marker B220, tumor cells GFP+ (green) (representative of n = 3). See also Figure S5C. (C) Mean spleen weight ± SEM at 24 hr post therapy (p < 0.001; n = 3). Scale bar represents 1 cm. (D) Western blot analysis at 6 and 24 hr of cleavage of CASP3, total p53, and p21 in the lymph node. (E) Quantitation of apoptotic cells in lymph node, determined by subG1 DNA content analysis (vehicle versus CX-5461, p < 0.001 at 6 hr, p < 0.01 at 24 hr; n = 3). See also Figure S5D. (F) Hematoxylin and eosin (H&E) and TUNEL stained lymph node sections at 6 hr post therapy; images taken at 40× magnification. Scale bar represents 50 μm. Student's two-tailed t test (a). One-way ANOVA with Tukey's multiple comparison posttest (c,e). Error bars represent SEM.
Figure 6
Figure 6. Therapeutic Administration of CX-5461, in Contrast to γ-Irradiation, Does Not Kill Normal B Cells In Vivo
(A) Western blot analysis of total p53 in tumor-bearing lymph nodes (tumor) (Figure 5) or spleen from wild-type (WT) mice (normal spleens) treated for 6 hr with vehicle, 40 mg/kg CX-5461, or 5 Gy γ-irradiation (γ-Irr). (B) Quantitation of apoptotic cells in spleens of WT mice treated with vehicle, 40mg/kg CX-5461or5 Gyγ-Irr; determinedby subG1 DNA content analysis (vehicle versus γ-Irr, p < 0.001; n = 5). (C) Spleen weight of WT mice treated for 24 hr with vehicle, 40 mg/kg CX-5461 or 5 Gy γ-Irr (vehicle versus γ-Irr, p < 0.001; n = 5). (D) Number of B220+ cells in WT spleen at 24 hr post therapy, as determined by FACS and comparative cell counts on whole organ suspensions (vehicle versus γ-Irr, p < 0.001; n = 5). (E) Pre-rRNA expression in spleen from WT mice at 1 hr posttreatment with vehicle or 40 mg/kg CX-5461, as determined by CISH using an anti-sense probe to the ITS1 (p < 0.05; n = 3 spleens, mean of six fields of comparative regions per spleen; %threshold area). See also Figure S6A. (F) FBL and B23 immunofluorescence with DAPI counterstain on bone marrow from WT mice 1 hr posttreatment with vehicle, 40 mg/kg CX-5461, or 5 Gy γ-Irr; images taken at 60× magnification. Scale bar represents10 μm. One-way ANOVA with Tukey's multiple comparison posttest (b–d). Student's two-tailed t test (e). Error bars represent SEM. See also Figure S6.
Figure 7
Figure 7. Therapeutic Administration of CX-5461 Increases Survival from Transplanted p53 Wild-type Eμ-MycLymphoma
(A) Kaplan-Meier curves showing increased survival of mice transplanted with p53 wild-type Eμ-Myc lymphoma (clone 107) treated with three doses of CX-5461 at 50 mg/kg in comparison to vehicle (dosing day indicated by arrows) (p < 0.0001; vehicle, n = 7; drug, n = 8). (B) White blood cell (WBC) count at 0 and 7 days poststart of therapy (Day7 vehicle versus Day7 CX5461 p < 0.001; vehicle, n = 7; drug, n = 8). (C) FACS analysis of tumor burden as measured by GFP+ B cells (B220+) in peripheral blood at 7 days posttherapy. (D) Quantitation of FACS analysis (c) of tumor burden in the peripheral blood at 7 days poststart of therapy (p < 0.0001; vehicle, n = 7; drug, n = 8). (E) Percent change in body weight of mice on therapy (vehicle, n = 7; drug, n = 8). Logrank test (a). One-way ANOVA with Tukey's multiple comparison posttest (b,d). Error bars represent SEM. See also Figure S7.
Figure 8
Figure 8. Human Leukemia and Lymphoma Cell Lines Treated with CX-5461
(A) The result of 96 hr treatment with CX-5461 on viability of human leukemia and lymphoma cell lines with different p53 status (p < 0.0009 comparing TP53 wild-type [WT] IC50 to TP53 mutant IC50). (B) Effect of CX-5461 on Pol I transcription in human cancer cell lines, as determined by qRT-PCR to the 5′ externally transcribed spacer (5′ ETS) region of the 47S pre-rRNA. Error bars represent SEM. (C) CX-5461 induces p53 and p21 in p53 WT SR and MV 4;11 cell lines, but not in the p53 null K562 cell line, as determined by western blot analysis. A549 cell lysates used as positive control for p53 and p21 in K562 blots (far right lane). (D) CX-5461 induces apoptosis in p53 WT SR and MV 4;11 cell lines, but not in the p53 null K562 cell line, as determined by subG1 DNA content analysis. See also Figures S8A and S8B. (E) Activity of CX-5461 in vivo against MV 4;11 xenograft model as measured by increased tumor volume over days of therapy (n = 10). Error bars represent SEM. See also Figure S8C. (F) CX-5461 induces p21 in MV 4;11 xenografts, as determined by western blot analysis of p21 normalized to ACTIN using densitometry (p < 0.001; n = 5). Student's two-tailed t test.

References

    1. Adams JM, Harris AW, Pinkert CA, Corcoran LM, Alexander WS, Cory S, Palmiter RD, Brinster RL. The c-myc oncogene driven by immunoglobulin enhancers induces lymphoid malignancy in transgenic mice. Nature. 1985;318:533–538. - PubMed
    1. Arabi A, Wu S, Ridderstråle K, Bierhoff H, Shiue C, Fatyol K, Fahlén S, Hydbring P, Söderberg O, Grummt I, et al. c-Myc associates with ribosomal DNA and activates RNA polymerase I transcription. Nat Cell Biol. 2005;7:303–310. - PubMed
    1. Barna M, Pusic A, Zollo O, Costa M, Kondrashov N, Rego E, Rao PH, Ruggero D. Suppression of Myc oncogenic activity by ribosomal protein haploinsufficiency. Nature. 2008;456:971–975. - PMC - PubMed
    1. Boisvert FM, van Koningsbruggen S, Navascués J, Lamond AI. The multifunctional nucleolus. Nat Rev Mol Cell Biol. 2007;8:574–585. - PubMed
    1. Boulon S, Westman BJ, Hutten S, Boisvert FM, Lamond AI. The nucleolus under stress. Mol Cell. 2010;40:216–227. - PMC - PubMed

Publication types