. 2013 Jul 12:1521:1-15.
doi: 10.1016/j.brainres.2012.06.057. Epub 2012 Jul 10.

Establishment of a simplified in vitro porcine blood-brain barrier model with high transendothelial electrical resistance

Affiliations

Establishment of a simplified in vitro porcine blood-brain barrier model with high transendothelial electrical resistance

Adjanie Patabendige et al. Brain Res. .

Abstract

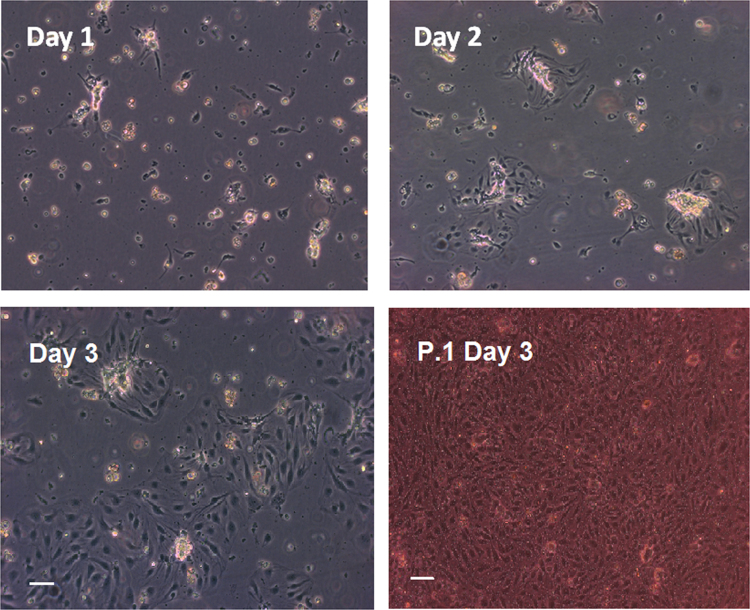
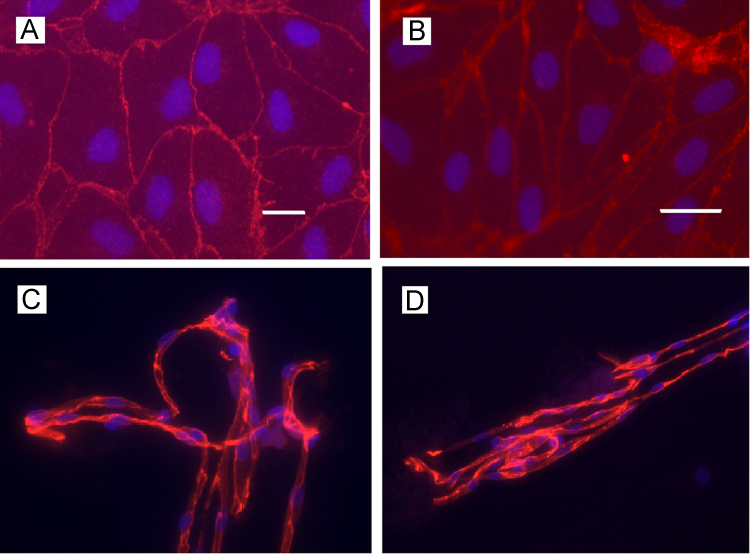
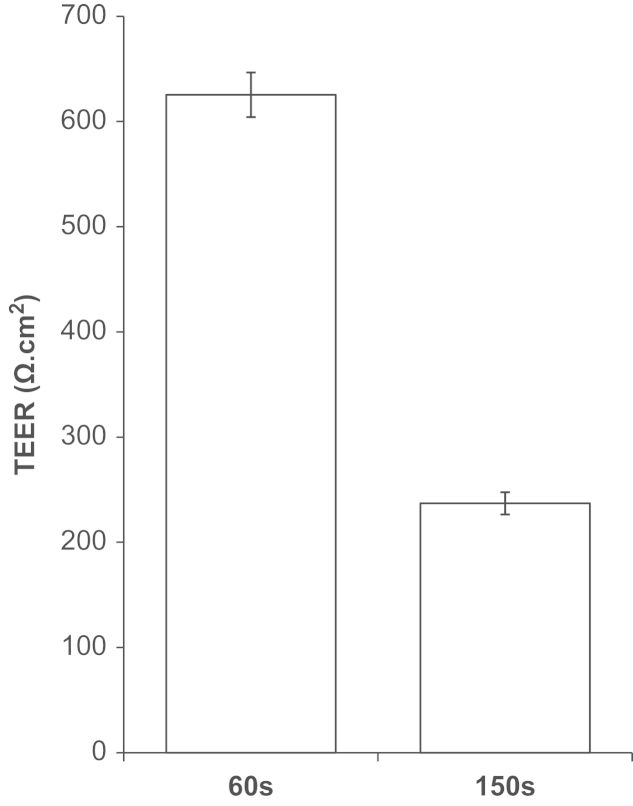
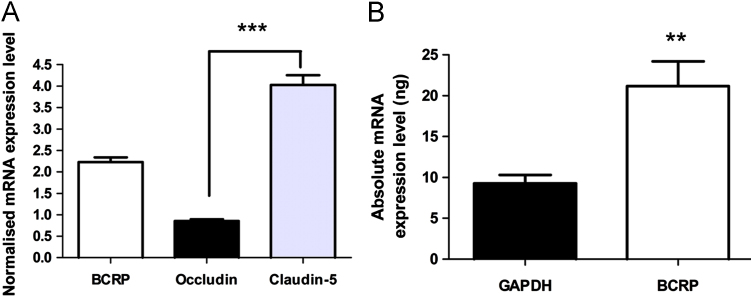
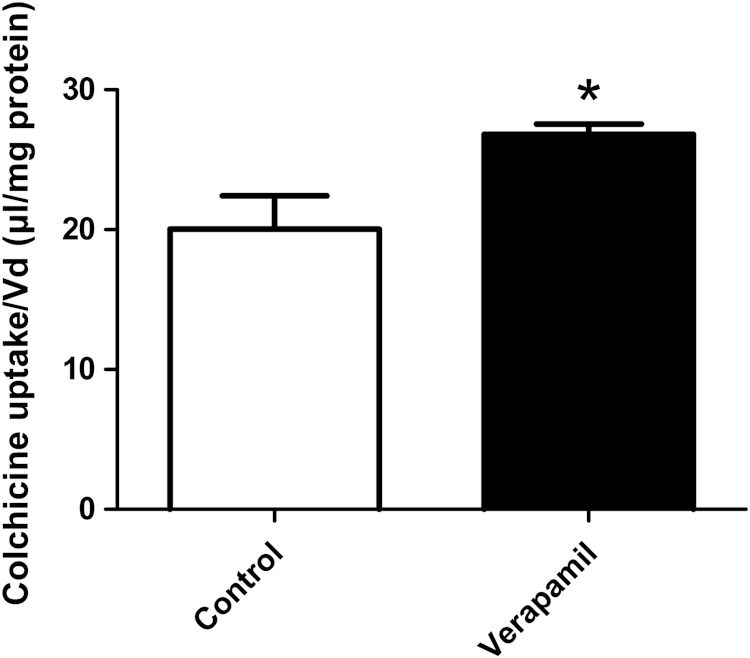
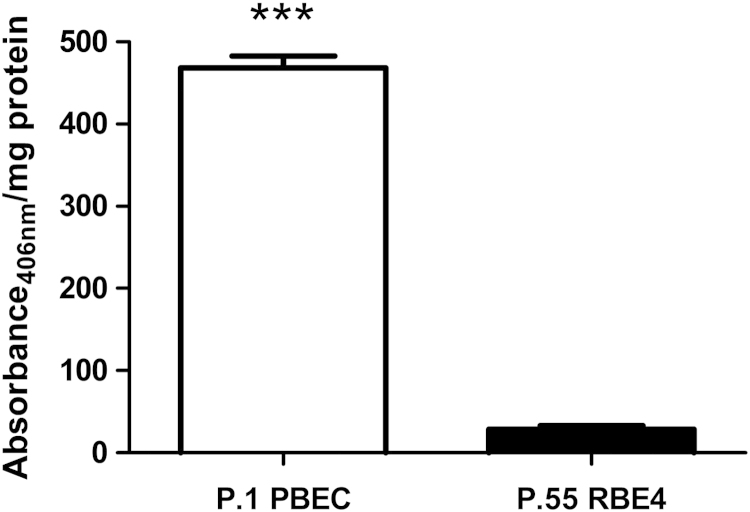
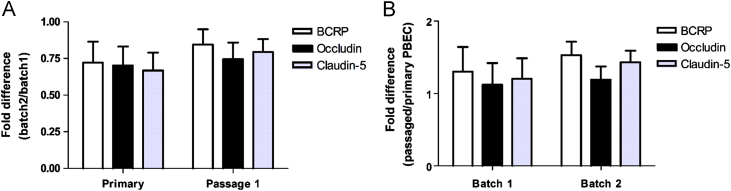
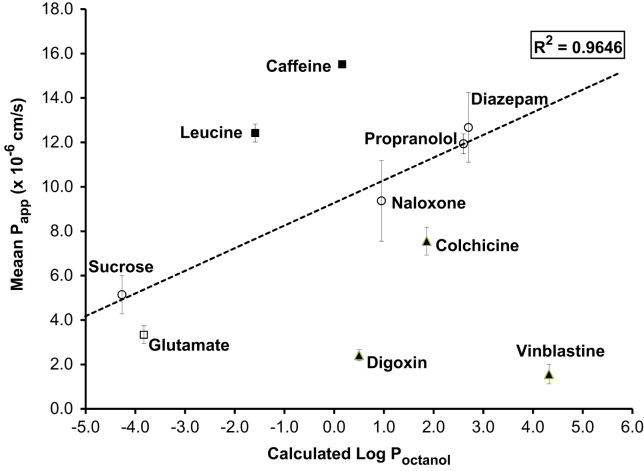
Good in vitro blood-brain barrier (BBB) models that mimic the in vivo BBB phenotype are essential for studies on BBB functionality and for initial screening in drug discovery programmes, as many potential therapeutic drug candidates have poor BBB permeation. Difficulties associated with the availability of human brain tissue, coupled with the time and cost associated with using animals for this kind of research have led to the development of non-human cell culture models. However, most BBB models display a low transendothelial electrical resistance (TEER), which is a measure of the tightness of the BBB. To address these issues we have established and optimised a robust, simple to use in vitro BBB model using porcine brain endothelial cells (PBECs). The PBEC model gives high TEER without the need for co-culture with astrocytes (up to 1300 O cm(2) with a mean TEER of ~800 O cm(2)) with well organised tight junctions as shown by immunostaining for occludin and claudin-5. Functional assays confirmed the presence of high levels of alkaline phosphatase (ALP), and presence of the efflux transporter, P-glycoprotein (P-gp, ABCB1). Presence of the breast cancer resistance protein (BCRP, ABCG2) was confirmed by TaqMan real-time RT-PCR assay. Real-time RT-PCR assays for BCRP, occludin and claudin-5 demonstrated no significant differences between batches of PBECs, and also between primary and passage 1 PBECs. A permeability screen of 10 compounds demonstrated the usefulness of the model as a tool for drug permeability studies. Qualitative and quantitative results from this study confirm that this in vitro porcine BBB model is reliable and robust; it is also simpler to generate than most other BBB models. This article is part of a Special Issue entitled Electrical Synapses.


Figures

Fig. 1
Fig. 1
Phase contrast images of a primary porcine brain endothelial cell (PBEC) culture. The cells were treated with 4 μg/ml puromycin for three days to remove contaminating cells (as described in Section 4.3). Porcine brain endothelial cells start to migrate from microvessel fragments from day 1. By day 3, the culture is about 70% confluent and can be passaged at this stage. Bottom right image shows confluent P.1 PBEC cultures on Transwell inserts, three days after passaging (six days from thawing). Scale bar: 50 μm.
Fig. 2
Fig. 2
Fluorescence micrograph of the immunocytochemical localisation of occludin and claudin-5 in P.1 PBEC and porcine brain microvessels. P.1 PBEC were grown on glass cover slips (A, B) then stained for tight-junction proteins occludin (A, scale bar: 50 μm) and claudin-5 (B, scale bar: 20 μm). Porcine brain microvessels were isolated from fresh porcine brain tissue onto glass coverslips using the ‘tissue print’ method (Section 4.5). (C) Occludin (viewed at 40×magnification); (D) claudin-5 (20×magnification); nuclei counterstained with Hoescht 33258.
Fig. 3
Fig. 3
TEER differences between 60s and 150s fractions from the same batch of PBEC. Puromycin-treated PBEC were passaged and grown on 12 mm diameter Transwell Clear filter inserts (0.4 μm pore size) for three days. Cells were treated with supplements (CPT-cAMP, RO-20-1724 and hydrocortisone) for 24 h and TEER measured. TEER of a ‘blank’ cell-free insert has been subtracted from all values. Mean±SEM (n=6).
Fig. 4
Fig. 4
mRNA expression of breast cancer-resistance protein (BCRP), occludin and claudin-5 in P.1 PBEC. (A) Normalised mRNA expression levels of BCRP, occludin and claudin-5 for P.1 PBEC cultures. P.1 PBEC mRNA data for each gene were normalised against GAPDH (mean±SEM, n=12; independent-sample t-test; ***p<0.0001). Statistical significance between the three genes was determined by one-way ANOVA, followed by Dunnet's test for equal variances (***p<0.0001). (B) Absolute mRNA expression levels of GAPDH and BCRP. mRNA transcripts are from 12 samples (mean±SEM; independent-sample t-test; **p<0.01).
Fig. 5
Fig. 5
Assessment of P-glycoprotein function in P.1 PBEC. [3H]Colchicine uptake assay for P-gp activity. Mean±SEM (n=6). Independent-sample t-test; *p<0.05 compared to the control. Colchicine uptake (Vd, volume of distribution) in presence of P-gp inhibitor verapamil showed a ‘factor increase’ (Vd in presence of verapamil/Vd in control) of 1.34 compared to the control without inhibitor, evidence for presence of functional P-gp.
Fig. 6
Fig. 6
Comparison of ALP activity between P.1 PBEC and P.55 RBE4 cells. ALP assay was performed on confluent cells using pNPP as ALP substrate as described in Section 4.10. ALP activity of P.1 PBEC was over 20 times greater than in P.55 RBE4 cells (mean±SEM, n=24; independent-sample t-test; ***p<0.0001).
Fig. 7
Fig. 7
Comparison of relative mRNA expression levels of BCRP, occludin and claudin-5 in PBEC cultures. (A) Relative mRNA expression levels between batches of PBEC. The results are expressed as ‘fold difference’ ratio between batch 2 and batch 1 PBEC cultures (mean±SEM, n=6). (B) Relative mRNA expression levels between primary and P.1 PBEC cultures within each batch. Results are expressed as ‘fold difference’ ratio between passage 1 and primary PBEC cultures (mean±SEM, n=6). Statistical significance was determined by two-way ANOVA and showed no significant differences between batches or cultures (primary vs. passage 1) of PBECs.
Fig. 8
Fig. 8
Correlation between in vitro Papp (apical to basal direction) for P.1 PBEC and calculated Log Poctanol. P.1 PBEC were grown on Transwell Clear inserts and were used after treatment with cAMP, RO-20-1724 and hydrocortisone for 24 h (n=3 experiments, 9–12 inserts for each compound). Permeability assays were performed as described in Section 4.8 and 4.15. Calculated Log Poctanol was obtained from http://www.syrres.com/eSc/est_kowdemo.htm. Solute permeation: open circles, passive; closed squares, uptake; closed triangles, ABC-mediated efflux; open square, glutamate – subject to both uptake and efflux, see Section 2.5.

References

    1. Abbott N.J. Astrocyte-endothelial interactions and blood–brain barrier permeability. J. Anat. 2002;200:629–638. - PMC - PubMed
    1. Abbott N.J. Prediction of blood–brain barrier permeation in drug discovery, from in vivo, in vitro and in silico models. Drug Discovery Today: Technol. 2004;1:407–416. - PubMed
    1. Abbott N.J., Hughes C.C.W., Revest P.A., Greenwood J. Development and characterisation of a rat brain capillary endothelial culture: towards an in vitro blood–brain barrier. J. Cell Sci. 1992;103:23–37. - PubMed
    1. Abbott N.J., Patabendige A.A.K., Dolman D.E.M., Yusof S.R., Begley D.J. Structure and function of the blood–brain barrier. Neurobiol. Dis. 2010;37:13–25. - PubMed
    1. Abbott N.J., Rönnbäck L., Hansson E. Astrocyte-endothelial interactions at the blood–brain barrier. Nat. Rev. Neurosci. 2006;7:41–53. - PubMed

Publication types