. 2012 Jul 12;7(8):1479-96.
doi: 10.1038/nprot.2012.075.

Myocardial infarction and intramyocardial injection models in swine

Affiliations

Myocardial infarction and intramyocardial injection models in swine

Frederic C McCall et al. Nat Protoc. .

Abstract

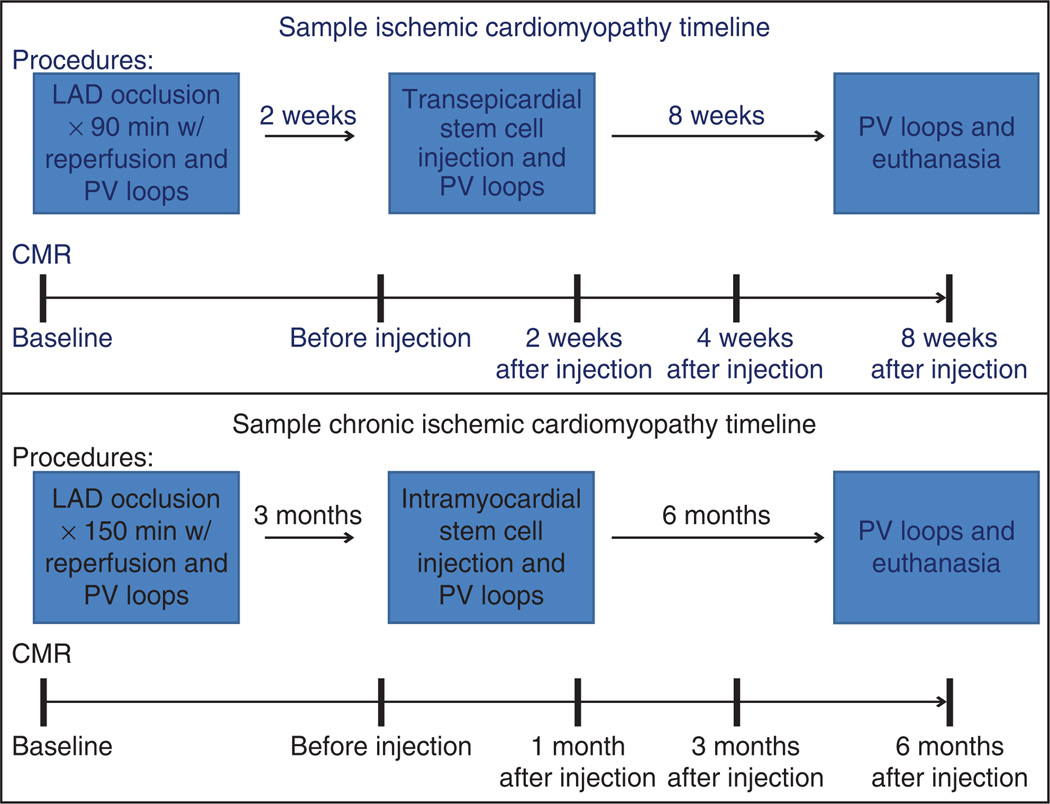
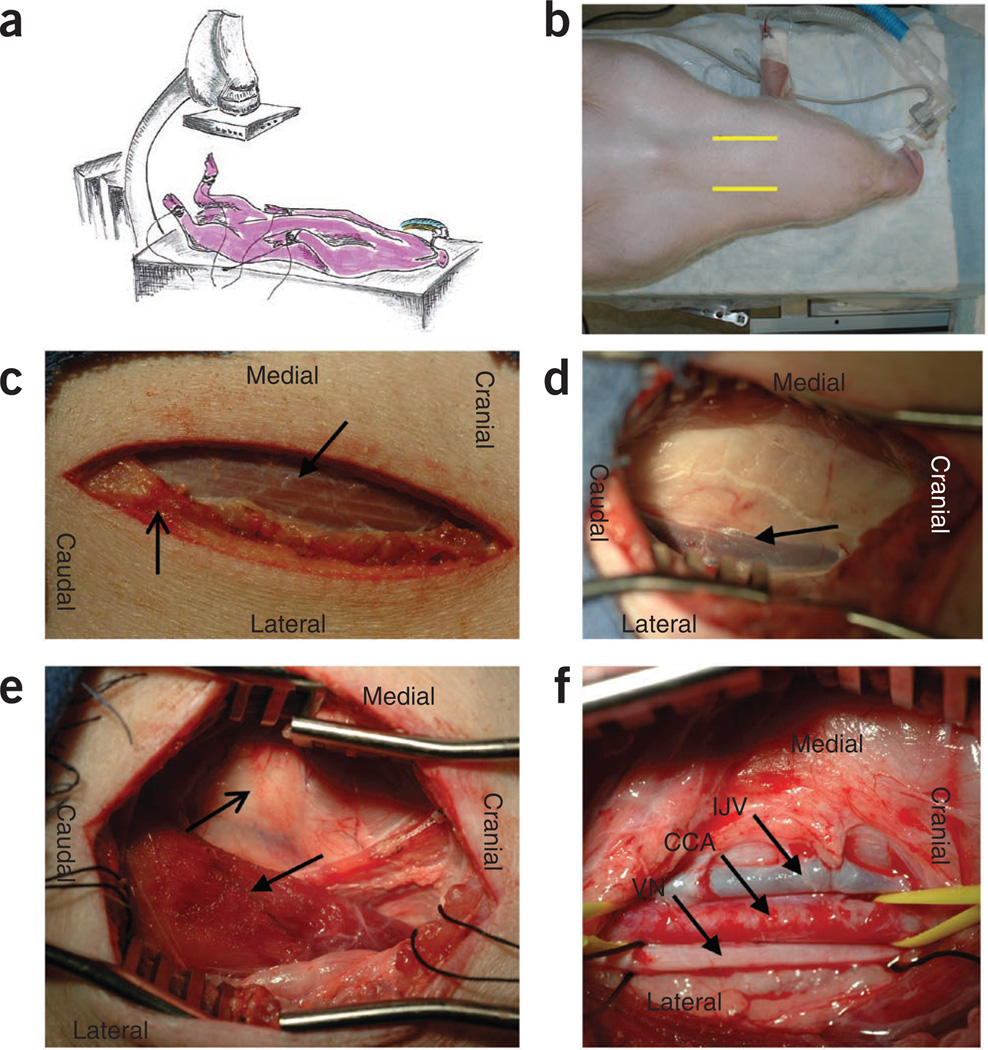
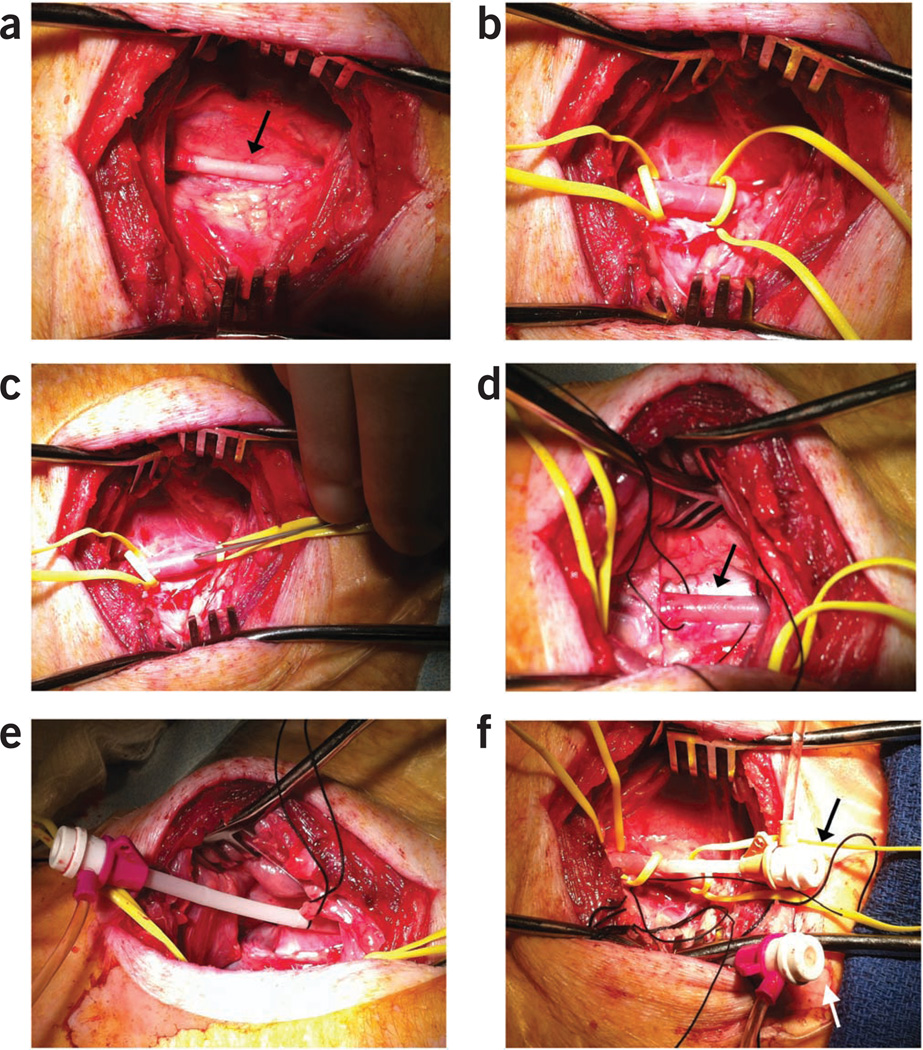
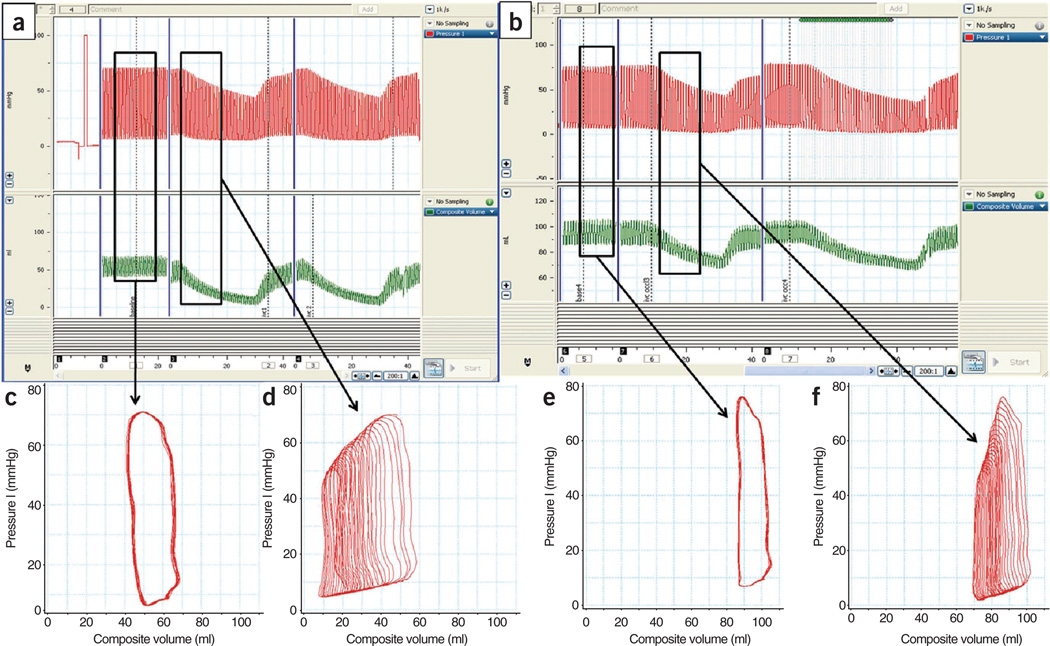
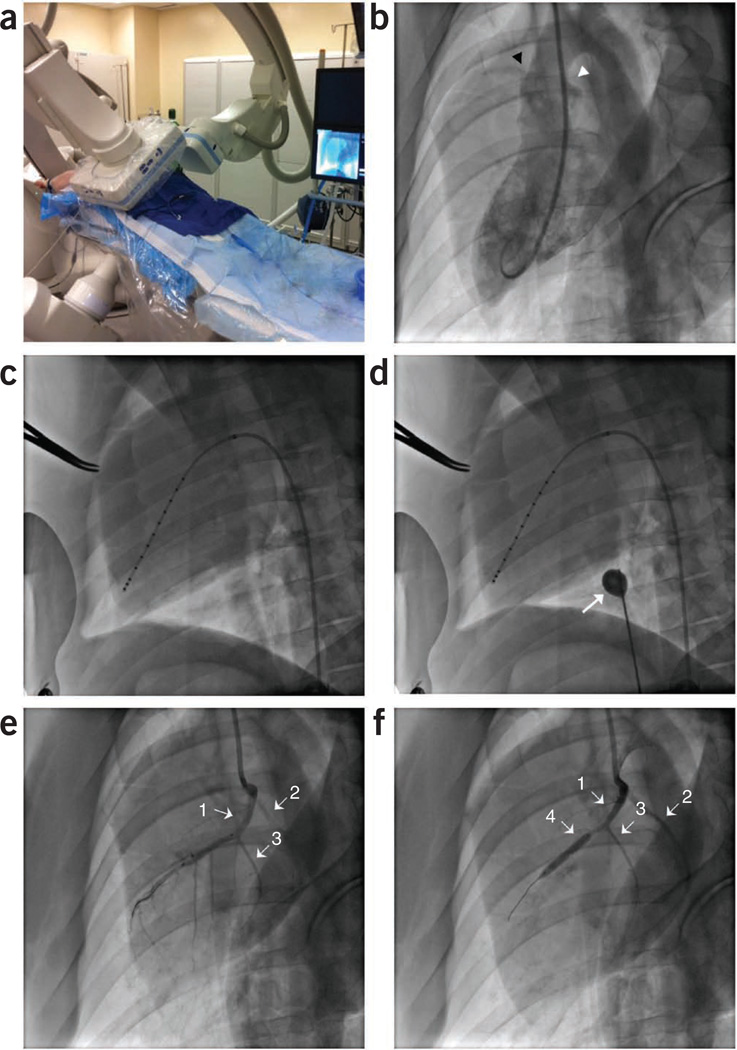
Sustainable and reproducible large animal models that closely replicate the clinical sequelae of myocardial infarction (MI) are important for the translation of basic science research into bedside medicine. Swine are well accepted by the scientific community for cardiovascular research, and they represent an established animal model for preclinical trials for US Food and Drug Administration (FDA) approval of novel therapies. Here we present a protocol for using porcine models of MI created with a closed-chest coronary artery occlusion-reperfusion technique. This creates a model of MI encompassing the anteroapical, lateral and septal walls of the left ventricle. This model infarction can be easily adapted to suit individual study design and enables the investigation of a variety of possible interventions. This model is therefore a useful tool for translational research into the pathophysiology of ventricular remodeling and is an ideal testing platform for novel biological approaches targeting regenerative medicine. This model can be created in approximately 8-10 h.


Figures

Figure 1
Figure 1
Flowchart depicting representative experimental timelines for acute chronic ICM. Typical experimental timeline showing surgical procedures and serial CMR analysis through 8 weeks and 6 months follow-up after intervention for acute and chronic ICM studies, respectively.
Figure 2
Figure 2
Surgery, anesthesia and angiography equipment required for models of ischemic heart disease. (a) Typical surgical tray setup with Gemini-Mixter forceps, no. 3 scalpel handle, Senn retractor, Weitlaner retractors, Mayo scissors, Metzenbaum scissors, needle holder, Kelly and mosquito forceps, Backhaus towel clamps, Gerald forceps, Debakey forceps and Adson forceps. (b) Closed-circuit anesthesia system with isoflurane vaporizer, veterinarian anesthesia ventilator and oxygen cylinder. (c) Biplane system, anesthesia cart, swine positioning table adapter. (d) Siemens Artis zee biplane system.
Figure 3
Figure 3
Cardiac MRI imaging techniques showing the extent of MI. (a–d) Myocardial wall thinning, LV chamber dilation and scar, highlighted by white arrows, 2 weeks after MI as shown in LGE-MRI (a); four-chamber long axis showing apical septal scar (b); LGE-MRI short axis images showing anteroseptal scar (c); and LGE-MRI two-chamber long axis showing anterior scar (d). Three-dimensional reconstruction of the heart. Red fill shows the endocardial wall of the LV chamber and the green mesh indicates the epicardial wall. The reconstruction demonstrates the dilation and thinning of the anterior-apical walls.
Figure 4
Figure 4
Neck vasculature and musculature of the swine. Superficial and deep dissection illustrating the landmarks and vessels used for surgical dissection and cannulation of the vasculature in the neck. Note that the sternomastoideus has been removed on the swine’s right to show the underlying anatomical structures in the carotid sheath.
Figure 5
Figure 5
Surgical dissection of the vasculature of the neck in the swine. (a) Pig positioned in dorsal recumbent position and secured with legs retracted caudolaterally. (b) Pig with i.v. and ET tube properly secured. Yellow lines highlight jugular furrow for incision site. (c) Incision site over jugular furrow with cutaneous colli highlighted by the open-tip arrow and the sternohyoideus highlighted by the closed-tip arrow. (d) External jugular vein (EJV) highlighted by the arrow. The sternohyoideus is retracted in the medial aspect of the picture and the brachiocephalic muscle is retracted in the lateral aspect of the picture. The sternomastoideus muscle is located beneath the white fascia in the center of the photo, (e) The carotid sheath is located medial to the sternomastoideus (closed tip arrow) and dorsally along the lateral plane of the trachea (open tip arrow). (f) The internal jugular vein (IJV), common carotid artery (CCA) and the vagus nerve (VN) are exposed after blunt dissection of the carotid sheath.
Figure 6
Figure 6
Vasculature access via a modified Seldinger technique. (a) Right carotid artery exposed and bluntly dissected (arrow). (b) Distal and proximal control of the artery is obtained using vessel loops. Note the dilation of the artery after bathing with 2% lidocaine. (c) 18-gauge, 2 3/4-inch Seldinger needle passing into the arterial lumen to advance an 0.038-inch guidewire before the introduction of a 7F introducer. (d) External jugular vein with proximal and distal 0 silk ties in place for vessel control. (e) 10F introducer in the vein with proximal tie and distal ligation of the vessel. (f) 7F and 10F sheaths in the carotid artery (black arrow) and the external jugular vein (white arrow), respectively, for vascular access.
Figure 7
Figure 7
I Pressure-volume data obtained using a micromanometer conductance catheter. (a–f) Characteristic changes (a,b) in porcine LV pressure (red trace) and volume (green trace) from steady state (c,e) to various changes in preloads (d,f). Panels a,c and d show pressure-volume relationships at the baseline, whereas panels b,e and f show the corresponding relationships 2 weeks after MI.
Figure 8
Figure 8
Cardiac fluoroscopic and angiographic imaging depicting placement of diagnostic catheters and induction of MI. MI model. (a) Swine placed dorsally recumbent under biplane angiography. Vascular access is shown through the right carotid artery and the right external jugular vein. (b) Left ventriculogram (right anterior oblique 30° view) showing the right and left coronary ostia, as highlighted by the black and white arrowheads, respectively. (c) Pressure-volume conductance catheter properly placed along the long axis of the left ventricle. (d) Balloon occlusion catheter (white arrow) inflated to decrease preload on heart during pressure-volume loop data collection. (e) Left coronary angiogram showing the LAD (arrow 1), LCX (arrow 2) and the first diagonal branch of the LAD (arrow 3). (f) Left coronary angiogram showing the LAD (arrow 1), LCX (arrow 2), and the first diagonal branch of the LAD (arrow 3) and the PTCA balloon obstructing all distal flow of the LAD past the first diagonal (arrow 4).
Figure 9
Figure 9
Representative electrocardiographic changes during MI. Leads I, II and III show morphological ST segment depression indicative of cardiac ischemia. aVL leads show entry of ventricular fibrillation and return of normal sinus rhythm after 150-J biphasic defibrillation.
Figure 10
Figure 10
Surgical- and catheter-based injections of stem cells. Intramyocardial injection model (a) minithoracotomy (black arrow) with thoracoscope (white arrow) shown illuminating the heart. (b) Thoracoscopic view of the pericardiotomy. (c) Intramyocardial injections through the minithoracotomy sight. (d) Thoracoscopic view of the intramyocardial injections. Note the LAD running in the intraventricular groove (arrow 1) and the first diagonal branch of the LAD (arrow 2). (e) BioCardia Morph with deflectable tip directing the Helix biotherapeutic delivery catheter system into the targeted area of the myocardium adjacent to the infarction. (f) GFP+ stem cell identified after intramyocardial injection through postmortem histopathology analysis (white arrow). DAPI, 4’,6-diamidino-2-phenylindole; Gata-4, Transcription factor Gata-4.
Figure 11
Figure 11
Representative pressure-volume loops before and after MI model creation. Representative pressure-volume loops demonstrating pathological changes from baseline to 2 weeks after MI. The decrease in the slope of the end systolic pressure-volume relationship (ESPVR) curve (straight arrow) indicates considerable contractility impairment, and the steeper slope of the end diastolic pressure-volume relationship (EDPVR) curve (curved arrow) reflects the increase in ventricular stiffness.
Figure 12
Figure 12
Ventricular remodeling in the chronic MI model. MRI data for Göttingen swine MI. (a–d) Two-chamber long axis MRI views that illustrate the chamber dilation and wall thinning after MI. (e–h) Short axis LGE-MRI images that show the scar progression and stabilization. Images a and e are baseline images taken before MI. Images b and f are 10 d after MI, images c and g are 4 weeks after MI and images d and h represent 12 weeks after MI. (i–l) Graphic representations in the changes seen in measures of cardiovascular function after MI. Image i demonstrates the initial increase in scar size as a result of the infarction and subsequent stabilization. Images j and k show the steady rise in EDV and ESV over the 12-week duration. Image l shows the decreasing EF over the 12-week duration.

References

    1. Heidenreich PA, et al. Forecasting the future of cardiovascular disease in the United States. Circulation. 2011;123:933–944. - PubMed
    1. Roger VL, et al. Heart Disease and Stroke Statistics—2011 Update. Circulation. 2011;123:el8–e209. - PMC - PubMed
    1. Swindle M. Swine in the Laboratory: Surgery, Anesthesia, Imaging, and Experimental Techniques. Taylor & Francis Group; 2007.
    1. Dondelinger RF, et al. Relevant radiological anatomy of the pig as a training model in interventional radiology. Eur. Radiol. 1998;8:1254–1273. - PubMed
    1. Amado LC, et al. Cardiac repair with intramyocardial injection of allogeneic mesenchymal stem cells after myocardial infarction. Proc. Natl. Acad. Sci. USA. 2005;102:11474–11479. - PMC - PubMed

Publication types