. 2012 Jul;75(7):076601.
doi: 10.1088/0034-4885/75/7/076601. Epub 2012 Jun 28.

Biomolecular dynamics: order-disorder transitions and energy landscapes

Affiliations

Biomolecular dynamics: order-disorder transitions and energy landscapes

Paul C Whitford et al. Rep Prog Phys. 2012 Jul.

Abstract

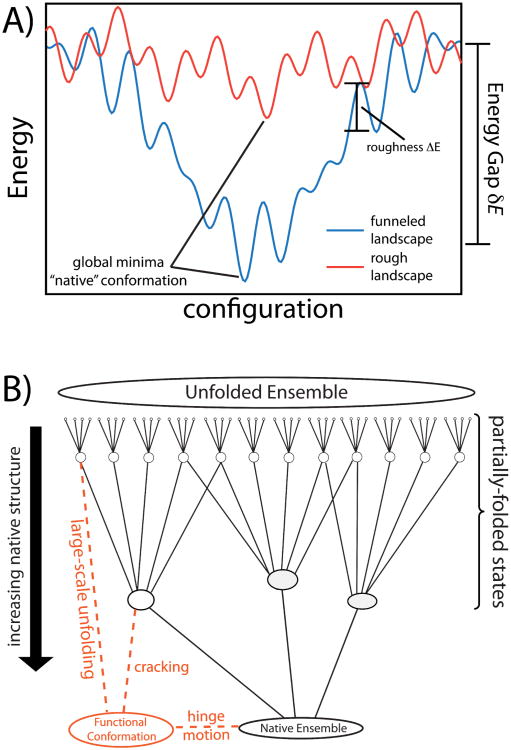
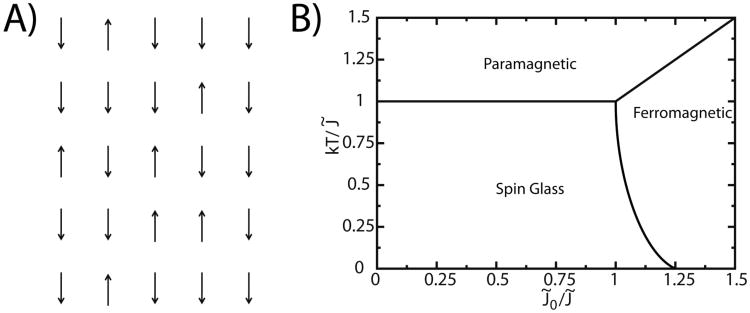
While the energy landscape theory of protein folding is now a widely accepted view for understanding how relatively weak molecular interactions lead to rapid and cooperative protein folding, such a framework must be extended to describe the large-scale functional motions observed in molecular machines. In this review, we discuss (1) the development of the energy landscape theory of biomolecular folding, (2) recent advances toward establishing a consistent understanding of folding and function and (3) emerging themes in the functional motions of enzymes, biomolecular motors and other biomolecular machines. Recent theoretical, computational and experimental lines of investigation have provided a very dynamic picture of biomolecular motion. In contrast to earlier ideas, where molecular machines were thought to function similarly to macroscopic machines, with rigid components that move along a few degrees of freedom in a deterministic fashion, biomolecular complexes are only marginally stable. Since the stabilizing contribution of each atomic interaction is on the order of the thermal fluctuations in solution, the rigid body description of molecular function must be revisited. An emerging theme is that functional motions encompass order-disorder transitions and structural flexibility provides significant contributions to the free energy. In this review, we describe the biological importance of order-disorder transitions and discuss the statistical-mechanical foundation of theoretical approaches that can characterize such transitions.


Figures

Figure 1
Figure 1. The diversity of protein and RNA residues (top)
Protein chains are composed of amino acid residues, which contain carbon (orange spheres), nitrogen (blue), oxygen (red), sulfur (yellow) and hydrogen (white) atoms. Each amino acid has a common set of C, N, O and H atoms (boxed). The range of chemical compositions of residues is depicted by the atomic structures of 5 of the 20 naturally-occurring) different amino acids. (bottom) RNA chains are composed of 4 type of nucleic acids. Each nucleic acid has a common set of backbone atoms (left). Canonical Watson-Crick base pairs are formed between A-U and C-G pairs (right). Structural figures were prepared with VMD (277).
Figure 2
Figure 2. Gene expression in the cell
The two fundamental steps of gene expression are transcription and translation. A) In prokaryotes, messenger RNA (mRNA) is transcribed and then read by ribosomes to produce proteins. B) In eukaryotes, precursor-mRNA is produced during transcription. Pre-mRNA is modified and transported in the cell and then mature mRNA is read by ribosomes. There are many types of post-transcriptional modifications that may be performed on pre-mRNA, though only splicing is depicted. During splicing, specific sequence of mRNA (introns) are removed from the pre-mRNA. C) Once a protein is synthesized by the ribosome, it folds to the lowest-energy “native” ensemble.
Figure 3
Figure 3. Energy landscapes of biomolecular folding
A) When the energy landscape of a system is rough red), the system must search randomly for the lowest-energy configuration and glass-like dynamics may arise. Biomolecules have evolved to have a large energy gap between the unfolded and folded ensembles δE, relative to the energetic roughness ΔE. “Funneled” energy landscapes (blue) enable rapid folding of biomolecules in vivo. B) An alternate representation of a funneled landscape that is extended to account for functional rearrangements. Functional biomolecules often possess multiple basins of attraction and there are many mechanisms by which functional transitions may occur. Cracking, hinge-motion and large-scale unfolding orange) encompass different degrees of molecular disorder and they result in differential forms of connectivity between the functional and native ensembles.
Figure 4
Figure 4. Spin systems and glass transitions
A) A two-dimensional Ising spin model. B) Schematic of the phase diagram for the SK spin-glass model. In the SK spin-glass, three states can exist: paramagnetic, ferromagnetic, and glass. The balance of energetic roughness (), ferromagnetic coupling (0) and temperature T determines which state the system adopts.
Figure 5
Figure 5. Lattice model for protein dynamics
In lattice models of proteins, the residues (spheres) move between adjacent lattice positions. Similar to proteins in solution, backbone connectivity (grey) leads to sequential residues being adjacent in space. In this model, the degree of hydrophobicity is indicated by the sphere colors. The sequence shown is taken from Leopold et al., and it represents a maximally-compact configuration (19).
Figure 6
Figure 6. Multiple representations of proteins
The protein Chymotrypsin Inhibitor 2 (CI2) pdb entry: 2ci2) shown in A) stick representation, B) all-atom representation excluding hydrogens) that depicts the excluded volume of the atoms, and C) Cα representation that is often used in molecule simulations. Each residue type is give a unique color, highlighting the heterogeneity of protein sequences.
Figure 7
Figure 7. Protein structures vary in complexity
A) Protein A pdb: 1BDD) is composed of three α-helices and is considered a simple fold. B) The SH3 domain of Src (pdb: 1FMK) is composed of two adjacent β-hairpins, which leads to more-complex folding dynamics. Protein L pdb: 2ptl) (panel C) and G (panel D) (pdb: 3gp1) share a common overall fold, but they exhibit different folding dynamics in solution. Inspection of the packing of residues in the core of the protein (E, F) shows that the fine details of these interactions are different. Side chains are shown explicitly for residues that are in contact between the helix and the sheet. These packing effects lead to unique folding dynamics of the proteins (122).
Figure 8
Figure 8. Topologically frustrated structures
Two classes of proteins that are considered to be of “complex” folds are knotted proteins (top, stereo view. PDB: 2EFV) and the Interleukin family of proteins (bottom, stereo view. PDB: 6I1B). In the knotted protein, folding involves the formation of a loop and then threading of the terminal end through the loop. If the loop closes prematurely, then the threading process will be inhibited by excluded volume effects. In the Interleukin family, there is structural competition between regions during folding. If the C-terminal trefoil folds early, the protein “backtracks” and partially unfolds before full folding occurs.
Figure 9
Figure 9. Side-chain ordering and backbone collapse during protein folding
A) A simulated folding trajectory of CI2, shown as a function of the radius of gyration Rg (blue), fraction of native all-atom contacts formed Qall-atom (black) and fraction of native Cα contacts formed Q. Rg measures backbone collapse, which decreases when Qall-atom and Q increase. Q reaches larger values than Qall-atom indicating that the backbone is ordered, while the side chains are not in their native configurations. B) 〈Qall-atom〉 and 〈Q〉 as function of T indicate that both coordinates capture the global folding transition. C) As temperature is reduced below Tf, there is continuous movement of the native basin to higher values of Qall-atom. D) Residues in SH3 that have a larger fraction of Cα contacts formed than all-atom contacts are depicted by yellow spheres.
Figure 10
Figure 10. The Ribosome Center)
Atomic structure of an in-tact 70S ribosome (∼150,000 non-hydrogen atoms). Transfer (RNA tRNA, P-site tRNA shown in red) molecules read messenger RNA (mRNA) through interactions on the “small” (30S) subunit and add the incoming amino acid to the growing protein chain located in the “large” (50S) subunit. An additional tRNA i.e. the A-site tRNA) is buried deep inside of the ribosome. During protein synthesis, the 50S “stalks” assist movement of tRNA molecules. The L11 stalk (right) aids the entry of incoming tRNA molecules and the L1 stalk (left) facilitates the disassociation of tRNA molecules. NMA, simulations with SBMs and simulations with explicit solvent suggest that the stalks are very flexible (i.e. have low-energy displacements), relative to other components of the ribosome.
Figure 11
Figure 11. Functional configurations of Adenylate Kinase
Adk is composed of three domains: LID (red), NMP (blue) and core (grey). A) When a ligand is not present, the dominant configuration has the domains arranged in a more extended fashion. B) Upon ligand binding, the molecule adopts a compact conformation, where the ligand is isolated and chemistry is permitted. AP5A is a bi-substrate analogue that mimics the natural substrates of Adk: ATP and AMP.
Figure 12
Figure 12. Macroscopic and Microscopic Mixing
When combing two potential energy functions, one may combine them term-by-term, or in a global fashion. A) Two hypothetical potential energy surfaces, where each curve depicts the total energy in each potential, given in terms of an arbitrary coordinate. B) Two 10-12 interactions that are defined for the same atom-atom pair. This depiction represents a pair that is 6Å in one configuration and 10Å in the second. C) A macroscopically-mixed (Boltzmann) Hamiltonian, using the two potentials in (A) as input. Different values of the mixing temperature Tmixing and weighting factor Ci are shown. D) A microscopically-mixed atom-atom potential energy function that includes minima at both 6 and 10 Å. This representation uses a Gaussian function for the minimum at 10 Å.
Figure 13
Figure 13. Cracking during functional rearrangements
Iterative normal mode analysis suggests large levels of strain energy accumulate (black) during conformational rearrangements. To relieve strain that is localized to specific residues, biomolecules may crack, or partially unfold and refold. By unfolding, a large number of unfolded configurations are accessible (red), which increases the entropy of the transition state ensemble and reduces the free-energy barrier associated with the transition (blue). X-ray crystallographic data and NMR measurements (27) probe the fluctuations local to a particular energetic basin (yellow lines), and the local excitations can have dynamics that are correlated with large-scale rearrangements (134).
Figure 14
Figure 14. Riboswitch folding and ligand recognition
A) Secondary structure of the SAM-1 riboswitch. The P1 helix is formed by the terminal residues, making it a non-local helix (125). B) Average fraction of native P1 contacts formed (〈QP1〉) as a function of the fraction of all native contacts being formed (Qtotal) is shown in blue. Potential of mean force shown in green. The largest barrier in the pmf corresponds to folding of the P1 helix. C) Same as (B), but in the presence of the SAM ligand. The average fraction of ligand interactions 〈Qligand〉 is shown in magenta. Ligand binding induces earlier folding of P1 and it reduces the associated barrier. D) Structural representation of the final step of folding, when the SAM ligandis present. All secondary structure, along with some tertiary structure is formed, and the ligand binds prior to P1 structure formation.
Figure 15
Figure 15. Entropy changes in the 3′-CCA end of aa-tRNA during accommodation
Atomic models of tRNA (A-site tRNA in yellow, P-site tRNA in red) and mRNA (green) at different points during accommodation. Amino acids attached to the ends of tRNA are shown in blue. A) Atomic model of the A/A configuration of tRNA, based on cryo-EM densities. Three reaction coordinates for describing accommodation (RElbow, RArm, R3) are indicated. B/C) Intermediate populations predicted from simulations (268) suggest that transient interactions are formed with the A loop (pink) and H89 (gray) of the large subunit. D) Endpoint of accommodation, as determined from x-ray crystallography. E) Pseudo-dihedral angle Φ2 describes the configuration of the 3′-CCA end as it enters the center of the ribosome. F) During accommodation, the range of accessible configurations of the 3′-CCA end decreases, indicative of an entropic penalty for accommodation.

Similar articles

Cited by

References

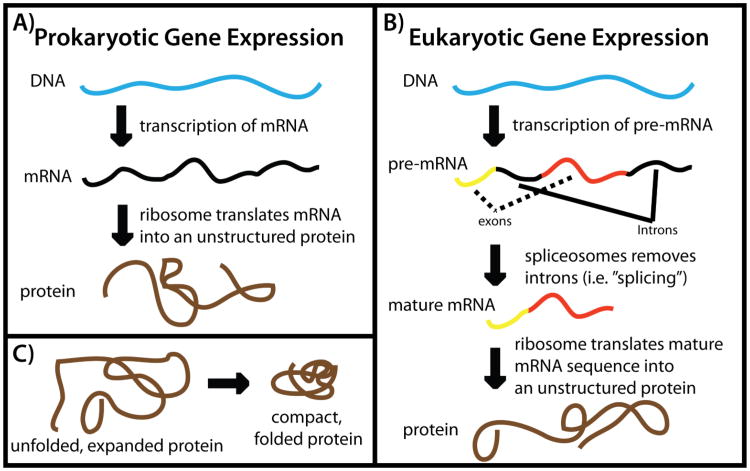
    1. Cech TR. Self-splicing of group-I introns. Annu Rev Biochem. 1990 Jan;59:543–568. - PubMed
    1. Mcclain WH, Guerriertakada C, Altman S. Model substrates for an RNA enzyme. Science. 1987 Jan;238(4826):527–530. - PubMed
    1. Yonath A. Large facilities and the evolving ribosome, the cellular machine for genetic-code translation. J Royal Soc Inter. 2009 Aug;6:S575–S585. - PMC - PubMed
    1. Frank J, Gao H, Sengupta J, Gao N, Taylor DJ. The process of mRNA-tRNA translocation. Proc Nat Acad Sci USA. 2007 Dec;104(50):19671–8. - PMC - PubMed
    1. Yusupov MM, Yusupova GZ, Baucom A, Lieberman K, Earnest TN, Cate JH, Noller HF. Crystal structure of the ribosome at 5.5 a resolution. Science. 2001 May;92(5518):883–96. - PubMed

Publication types

LinkOut - more resources