. 2012 Dec;19(12):1992-2002.
doi: 10.1038/cdd.2012.89. Epub 2012 Jul 13.

Insights into p53 transcriptional function via genome-wide chromatin occupancy and gene expression analysis

Affiliations

Insights into p53 transcriptional function via genome-wide chromatin occupancy and gene expression analysis

F Nikulenkov et al. Cell Death Differ. 2012 Dec.

Abstract

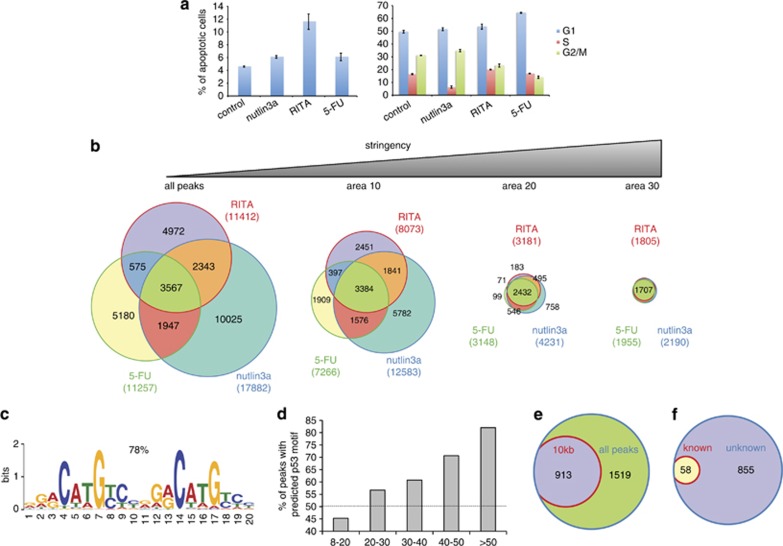
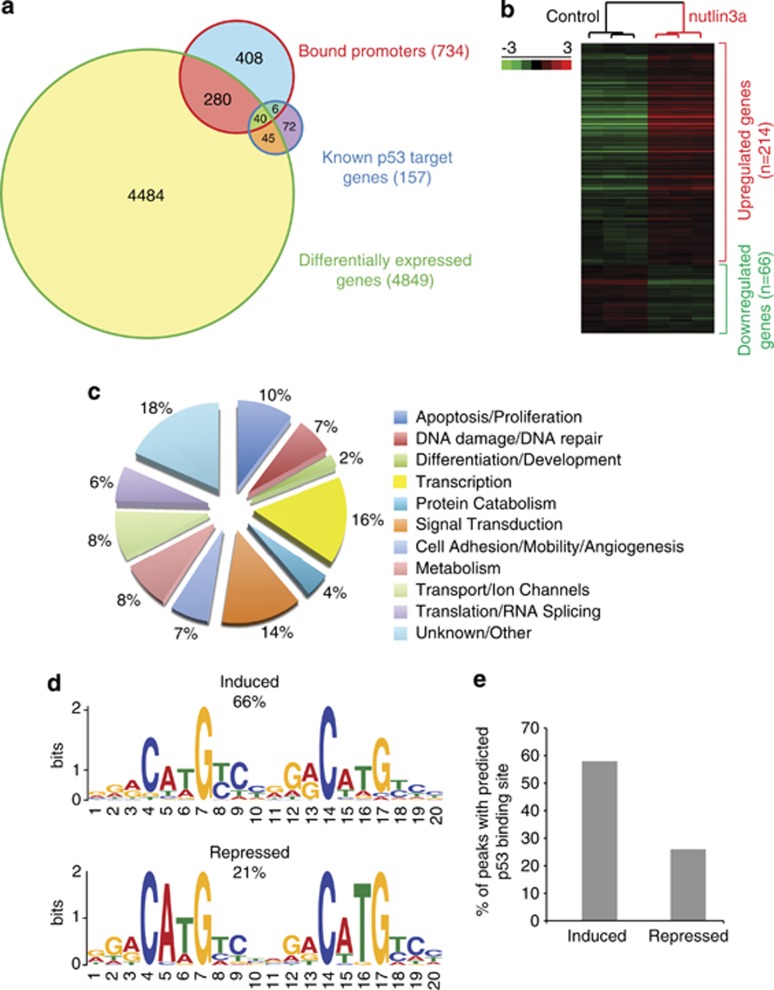
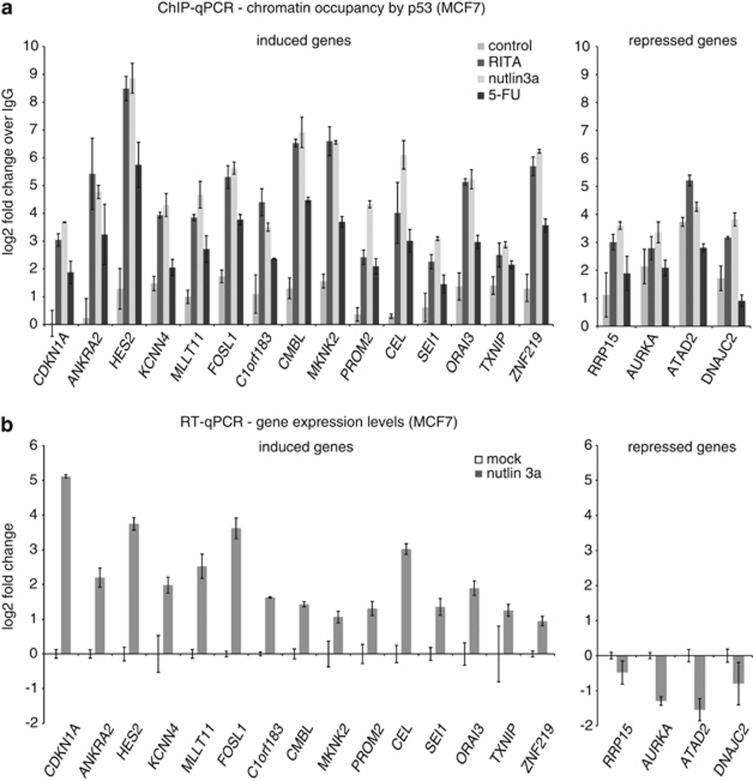
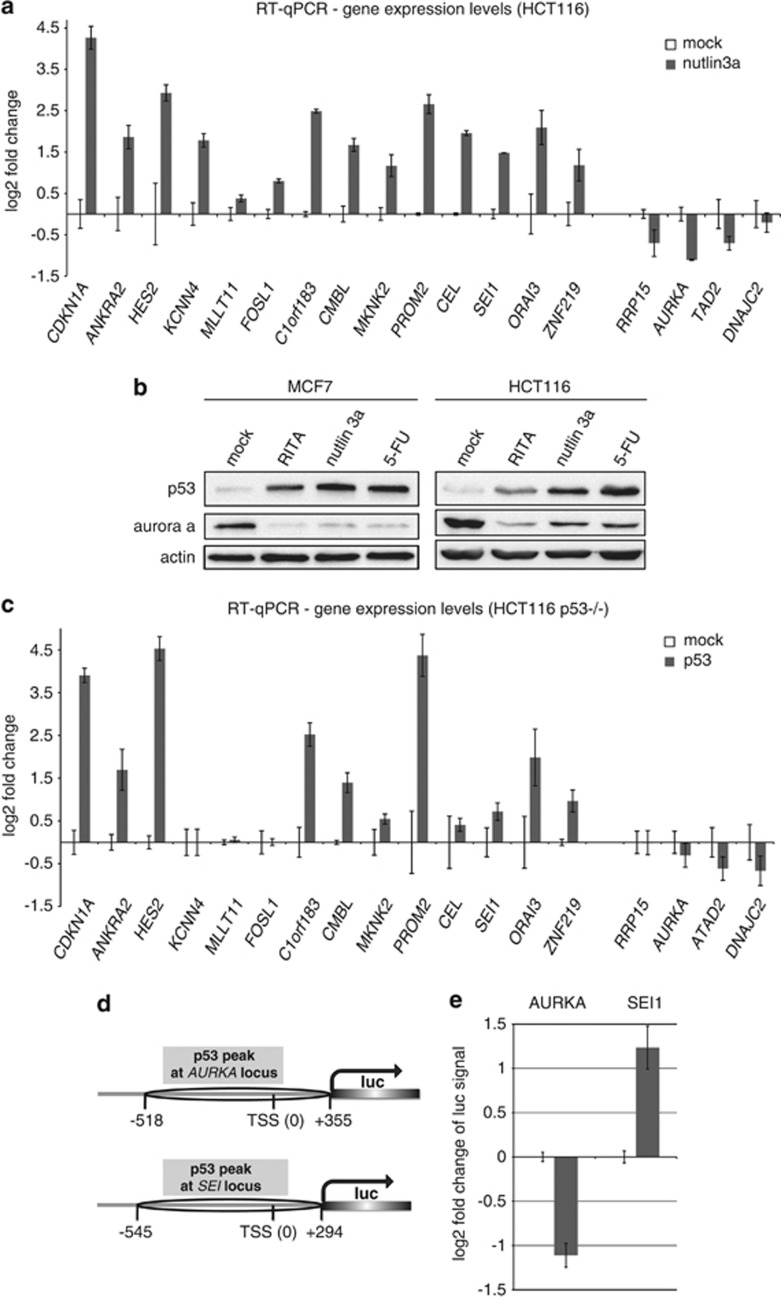
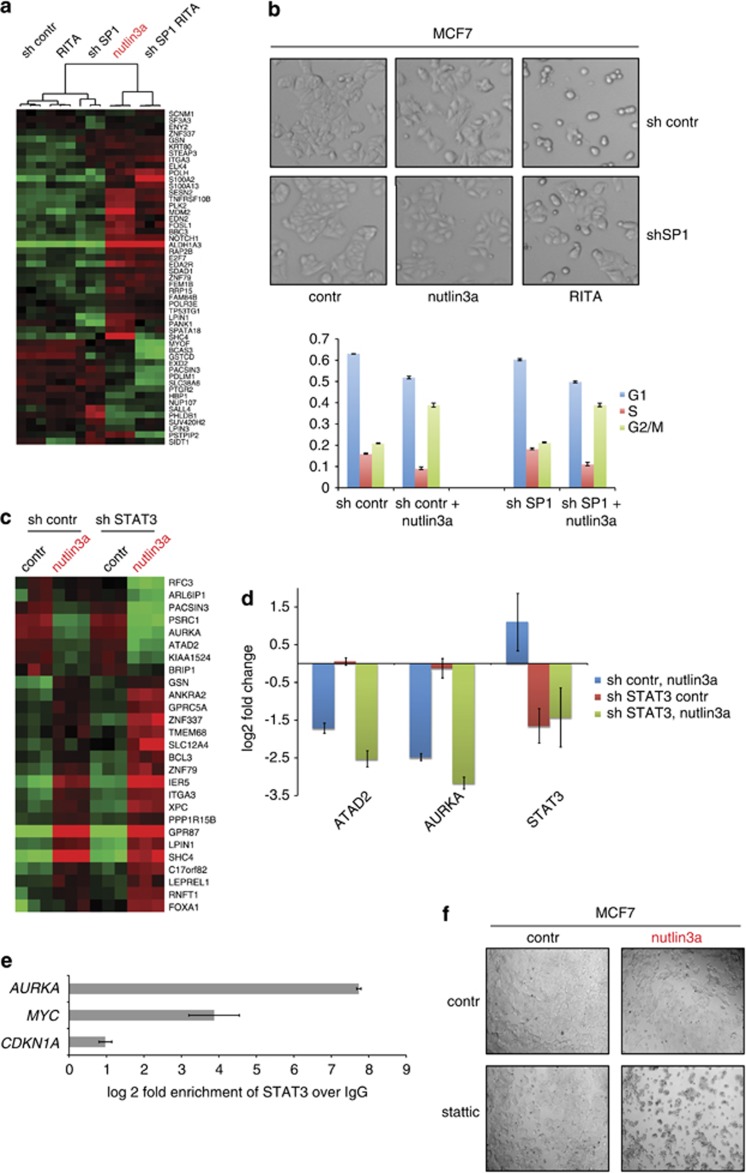
The tumor-suppressor p53 can induce various biological responses. Yet, it is not clear whether it is p53 in vivo promoter selectivity that triggers different transcription programs leading to different outcomes. Our analysis of genome-wide chromatin occupancy by p53 using chromatin immunoprecipitation (ChIP)-seq revealed 'p53 default program', that is, the pattern of major p53-bound sites that is similar upon p53 activation by nutlin3a, reactivation of p53 and induction of tumor cell apoptosis (RITA) or 5-fluorouracil in breast cancer cells, despite different biological outcomes. Parallel analysis of gene expression allowed identification of 280 novel p53 target genes, including p53-repressed AURKA. We identified Sp1 as one of the p53 modulators, which confer specificity to p53-mediated transcriptional response upon RITA. Further, we found that STAT3 antagonizes p53-mediated repression of a subset of genes, including AURKA.


Figures

Figure 1
Figure 1
Characterization of the global chromatin occupancy by p53 upon its activation by nutlin3a, RITA and 5-FU. (a) Induction of apoptosis upon nutlin3a, RITA and 5-FU treatment of MCF7 cells was detected by fluorescence-activated cell sorting (FACS) of annexin V-stained cells (left) and cell-cycle profiles were assessed by FACS of PI-stained cells (right). (b) Venn diagrams were obtained by intersection of all p53-bound DNA fragments (ChIP-Seq peaks, P<0.05) obtained from MCF7 cells treated with nutlin3a-, 5-FU- and RITA and filtering according to the area. (c) The p53 consensus binding motif was identified de novo by analyzing the sequences of 500 randomly selected peaks common for all the three treatments using the program MEME (d). The fraction of peaks containing the p53 consensus site increased along with increased stringency of peak selection. (e) A Venn diagram demonstrates the proportion of p53-bound fragments located within ±10 kb of the TSS (913 out of 2432). (f) A Venn diagram shows the proportion of peaks located in the vicinity of known and unknown p53-target genes bound within ±10 kb of TSS upon all three treatments. See also Supplementary Figure S1, Supplementary Figure S2 and Supplementary Tables S1–S4
Figure 2
Figure 2
Novel p53-target genes bound by p53 and differentially expressed upon nultin3a treatment. (a) Bioinformatic analysis of the genes bound by p53 within 10 kbp from TSS and differentially expressed upon 8 h of nutlin3a treatment (P<0.05) revealed 280 putative novel p53-target genes. (b) A heatmap shows the differential expression of selected 280 p53-bound genes upon nutlin3a treatment. Columns indicate separate arrays and rows indicate genes. The values are row-mean-centered. Green corresponds to lower and red to higher than mean value expression. (c) The pie chart of the functional categories of 280 novel p53-target genes. (d) The p53 consensus binding site was detected much more often in the proximity of TSS of induced, than repressed genes (66% and 21%, respectively), as analyzed using the MEME algorithm. (e) The probability of the presence of a p53 consensus binding motif in the p53-bound fragment is higher in induced than in repressed genes
Figure 3
Figure 3
Validation of chromatin occupancy and mRNA expression of a selected panel of newly identified p53-target genes. (a) ChIP using the anti-p53 antibody DO-1, followed by qPCR, was used to detect relative p53 occupancy in the promoters of 18 selected genes in MCF7 cells treated with nutlin3a, RITA and 5-FU for 8 h. CDKN1A serves as a positive control for p53 binding. (b) The mRNA levels of 18 selected genes were detected by qPCR in MCF7 cells treated with nutlin3a
Figure 4
Figure 4
Further validation of novel p53-target genes. (a) Colon carcinoma HCT116 cells were treated with nutlin3a and the level of expression of 18 novel p53-target genes was assessed by qPCR. (b) The protein level of aurora kinase A was decreased upon p53 activation by nutlin3a, RITA and 5-FU in MCF7, as well as HCT116 cells, as assessed by immunoblotting. (c) Changes of mRNA levels of 18 selected genes were assessed by qPCR upon overexpression of p53 in the p53 null HCTTP53−/− cells. (d) Schemes depicting p53-bound fragments derived from the p53-induced SEI1 and p53-repressed AURKA promoters, which were cloned into a luciferase reporter plasmid. (e) The activity of luciferase reporter expressed under the control of AURKA and SEI1 promoters was assessed upon ectopic expression of p53 in HCTTP53−/− cells
Figure 5
Figure 5
Identification of Sp1 and STAT3 as important modulators of p53 transcriptional activity. (a) The heatmap shows the results of gene expression analysis of RITA-treated MCF7 cells in which Sp1 was stably depleted by short hairpin RNA (shRNA). (b) Sp1 depletion attenuated RITA-induced apoptosis, but did not affect nutlin3a-induced growth arrest, as assessed by microscopy analysis (upper panel) and FACS of PI-stained cells (lower panel). (c) The heatmap shows the results of gene expression analysis of nutlin3a-treated MCF7 cells in which STAT3 was stably depleted by means of shRNA. (d) Depletion of STAT3 by shRNA enhances p53-mediated repression of AURKA and ATAD2 as assessed by qPCR in MCF7 cells treated with nutlin3a. (e) STAT3 ChIP in MCF7 cells demonstrated the binding of STAT3 to the promoter of AURKA. CDKN1A served as a negative and MYC as a positive control for STAT3 chromatin binding. (f) Inhibition of STAT3 by stattic facilitated the growth-suppression effect of nutlin3a as assessed by light microscopy analysis of the MCF7 after 48 h of treatment. See also Supplementary Figure S5

References

    1. Goh AM, Coffill CR, Lane DP. The role of mutant p53 in human cancer. J Pathol. 2011;223:116–126. - PubMed
    1. Vousden KH, Prives C. Blinded by the light: the growing complexity of p53. Cell. 2009;137:413–431. - PubMed
    1. Vassilev LT, Vu BT, Graves B, Carvajal D, Podlaski F, Filipovic Z, et al. In vivo activation of the p53 pathway by small-molecule antagonists of MDM2. Science. 2004;303:844–848. - PubMed
    1. Issaeva N, Bozko P, Enge M, Protopopova M, Verhoef LG, Masucci M, et al. Small molecule RITA binds to p53, blocks p53-HDM-2 interaction and activates p53 function in tumors. Nat Med. 2004;10:1321–1328. - PubMed
    1. Ding K, Lu Y, Nikolovska-Coleska Z, Wang G, Qiu S, Shangary S, et al. Structure-based design of spiro-oxindoles as potent, specific small-molecule inhibitors of the MDM2-p53 interaction. J Med Chem. 2006;49:3432–3435. - PubMed

Publication types

MeSH terms