Review
. 2012 Sep;39(9):1497-509.
doi: 10.1007/s00259-012-2177-x. Epub 2012 Jul 13.

The motivations and methodology for high-throughput PET imaging of small animals in cancer research

Affiliations
Review

The motivations and methodology for high-throughput PET imaging of small animals in cancer research

Nicolas Aide et al. Eur J Nucl Med Mol Imaging. 2012 Sep.

Abstract

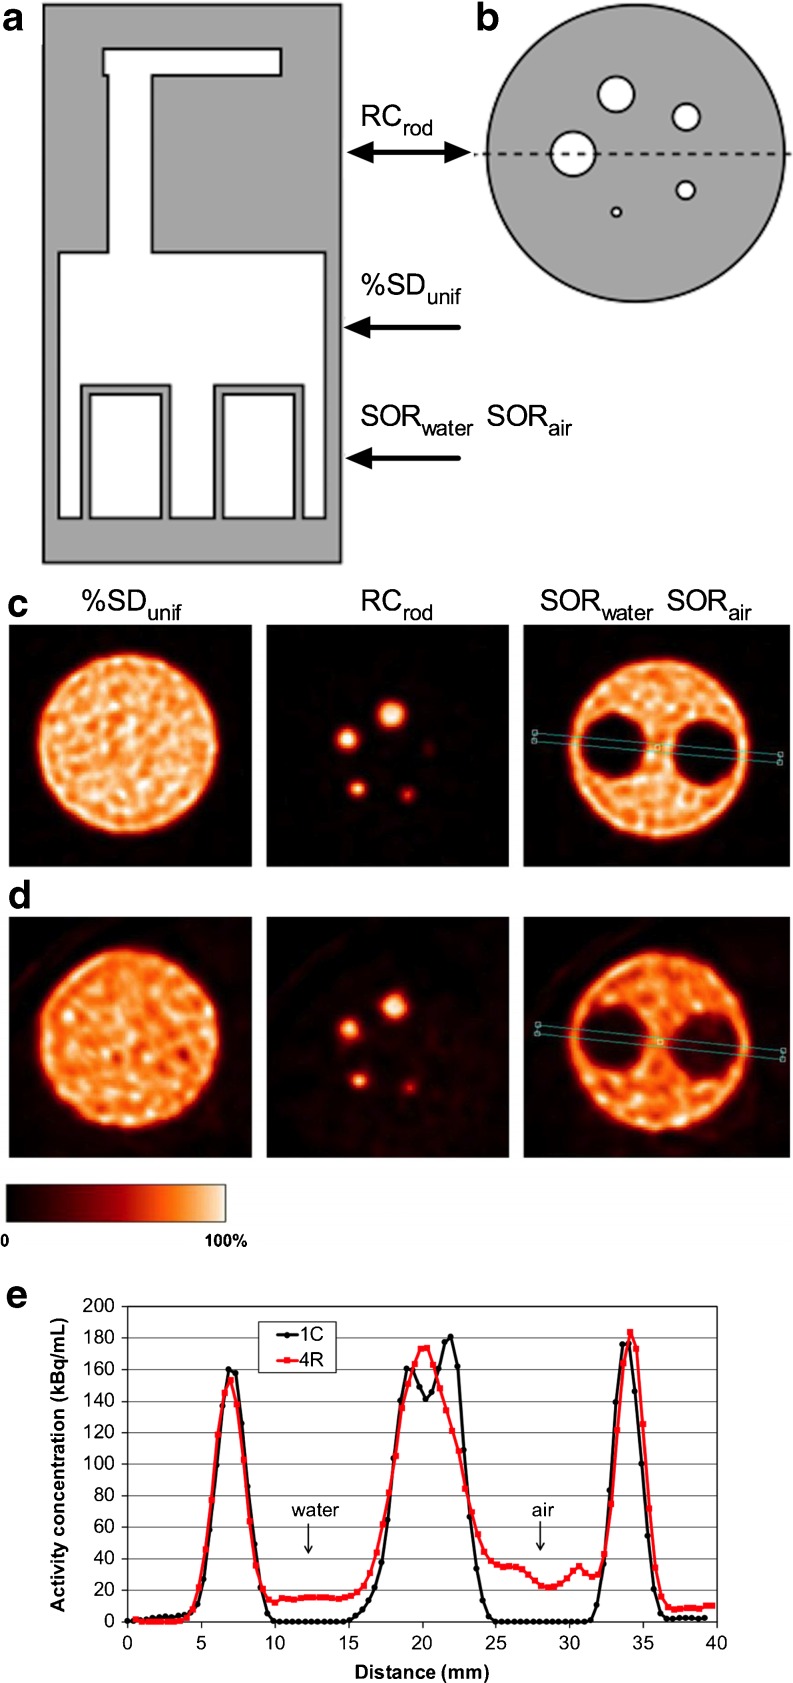
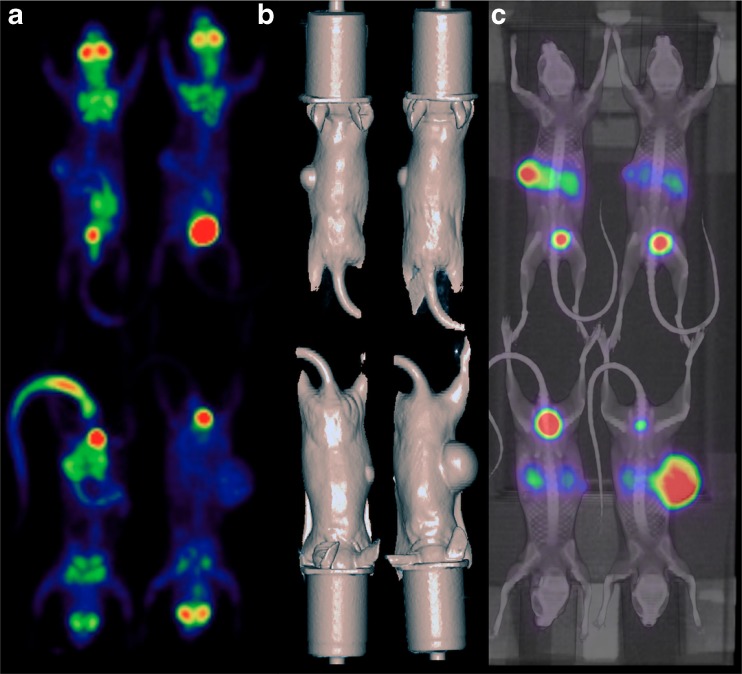
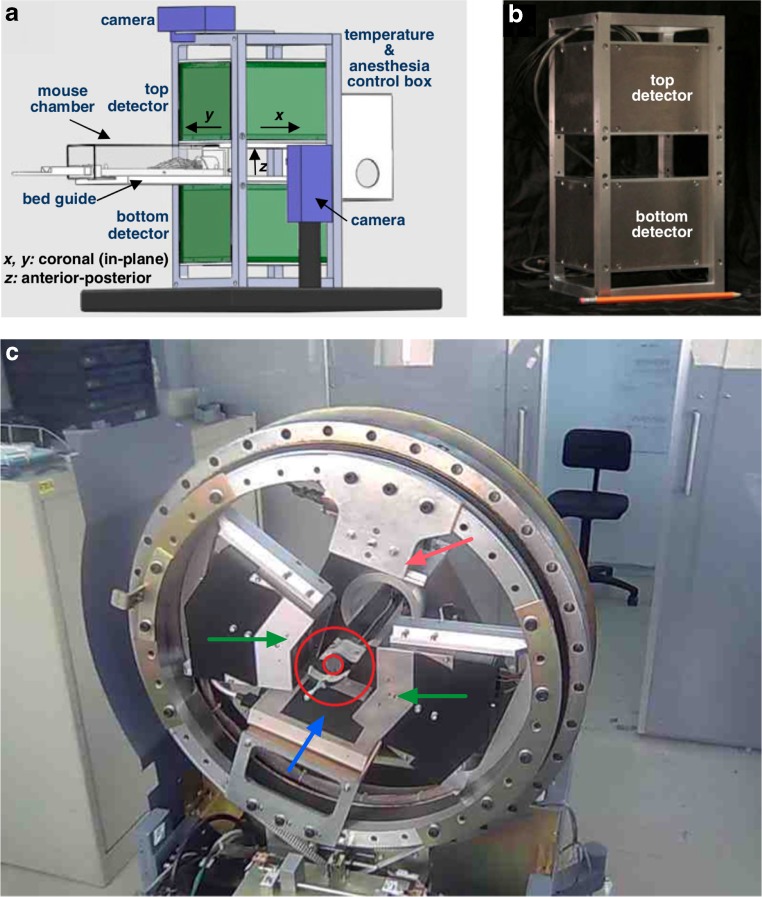
Over the last decade, small-animal PET imaging has become a vital platform technology in cancer research. With the development of molecularly targeted therapies and drug combinations requiring evaluation of different schedules, the number of animals to be imaged within a PET experiment has increased. This paper describes experimental design requirements to reach statistical significance, based on the expected change in tracer uptake in treated animals as compared to the control group, the number of groups that will be imaged, and the expected intra-animal variability for a given tracer. We also review how high-throughput studies can be performed in dedicated small-animal PET, high-resolution clinical PET systems and planar positron imaging systems by imaging more than one animal simultaneously. Customized beds designed to image more than one animal in large-bore small-animal PET scanners are described. Physics issues related to the presence of several rodents within the field of view (i.e. deterioration of spatial resolution and sensitivity as the radial and the axial offsets increase, respectively, as well as a larger effect of attenuation and the number of scatter events), which can be assessed by using the NEMA NU 4 image quality phantom, are detailed.


Figures

Fig. 1
Fig. 1
Diagram of the NEMA NU 4 image-quality (NEMA NU 4) phantom (a, b) and illustration of the impact of radial displacement on image quality parameters. Cross-sectional diagram of NU 4-IQ phantom. Grey represents solid polymethylmethacrylate, and white represents hollow, fillable compartments (rods ranging in diameter from 1 to 5 mm, a uniform region that is filled with an 18F solution, and water- or air-filled cylinders). Views are coronal (a) and transverse through the rods (b). c, d Transaxial images of three regions of interest (%STDunif percent standard deviation in the uniform region; RC rod recovery coefficients, ; SOR water and SOR air spillover ratios in water and air) in the NU 4-IQ phantom imaged alone at the centre of the FOV (1C position, c) or together with three additional scatter/attenuation sources with a 20.3 mm radial displacement (4R position, d). Data were acquired on an Inveon SA-PET scanner and reconstructed using MAP. Larger values for SDunif, SORwater and SORair and smaller RC values for the 1mm rod can be visually noted. e Cross-sectional profiles through the nonradioactive compartments demonstrate the difference in SORwater and SORair imaging the phantom in either the 1C or 4R position. The images correspond to the central transaxial planes through the regions. c, d and e have been adapted and reprinted with permission (Siepel et al. [33])
Fig. 2
Fig. 2
High-resolution clinical PET/CT images of tumour-bearing mice imaged in a group of three. a, b Representative PET coronal slices in mice bearing subcutaneous tumours (a) or ovarian tumours (b) displaying heterogeneous 18F-FDG uptake are shown. c, d Corresponding CT coronal slices. e Linear regression between PET quantitative data (pooled data from Aide et al. [14, 23], including 33 organs and 22 tumours) and ex vivo counting shows an excellent correlation with a slope almost equal to unity. The PET data were reconstructed with an iterative algorithm that models the PSF of the PET system
Fig. 3
Fig. 3
A customized bed designed to image four mice simultaneously with radial displacement. a Animals are placed in cylinders (inner diameter 35 mm, leading to a 20-mm radial displacement) that deliver isoflurane for anaesthesia. b Fused 18F-FDG PET/CT MIP view of four mice bearing abdominal tumours that received an intraperitoneal injection of iodinated contrast medium plus an intravenous injection of Fenestra VC, a long-lasting contrast medium. c, d Representative coronal slices from contrast-enhanced CT and PET scans at the level of an abdominal tumour (arrows)
Fig. 4
Fig. 4
A customized bed designed to image four mice simultaneously with a combination of radial and axial displacement. a Animals are placed on a customized bed that delivers isoflurane for anaesthesia and is attached to the manufacturer’s bed. Mice are imaged with an axial displacement of 40.1 mm and a radial displacement of 22.5 mm. b Coronal 18F-FLT PET image of four mice bearing subcutaneous tumours (arrows)
Fig. 5
Fig. 5
Imaging of multiple mice with a positron emitter other than 18F. Four mice with implanted A247 tumours (small axis ranging from 4.6 mm to 12 mm) transfected to overexpress SSTR subclass 2 receptors (cells courtesy of Buck Rogers, Washington University, MI) were imaged 24 h apart on a Mosaic SA-PET system 1.5 h after injection of 18F-FDG (mean activity per mouse 8 ± 0.1 MBq) and 68Ga-DOTATATE (mean activity per mouse 13.2 ± 0.2 MBq). The animals were scanned with a combination of radial (18 mm) and axial (57 mm) displacement. a MIP views for 18F-FDG. b Given the lack of anatomical landmarks on 68Ga-DOTATATE SA-PET images, mice were scanned on a clinical CT scanner and surface images extracted from the CT images. c Fused SA-PET/CT MIP 68Ga-DOTATATE images (SA-PET images are courtesy of David Binns and Carleen Cullinane, Peter MacCallum Cancer Centre, Melbourne, Australia)
Fig. 6
Fig. 6
Planar and V-shaped positron imaging systems. a, b PETbox system [44]: schematic illustration in a bench top configuration (a) and photograph of the gantry with the two detector heads assembled (b). The two detectors are placed facing each other at a spacing of 5 cm and are kept stationary during the scan, forming a dual-head geometry optimized for imaging mice. c VrPET/CT system [45], a multimodality scanner with coplanar geometry. The PET component consists of four detectors arranged in two V-shaped blocks, and the PET and CT components are assembled on a rotating gantry in such a way that there is no axial displacement between the geometric centres of the two modalities. The small red circle indicates a NEMA mouse-sized (25 mm diameter) cylinder and the larger red circle indicates the transaxial FOV of the scanner (86.6 mm) that is suitable for imaging multiple mice. Also visible are the flat panel x-ray detector (blue arrow), the x-ray tube (red arrow) and the V-shaped PET detectors (green arrows). a and b reprinted with permission from Zhang et al. [44] and c courtesy of Dr. Eduardo Lage, Hospital General Universitario Gregorio Maranon, Madrid, Spain
Fig. 7
Fig. 7
Technological improvements that could benefit high-throughput PET imaging. a A tumour-bearing mouse imaged in a group of four animals in the customized bed shown in Fig. 3. Animals received intravenous and intraperitoneal injections of iodinated contrast medium. Images were reconstructed with FBP and MAP reconstruction, an algorithm that models the PSF of the system. Images are scaled to the same maximum. Note the artefacts near the bladder on the FBP images, which hamper the detection of a necrotic tumour also located near the bladder. These artefacts are not present on the MAP images. b Mice imaged using 61Cu-PTSM. Relative to that obtained with FBP, improved image resolution was achieved by the use of MAP reconstruction with PSF and positron range modelling (MAPR). With MAPR, the renal cortex can be resolved clearly in the kidney. b reprinted with permission of the Society of Nuclear Medicine from de Kemp et al. [19]

Similar articles

Cited by

References

    1. Adjei AA. What is the right dose? The elusive optimal biologic dose in phase I clinical trials. J Clin Oncol. 2006;24:4054–4055. doi: 10.1200/JCO.2006.07.4658. - DOI - PubMed
    1. Le Tourneau C, Lee JJ, Siu LL. Dose escalation methods in phase I cancer clinical trials. J Natl Cancer Inst. 2009;101:708–720. doi: 10.1093/jnci/djp079. - DOI - PMC - PubMed
    1. Rojo F, Dalmases A, Corominas JM, Albanell J. Pharmacodynamics: biological activity of targeted therapies in clinical trials. Clin Transl Oncol. 2007;9:634–644. doi: 10.1007/s12094-007-0116-2. - DOI - PubMed
    1. Fuereder T, Wanek T, Pflegerl P, Jaeger-Lansky A, Hoeflmayer D, Strommer S, et al. Gastric cancer growth control by BEZ235 in vivo does not correlate with PI3K/mTOR target inhibition but with [18F]FLT uptake. Clin Cancer Res. 2011;17:5322–5332. doi: 10.1158/1078-0432.CCR-10-1659. - DOI - PubMed
    1. Willmann JK, van Bruggen N, Dinkelborg LM, Gambhir SS. Molecular imaging in drug development. Nat Rev Drug Discov. 2008;7:591–607. doi: 10.1038/nrd2290. - DOI - PubMed

Publication types

MeSH terms