Comparative Study
. 2012 Oct;13(5):715-31.
doi: 10.1007/s10162-012-0340-5. Epub 2012 Jul 12.

Neuromagnetic indicators of tinnitus and tinnitus masking in patients with and without hearing loss

Affiliations
Comparative Study

Neuromagnetic indicators of tinnitus and tinnitus masking in patients with and without hearing loss

Peyman Adjamian et al. J Assoc Res Otolaryngol. 2012 Oct.

Abstract

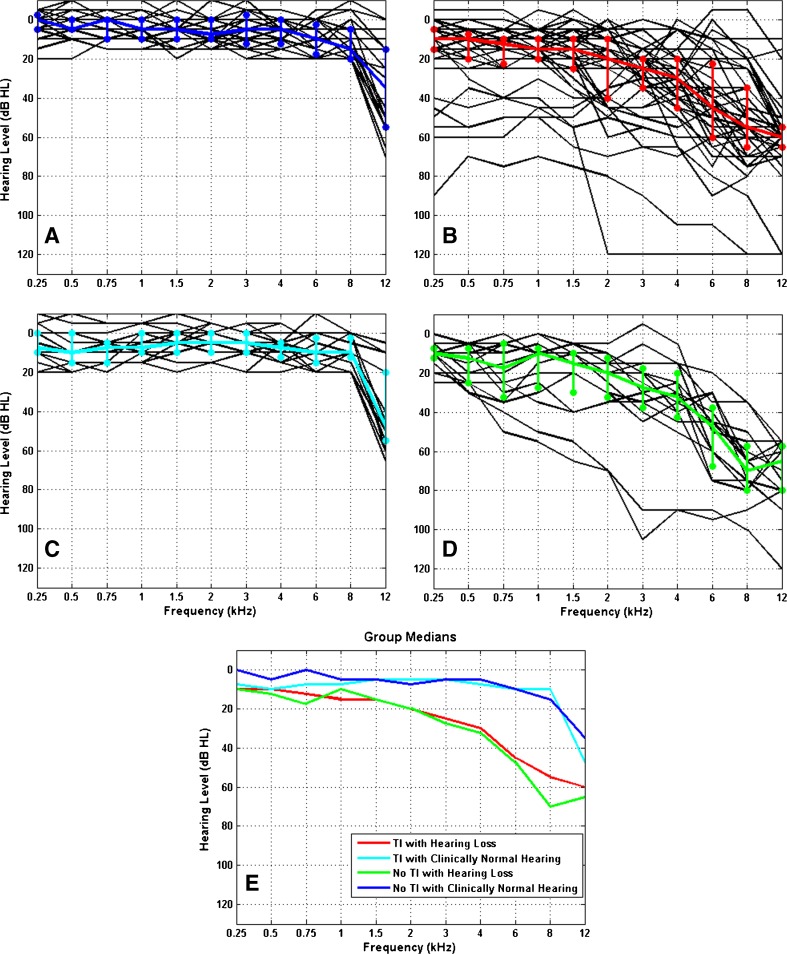
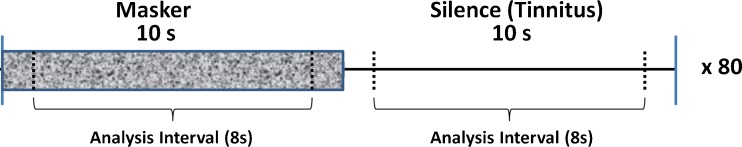
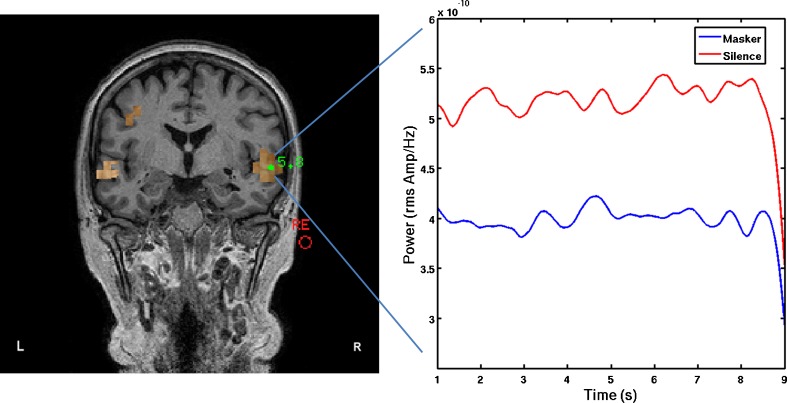
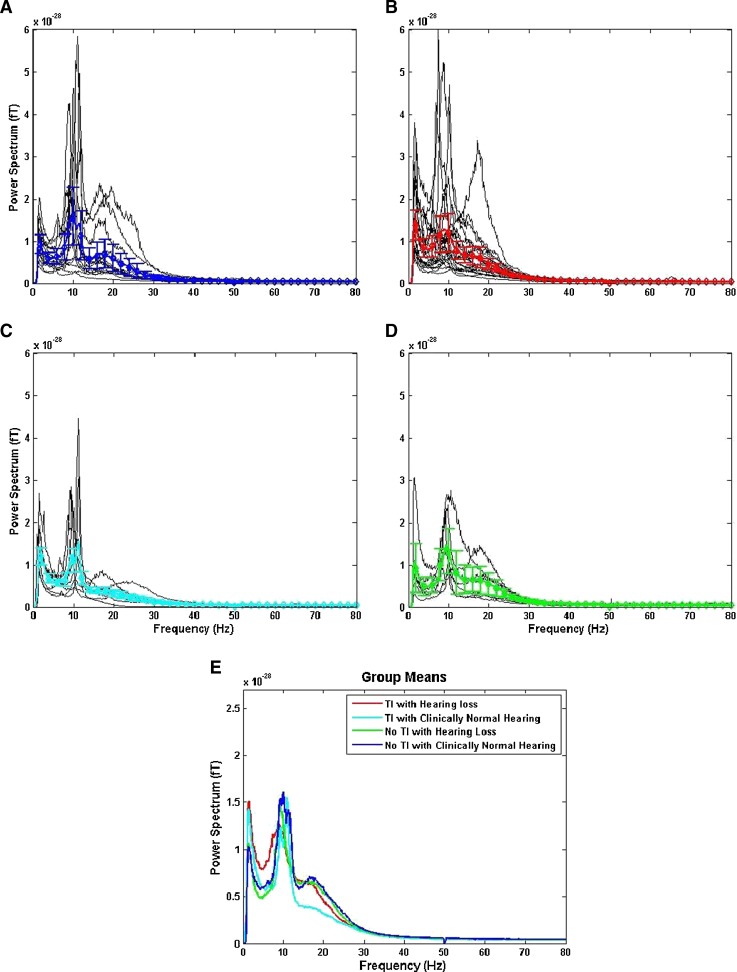
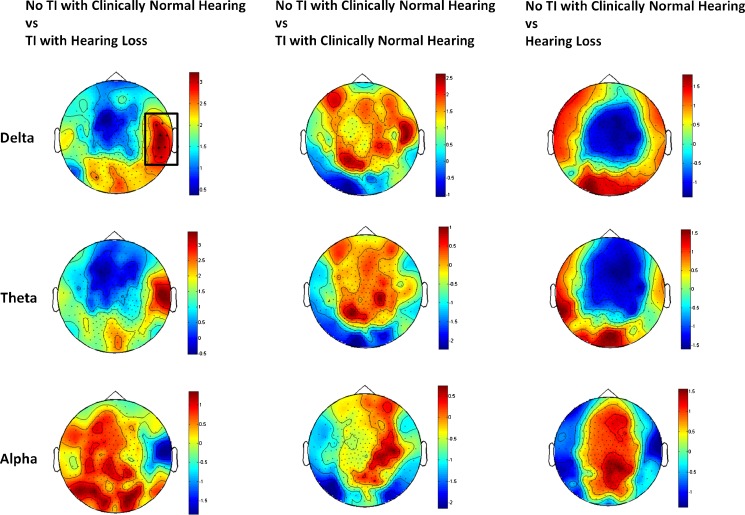
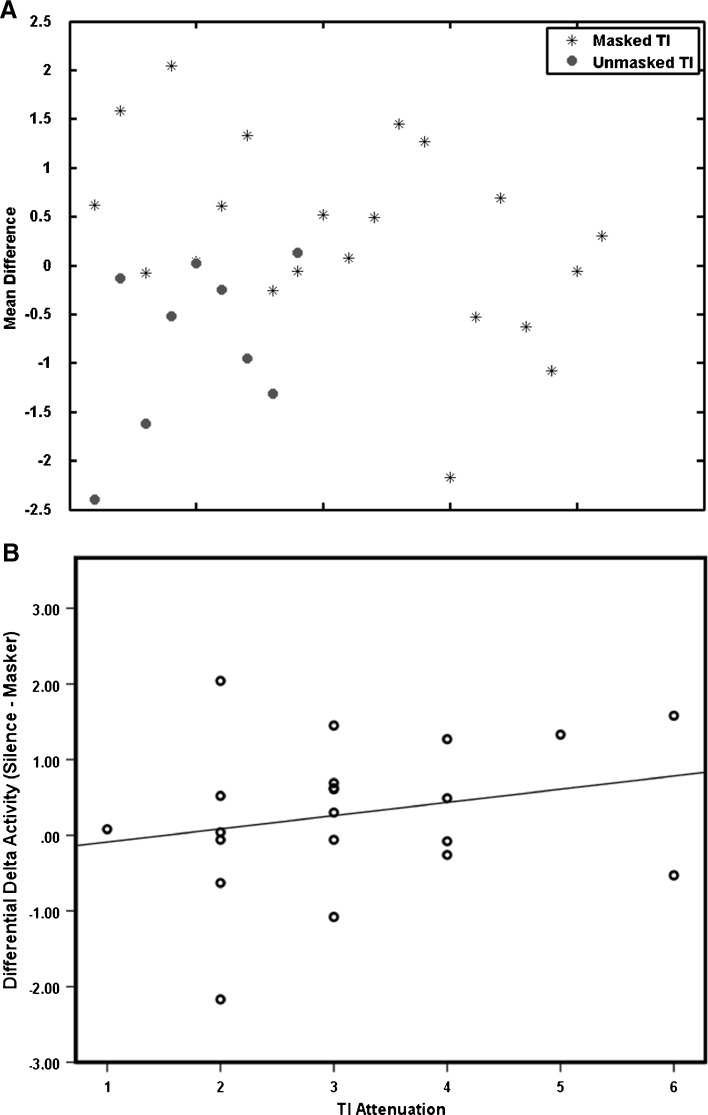
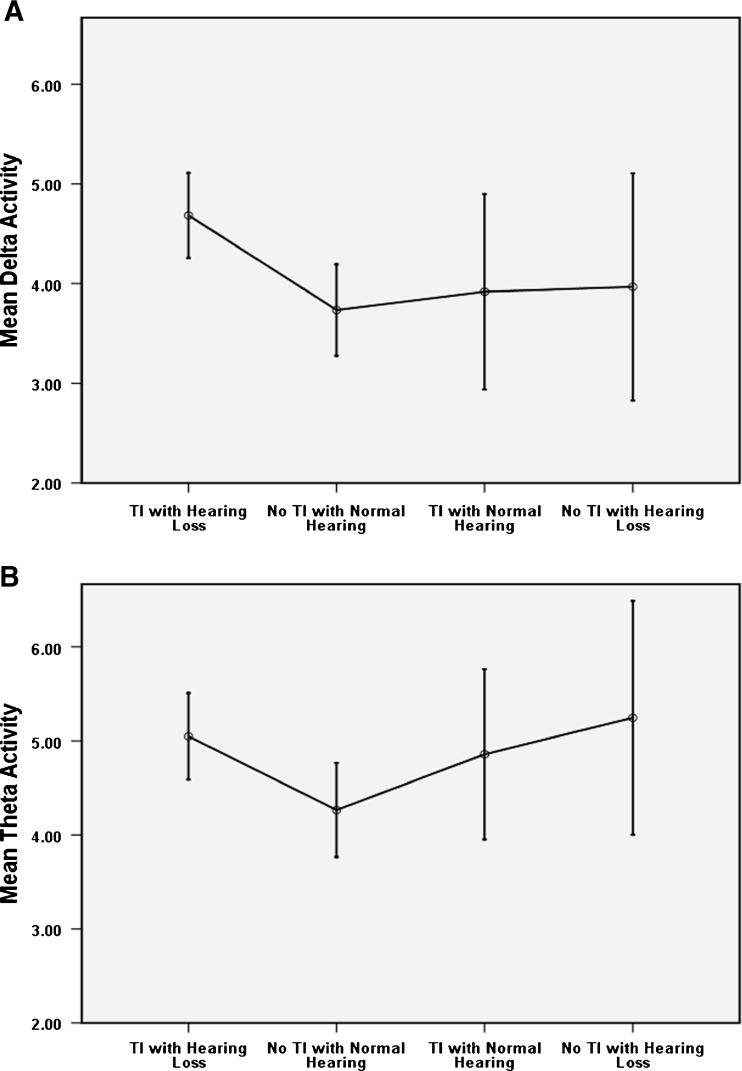
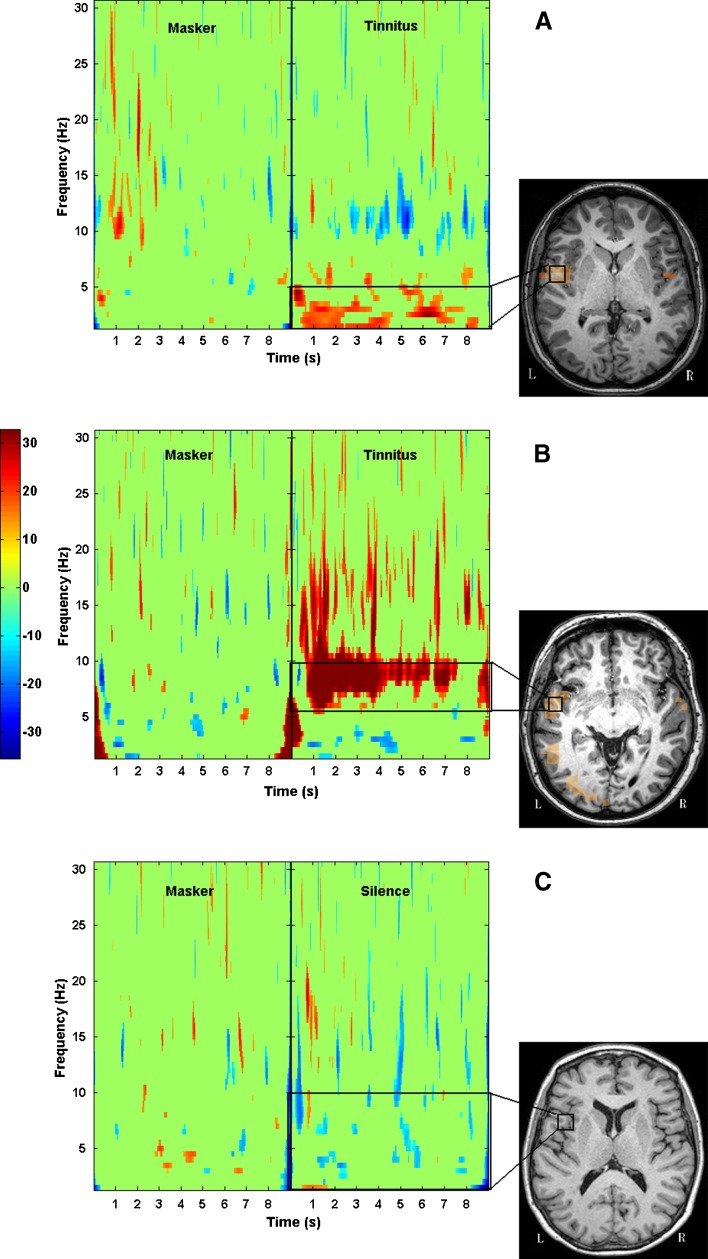
Tinnitus is an auditory phenomenon characterised by the perception of a sound in the absence of an external auditory stimulus. Chronic subjective tinnitus is almost certainly maintained via central mechanisms, and this is consistent with observed measures of altered spontaneous brain activity. A number of putative central auditory mechanisms for tinnitus have been proposed. The influential thalamocortical dysrhythmia model suggests that tinnitus can be attributed to the disruption of coherent oscillatory activity between thalamus and cortex following hearing loss. However, the extent to which this disruption specifically contributes to tinnitus or is simply a consequence of the hearing loss is unclear because the necessary matched controls have not been tested. Here, we rigorously test several predictions made by this model in four groups of participants (tinnitus with hearing loss, tinnitus with clinically normal hearing, no tinnitus with hearing loss and no tinnitus with clinically normal hearing). Magnetoencephalography was used to measure oscillatory brain activity within different frequency bands in a 'resting' state and during presentation of a masking noise. Results revealed that low-frequency activity in the delta band (1-4 Hz) was significantly higher in the 'tinnitus with hearing loss' group compared to the 'no tinnitus with normal hearing' group. A planned comparison indicated that this effect was unlikely to be driven by the hearing loss alone, but could possibly be a consequence of tinnitus and hearing loss. A further interpretative linkage to tinnitus was given by the result that the delta activity tended to reduce when tinnitus was masked. High-frequency activity in the gamma band (25-80 Hz) was not correlated with tinnitus (or hearing loss). The findings partly support the thalamocortical dysrhythmia model and suggest that slow-wave (delta band) activity may be a more reliable correlate of tinnitus than high-frequency activity.


Figures

FIG. 1
FIG. 1
Individual (black lines) and median (coloured lines) audiograms for all ears in each group (A–D): no TI with clinically normal hearing (blue, n = 28), TI with hearing loss (red, n = 44), TI with clinically normal hearing (cyan, n = 16), no TI with hearing loss (green, n = 12). The variability across participants in each group is indicated using the 25 and 75 % interquartile ranges. E Superposition of the medians from A–D. Note the close matching for the groups with and without hearing loss.
FIG. 2
FIG. 2
The sequence of MEG data acquisition: each trial of 20 s consisted of 10 s of the masker sound followed by 10 s of silence in which participants with TI were able to hear their TI. Eighty repetitions of the trial were presented.
FIG. 3
FIG. 3
A Beamformer pseudo-Z image of auditory cortical activation in the delta (1–4 Hz) band during the silence condition for one participant (TI with hearing loss). B For the right hemisphere peak voxel depicted in A, the time course of the normalized power in the delta band (1–4 Hz) is plotted across the masking and silence epochs.
FIG. 4
FIG. 4
Multi-taper power spectra (A–D): individual (black) and mean spectra (±SEM) for no TI with clinically normal hearing (blue, n = 14), TI with hearing loss (red, n = 22), TI with clinically normal hearing (cyan, n = 8) and no TI with hearing loss (green, n = 6). E Superposition of means from A–D. Note that no differences exist between individuals or groups at higher frequencies.
FIG. 5
FIG. 5
Representation of spatio-spectral differences between groups. The plot shows t-statistical differences at the sensor level for group of participants for the delta, theta and alpha bands. The statistical test performed is a permutation test, using the Bonferroni correction (alpha = 0.001). The colour bar indicates the t-statistic. The only differences was between TI with hearing loss and the no TI with clinically normal hearing groups in the delta band for channels above the right auditory cortex.
FIG. 6
FIG. 6
Estimates of TI masking: A mean difference between masker and silence in the delta band for participants who experienced TI reduction through masking (blue; N = 21) and those who did not (red; N = 9); B correlation between amount of reduction in delta with TI reduction through masking and the level of TI attenuation as reported by each individual.
FIG. 7
FIG. 7
The means (95 % interval) of groups for the delta (A) and theta (B) activity showing overall enhancement for ‘TI with hearing loss’ compared to the ‘no TI with normal hearing’ group.
FIG. 8
FIG. 8
Sample wavelet time–frequency spectrogram from two participants with TI and hearing loss who experienced reduction of their TI with masking, and a participant with no TI and clinically normal hearing. Peak locations were identified in the delta (A) and theta (B) bands using beamformer in the silence period when TI was present. The virtual electrode time-series corresponding to these locations were extracted for time-frequency analysis using a bootstrap technique. Power fluctuations in the tinnitus epochs are calculated relative to the masker epochs, which are treated as baseline, with values averaged to zero. A Enhanced delta activity appearing with the onset of TI percept. B Onset of theta activity following the masker in another TI patient. Similarly, C shows the same analysis in a participant with no TI and clinically normal hearing. The virtual electrode was calculated in the delta band (1–5 Hz) in this case showing no significant increase/decrease in power for the silent period.

Similar articles

Cited by

References

    1. Adjamian P, Barnes GR, Hillebrand A, Holliday IE, Singh KD, Furlong PL, Harrington E, Barclay CW, Route PJ. Co-registration of magnetoencephalography with magnetic resonance imaging using bite-bar-based fiducials and surface-matching. Clin Neurophysiol. 2004;115:691–698. doi: 10.1016/j.clinph.2003.10.023. - DOI - PubMed
    1. Adjamian P, Holliday IE, Barnes GR, Hillebrand A, Hadjipapas A, Singh KD. Induced visual illusions and gamma oscillations in human primary visual cortex. Eur J Neurosci. 2004;20:587–592. doi: 10.1111/j.1460-9568.2004.03495.x. - DOI - PubMed
    1. Adjamian P, Hadjipapas A, Barnes GR, Hillebrand A, Holliday IE. Induced Gamma activity in primary visual cortex is related to luminance and not color contrast: An MEG study. J Vis. 2008;8(4):1–7. doi: 10.1167/8.4.1. - DOI - PubMed
    1. Adjamian P, Sereda M, Hall DA. The mechanisms of tinnitus: perspectives from human functional neuroimaging. Hear Res. 2009;253:15–31. doi: 10.1016/j.heares.2009.04.001. - DOI - PubMed
    1. Ashton H, Reid K, Marsh R, Johnson I, Alter K, Griffiths T. High frequency localised “hot spots” in temporal lobes of patients with intractable tinnitus: a quantitative electroencephalographic (QEEG) study. Neurosci Lett. 2007;426:23–28. doi: 10.1016/j.neulet.2007.08.034. - DOI - PubMed

Publication types

MeSH terms