. 2012 Sep;160(1):433-49.
doi: 10.1104/pp.112.202614. Epub 2012 Jul 12.

Characterization of SOC1's central role in flowering by the identification of its upstream and downstream regulators

Affiliations

Characterization of SOC1's central role in flowering by the identification of its upstream and downstream regulators

Richard G H Immink et al. Plant Physiol. 2012 Sep.

Erratum in

  • Plant Physiol. 2013 Aug;162(4):2151

Abstract

The transition from vegetative to reproductive development is one of the most important phase changes in the plant life cycle. This step is controlled by various environmental signals that are integrated at the molecular level by so-called floral integrators. One such floral integrator in Arabidopsis (Arabidopsis thaliana) is the MADS domain transcription factor SUPPRESSOR OF OVEREXPRESSION OF CONSTANS1 (SOC1). Despite extensive genetic studies, little is known about the transcriptional control of SOC1, and we are just starting to explore the network of genes under the direct control of SOC1 transcription factor complexes. Here, we show that several MADS domain proteins, including SOC1 heterodimers, are able to bind SOC1 regulatory sequences. Genome-wide target gene analysis by ChIP-seq confirmed the binding of SOC1 to its own locus and shows that it also binds to a plethora of flowering-time regulatory and floral homeotic genes. In turn, the encoded floral homeotic MADS domain proteins appear to bind SOC1 regulatory sequences. Subsequent in planta analyses revealed SOC1 repression by several floral homeotic MADS domain proteins, and we show that, mechanistically, this depends on the presence of the SOC1 protein. Together, our data show that SOC1 constitutes a major hub in the regulatory networks underlying floral timing and flower development and that these networks are composed of many positive and negative autoregulatory and feedback loops. The latter seems to be crucial for the generation of a robust flower-inducing signal, followed shortly after by repression of the SOC1 floral integrator.


Figures
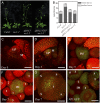
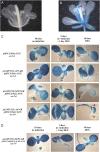
Figure 1.
Figure 1.
Analysis of gSOC1:GFP lines. A, Col-0, soc1-2, gSOC1;soc1-2, and gSOC1:GFP;soc1-2 30-d-old plants grown in LD conditions at 23°C. B, gSOC1;soc1-2 and gSOC1:GFP lines show complementation of the soc1-2 late-flowering phenotype. Error bars indicate 2× se of the total leaf number. C to G, Analysis of SOC1 expression at the switch from vegetative to reproductive development in gSOC1:GFP transgenic plants. gSOC1:GFP signal is shown in green and pTUB6:TagRFP signal is shown in red. C shows SOC1 localization in the shoot meristem region of a representative 3-week-old plant grown under SD conditions and in the vegetative state of development. Subsequently, the plants were switched to LD conditions and SOC1 signal was imaged after 3 d (D), 5 d (E), and 7 d (F). G shows SOC1 expression in a stage 3 floral bud. Some signal reappears in the center of the floral meristem. H, AP1:GFP expression in an inflorescence at a developmental stage similar to F. IM, Inflorescence meristem; LP, leaf primordium; M, shoot meristem; S, sepal. Numbers 1 to 5 indicate floral meristem stages. Bars = 50 μm in C to F and H and 25 μm in G.
Figure 2.
Figure 2.
Targets of SOC1 identified by ChIP-seq. A to H, Examples of flowering-time and flower development loci directly bound by SOC1. The graphs in each panel show the local enrichment of SOC1 binding in gSOC1:GFP;soc1-2 (top graph) over the control experiment (gSOC1;soc1-2; bottom graph). Chromosomal position (TAIR 10) and models of the genes flanking the peaks are given at the top of the panels. Each panel shows a 10-kb window centered around the flanking genes. I, CArG box motif overrepresented in the 100 top-ranking peaks. [See online article for color version of this figure.]
Figure 3.
Figure 3.
Genomic structure and regulation of the SOC1 locus. A, Schematic representation of the Arabidopsis SOC1 promoter region and 5′ UTR. The numbering is relative to the first position of the 5′ UTR sequence (position 0). The 5′ UTR is indicated in blue, and the upstream promoter region is indicated in green. The positions of seven putative CArG box sequences are indicated. The three fragments that have been used for the yeast one-hybrid assays (pARC1046, pARC1047, and CZN2030) are presented below the schematic representation of the SOC1 upstream region. B, Likelihood ratios under a fast- versus slow-mutation regime for the Arabidopsis SOC1 upstream genomic region. The x axis represents the position in the sequence, and the y axis represents the log-likelihood ratio at that position. A relative lower ratio indicates a higher degree of constraint on the mutability of that position. The numbers in red represent perfect matches with the CArG box (CC[W]6GG) and CArG box-like (C[W]7GG, CC[W]7G, and C[W]6G) consensus sequences, located in slow-mutated regions that overlap with AP1, SEP3, or SOC1ChIP-seq binding regions. C, Chip-seq scores (peaks) for AP1, SEP3 (Kaufmann et al., 2009, 2010b), and SOC1 are shown by the lines in gray, blue, and black, respectively.
Figure 4.
Figure 4.
Binding of SOC1 regulatory sequences by particular MADS domain protein dimers. The drawing at the top represents the SOC1 upstream sequence (promoter and 5′ UTR). Below that, the three fragments are indicated that were used in the yeast one-hybrid assay (pARC1046, pARC1047, and CZN2030). Only dimers of MADS domain proteins involved in flowering-time regulation or floral organ identity specification are shown. MADS domain protein dimers binding to the indicated SOC1 regulatory sequences have been categorized according to their supposed function (flowering time, autoregulation, or control of SOC1 inside flowers mediated by AP1, SEP3, or AG). For a complete overview of SOC1 yeast one-hybrid results, see Supplemental Table S4. [See online article for color version of this figure.]
Figure 5.
Figure 5.
Repression of SOC1 expression by AP1, SEP3, and AG. Expression of the GUS reporter gene driven by the 1-kb SOC1 promoter (Hepworth et al., 2002) was analyzed separately or in combination with pCaMV35S::AP1:GR, pCaMV35S::SEP3:GR, or pCaMV35S::AG:GR constructs. The GUS assays were performed on seedlings of the respective lines after 10 d of growth on 0.5 MS, 9 d on 0.5 MS plus 1 day on 0.5 MS supplemented with DEX, or 10 d on 0.5 MS supplemented with DEX. From each treatment × plant line combination, one representative seedling is shown. Note that GUS is a stable protein and represents repression with a delay. The red arrowhead indicates the repression of SOC1 by AG in the first true leaves.
Figure 6.
Figure 6.
Role of CArG box III and dependency on SOC1 for SOC1 repression by floral MADS domain proteins. A, Expression of pSOC1(1kb)::GUS in floral organs. B, Expression of pSOC1(1kb)ΔCArG-III::GUS in floral organs. Note the ectopic expression in sepals (green arrowhead), anther filaments (yellow arrowhead), and style and stigma tissues (red arrowhead). C, Expression of the GUS reporter gene driven by the 1-kb SOC1 promoter fragment (Hepworth et al., 2002) in the soc1-6 mutant background and in soc1-6 mutant seedlings containing the pCaMV35S::AP1:GR, pCaMV35S::SEP3:GR, or pCaMV35S::AG:GR construct. The GUS assays were performed on seedlings of the respective lines after 10 d of growth on 0.5 MS, 9 d on 0.5 MS plus 1 d on 0.5 MS supplemented with DEX, or 10 d on 0.5 MS supplemented with DEX. From each treatment × plant line combination, one representative seedling is shown. D, Expression of the GUS reporter gene driven by a 1-kb SOC1 promoter fragment containing a mutation in CArG box III (see Fig. 3) in the soc1-6/pCaMV35S::SEP3:GR background. Seedlings were grown on the same media as in C.

Similar articles

Cited by

References

    1. Adamczyk BJ, Lehti-Shiu MD, Fernandez DE. (2007) The MADS domain factors AGL15 and AGL18 act redundantly as repressors of the floral transition in Arabidopsis. Plant J 50: 1007–1019 - PubMed
    1. Alon U. (2007) Network motifs: theory and experimental approaches. Nat Rev Genet 8: 450–461 - PubMed
    1. Alonso JM, Stepanova AN, Leisse TJ, Kim CJ, Chen HM, Shinn P, Stevenson DK, Zimmerman J, Barajas P, Cheuk R, et al. (2003) Genome-wide insertional mutagenesis of Arabidopsis thaliana. Science 301: 653–657 - PubMed
    1. Aukerman MJ, Sakai H. (2003) Regulation of flowering time and floral organ identity by a microRNA and its APETALA2-like target genes. Plant Cell 15: 2730–2741 - PMC - PubMed
    1. Benlloch R, Kim MC, Sayou C, Thevenon E, Parcy F, Nilsson O. (2011) Integrating long-day flowering signals: a LEAFY binding site is essential for proper photoperiodic activation of APETALA1. Plant J 67: 1094–1102 - PubMed

Publication types

MeSH terms