. 2012 Sep 15;303(6):F800-11.
doi: 10.1152/ajprenal.00703.2011. Epub 2012 Jul 11.

Phosphatidylinositol phosphate-dependent regulation of Xenopus ENaC by MARCKS protein

Affiliations

Phosphatidylinositol phosphate-dependent regulation of Xenopus ENaC by MARCKS protein

Abdel A Alli et al. Am J Physiol Renal Physiol. .

Abstract

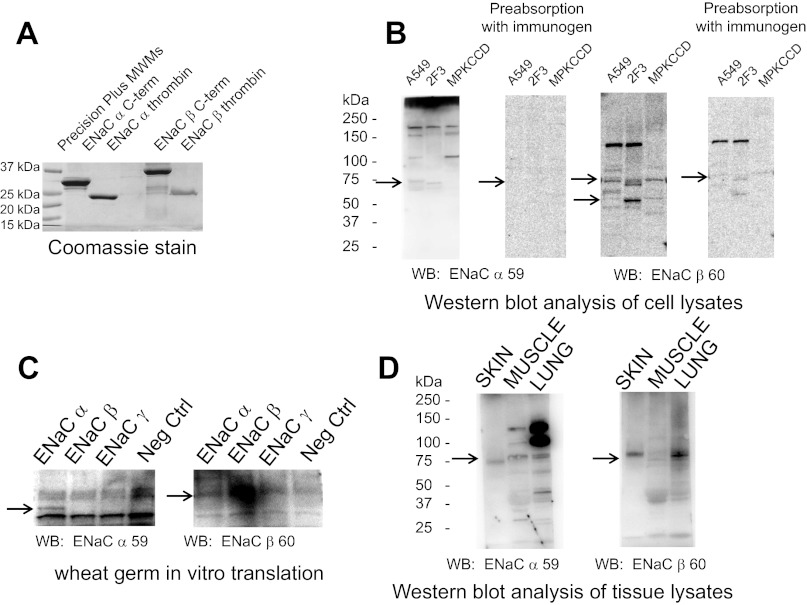
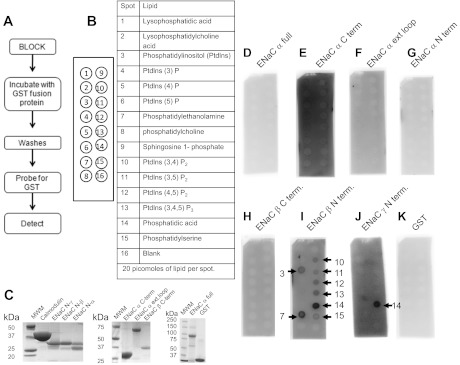
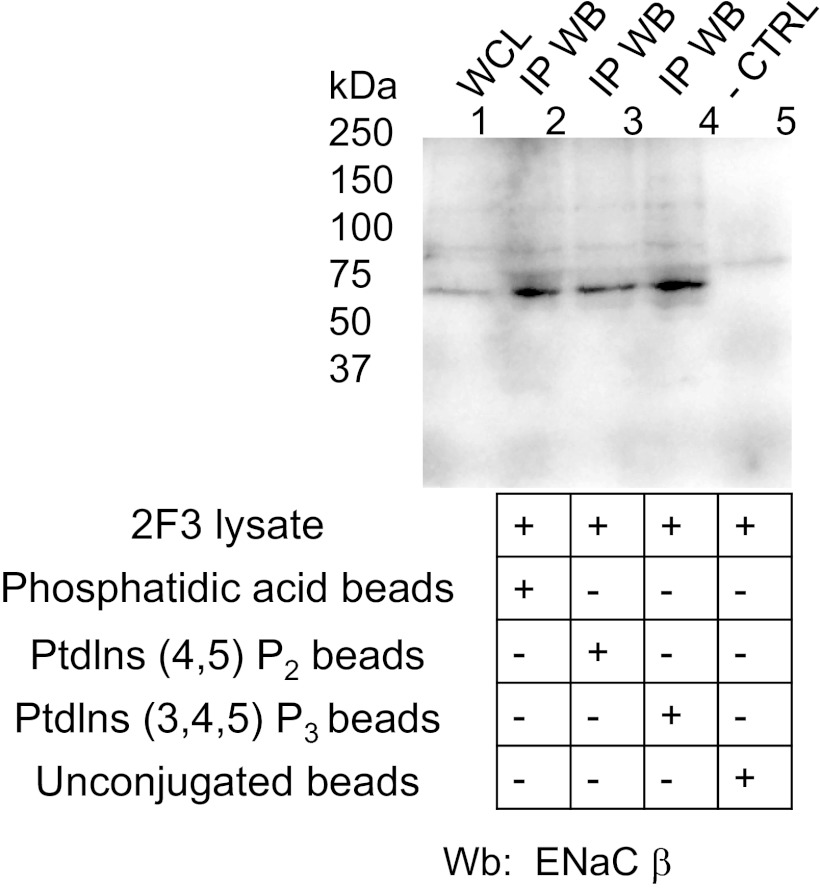
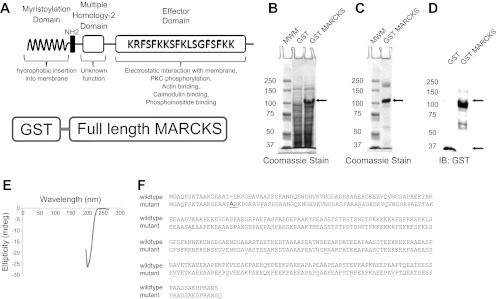
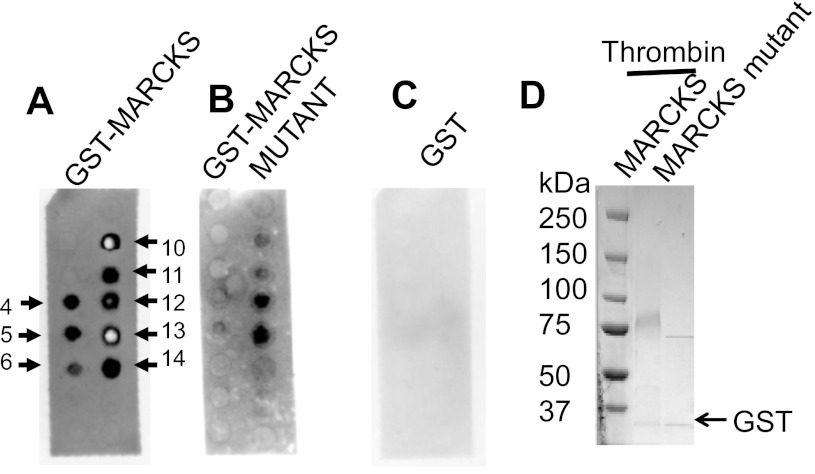
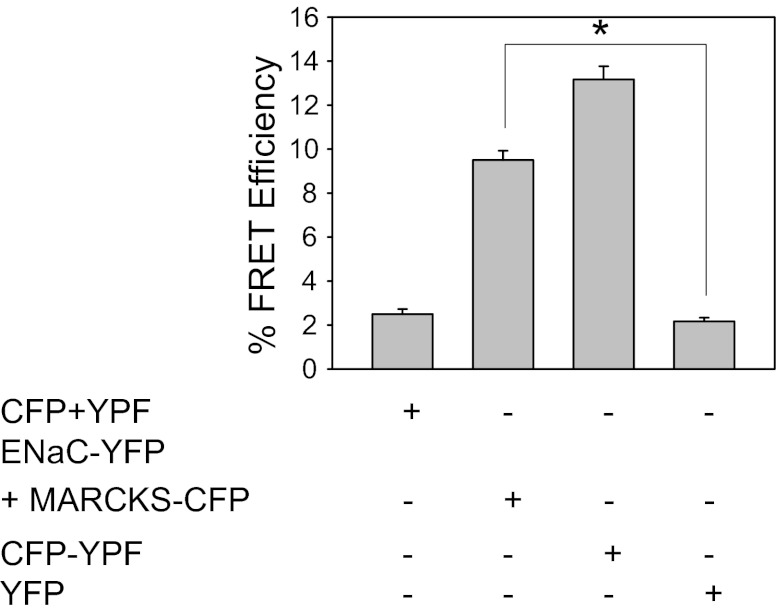
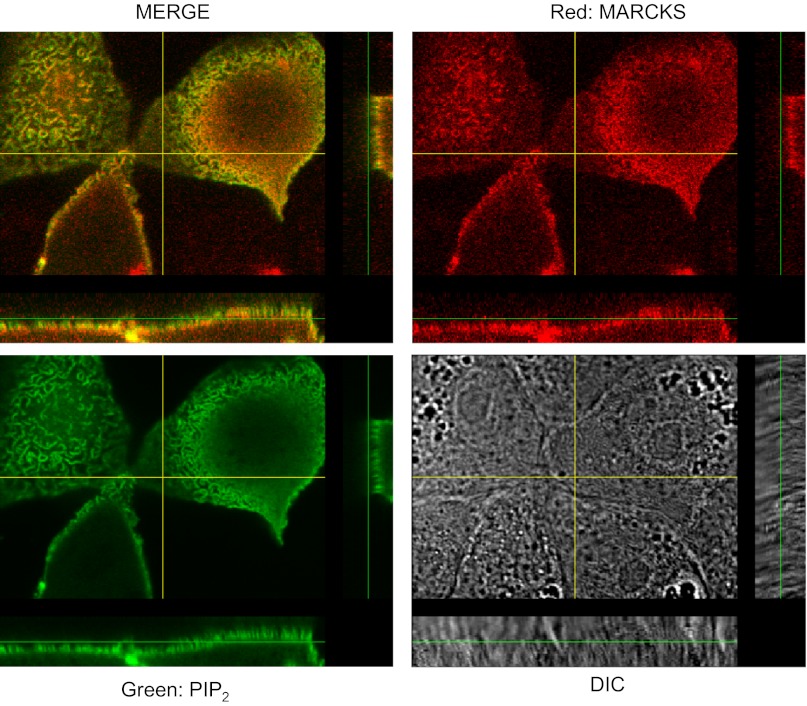
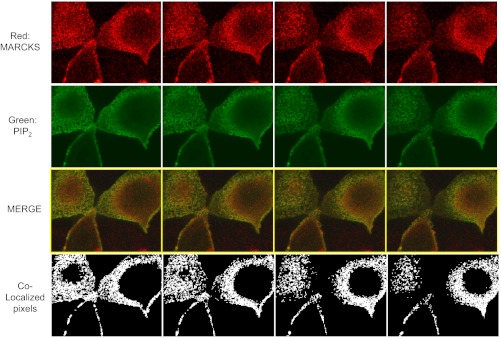
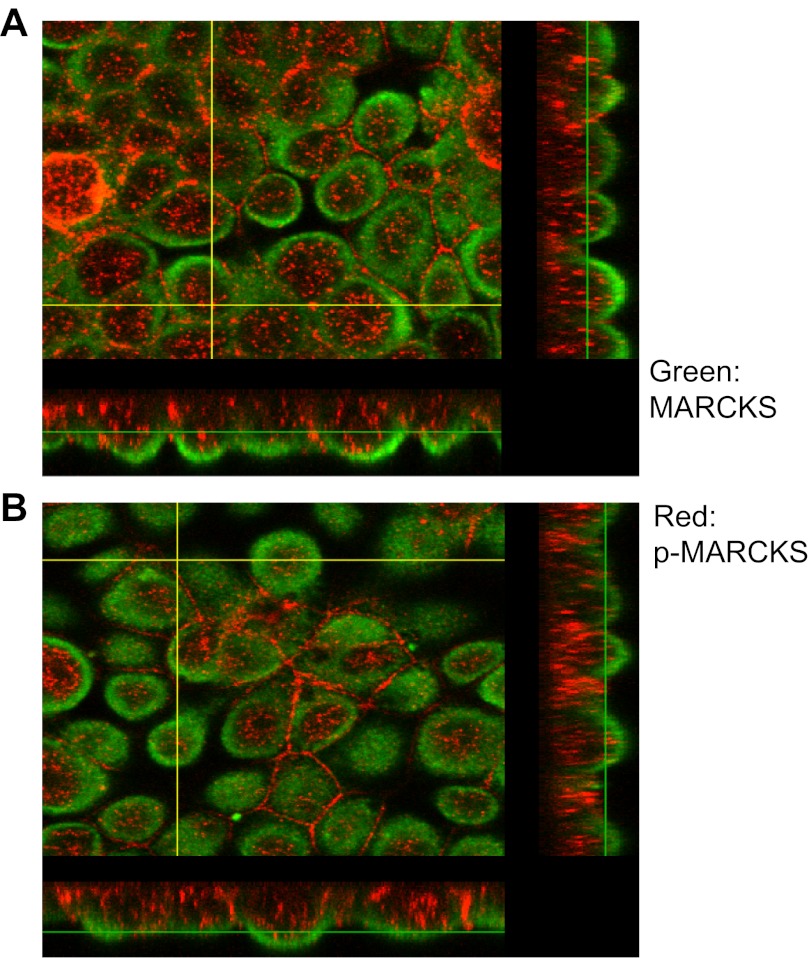
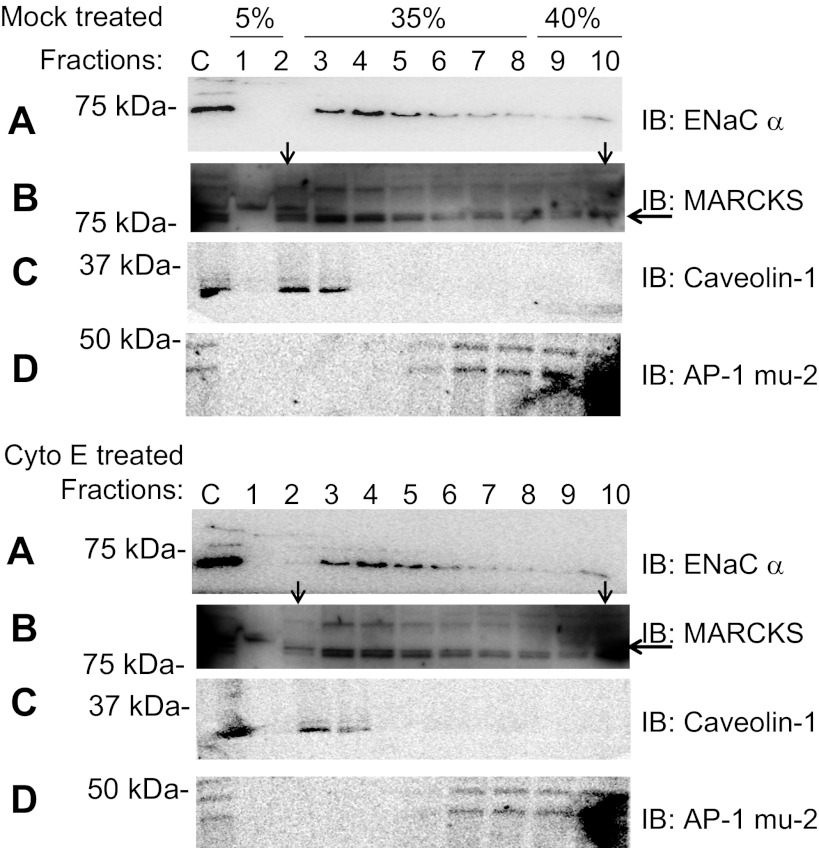
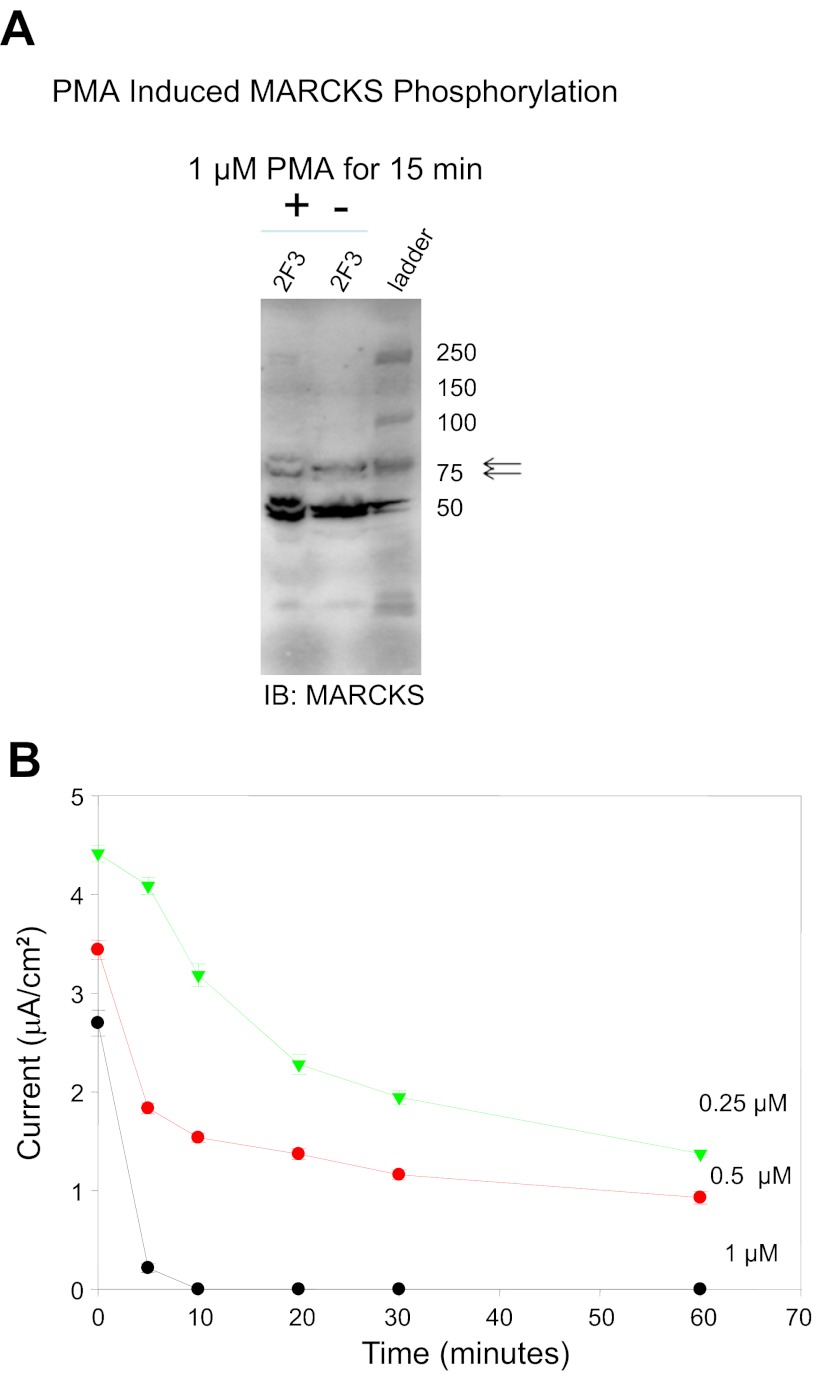
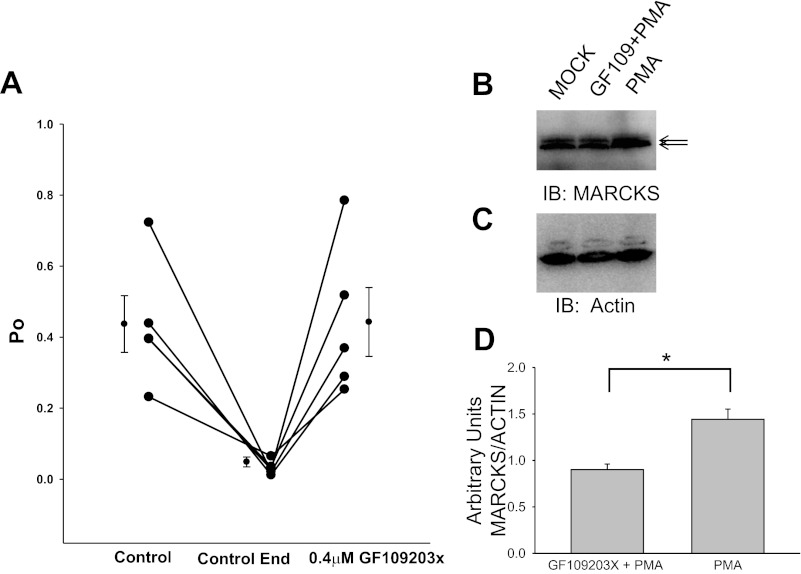
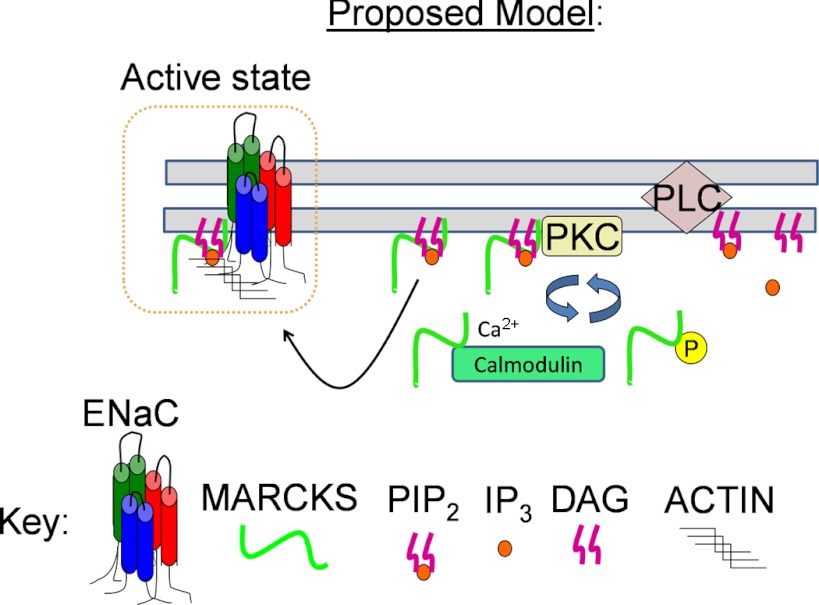
Phosphatidylinositol phosphates (PIPs) are known to regulate epithelial sodium channels (ENaC). Lipid binding assays and coimmunoprecipitation showed that the amino-terminal domain of the β- and γ-subunits of Xenopus ENaC can directly bind to phosphatidylinositol 4,5-bisphosphate (PIP(2)), phosphatidylinositol 3,4,5-trisphosphate (PIP(3)), and phosphatidic acid (PA). Similar assays demonstrated various PIPs can bind strongly to a native myristoylated alanine-rich C-kinase substrate (MARCKS), but weakly or not at all to a mutant form of MARCKS. Confocal microscopy demonstrated colocalization between MARCKS and PIP(2). Confocal microscopy also showed that MARCKS redistributes from the apical membrane to the cytoplasm after PMA-induced MARCKS phosphorylation or ionomycin-induced intracellular calcium increases. Fluorescence resonance energy transfer studies revealed ENaC and MARCKS in close proximity in 2F3 cells when PKC activity and intracellular calcium concentrations are low. Transepithelial current measurements from Xenopus 2F3 cells treated with PMA and single-channel patch-clamp studies of Xenopus 2F3 cells treated with a PKC inhibitor altered Xenopus ENaC activity, which suggest an essential role for MARCKS in the regulation of Xenopus ENaC activity.


Figures

Fig. 1.
Fig. 1.
Characterization of epithelial Na channel (ENaC) α- and β-polyclonal antibodies made from recombinant fusion proteins. A: Coomassie-stained gel showing Xenopus glutathione-S-transferase (GST)-ENaC α- and β-carboxy-terminal fusion proteins after being expressed in bacterial cells and purified over glutathione-Sepharose. The fusion proteins were used as immunogens for generating polyclonal antibodies. ENaC α-thrombin and ENaC β-thrombin refer to digestion of the recombinant fusion proteins with thrombin to remove the GST tag from the purified protein. B: Western blots showing immunoreactive bands corresponding to Xenopus ENaC α- and β-subunit proteins after protein lysates from Xenopus distal nephron 2F3 cells, human lung A549 cells, and mouse kidney collecting duct MpkCCDc14 cells were separated by SDS-PAGE and transferred onto nitrocellulose membranes. The membranes were blocked and probed for Xenopus ENaC α- and β-subunit proteins using bleeds corresponding to ENaC α- or β-antibodies. In parallel experiments, the antibodies were incubated with the immunogen before being used to probe for Xenopus ENaC α- or β-subunit proteins. C: Western blots showing immunoreactive bands corresponding to Xenopus ENaC α- or β-subunit proteins and demonstrating antibody specificity after probing of blots with ENaC α- or β-antibodies that contained Xenopus ENaC subunit proteins generated by the wheat germ system. D: Western blot analysis of blots showing immunoreactive bands corresponding to Xenopus ENaC α- and β-subunit proteins after protein lysates from various Xenopus tissues were separated by SDS-PAGE and transferred onto nitrocellulose membranes. The membranes were blocked and probed for Xenopus ENaC α- or β-subunit proteins using bleeds corresponding to ENaC α- or β-antibodies. Arrows in BD indicate specific immunoreactive bands for ENaC α- and β-antibodies that are attenuated or absent after preincubation with the immunogen used to produce each antibody.
Fig. 2.
Fig. 2.
Phosphatidylinositol phosphate (PIP) strip overlay binding assay using recombinant Xenopus GST-ENaC fusion proteins. Schematic of the general procedure (A) and format (B) of the PIP strip binding assay. C: Coomassie-stained gel showing the purity and size of each recombinant protein used. GST fusion proteins of full length Xenopus ENaC-α (D), Xenopus ENaC-α carboxy-terminal domain (E), Xenopus ENaC-α extracellular loop domain (F), Xenopus ENaC-α amino-terminal domain (G), and Xenopus ENaC-β carboxy-terminal domain (H) did not directly bind to any of the 15 different phospholipids or banks. GST fusion proteins of Xenopus ENaC-β amino-terminal domain (I) and Xenopus ENaC-γ amino-terminal domain (J) directly bound to various phospholipids, but with different affinities. GST alone did not bind with any appreciable affinity to any of the spotted phospholipids (K). The white dots present in various spots are due to burnout of the signal of the film.
Fig. 3.
Fig. 3.
Immunoprecipitated Western blot (IP WB) confirming endogenous Xenopus ENaC β-subunit associates with phosphatidic acid, phosphatidylinositol 4,5-bisphosphate (PIP2) and phosphatidylinositol 3,4,5-trisphosphate (PIP3) in 2F3 cells. Cell lysate from Xenopus 2F3 cells was incubated in the presence of beads conjugated to either phosphatidic acid, PIP2, or PIP3. The complex of conjugated beads and interacting proteins were subject to a series of washes before being eluted in sample buffer. Eluted proteins were separated by SDS-PAGE and transferred onto nitrocellulose membranes before being blocked and probed for Xenopus ENaC β-subunit using ENaC-β 60 antibody. As a control, unconjugated beads were used to determine nonspecific binding. WCL represents whole cell lysate.
Fig. 4.
Fig. 4.
Characterization of GST mutant and native myristoylated alanine-rich C-kinase substrate (MARCKS). A: schematic of the GST-MARCKS fusion protein (bottom) and the anatomy of native MARCKS protein (top). The myristoylation domain of MARCKS and the basic effector domain of MARCKS both contribute to the reversible association of MARCKS with the membrane. Binding of the basic effector domain with actin or calcium-calmodulin or posttranslational modification (phosphorylation) of the basic effector domain results in dissociation of MARCKS from the membrane. B: Coomassie-stained gel showing a predominant 100-kDa band after expression of GST-MARCKS with IPTG induction. C: Coomassie-stained gel showing purification of the 100-kDa band after batch purification over Sepharose and eluting with reduced glutathione. D: Western blot analysis of GST-MARCKS confirming a 100-kDa immunoreactive band after probing with a peroxidase-conjugated antibody against GST. E: far UV circular dichroism analysis showing GST-MARCKS is not dominated by secondary structural elements such as α-helixes and β-sheets. F: amino acid sequence alignment comparing native MARCKS with the mutant MARCKS protein.
Fig. 5.
Fig. 5.
Molecular analysis of the association between MARCKS and PIPS. Overlay binding assay showing purified GST-MARCKS (A) and a purified GST-MARCKS mutant (B) fusion protein, but not GST (C) each bind directly to various phospholipids in vitro, but with different affinities. The format for the PIP strip assays is the same as presented in Fig. 2. The sequences for the native MARCKS and mutant MARCKS constructs used to perform the PIP strip assays are given in the previous figure. The white dots present in various spots are due to burnout of the signal of the film.
Fig. 6.
Fig. 6.
Statistical analysis of Fluorescence resonance energy transfer (FRET) efficiency as determined by acceptor photobleaching in Xenopus 2F3 cells. Xenopus 2F3 cells were transfected with the indicated constructs, fixed, and mounted on microscope coverslips for imaging. FRET determination is shown for images from 6 independent cells. YFP, yellow fluorescent protein; CYF, cyan fluorescent protein. Values are means ± SE (*P < 0.05).
Fig. 7.
Fig. 7.
Localization of MARCKS and PIP2. 2F3 cells were transfected with the PIP2 reporter GFP-PLC-δ1 PH domain, fixed in paraformaldehyde, and stained with primary antibodies against MARCKS protein (host: mouse). Following treatment with a fluorescent secondary antibody, cells were examined using confocal microscopy using an Olympus Fluoview 1000 confocal microscope. The 4 panels show an X-Y optical slice near the apical membrane showing PIP2 (green), MARCKS (red), the merged image, and a differential interference white light image. Also, z-axis images are shown adjacent to the X-Y images. The overlap of red and green is best seen in the z-axis images.
Fig. 8.
Fig. 8.
Colocalization of MARCKS and PIP2. 2F3 cells were transfected with the PIP2 reporter GFP-PLC-δ1 PH domain, fixed in paraformaldehyde, and stained with primary antibodies against MARCKS protein (host: mouse). Following treatment with a fluorescent secondary antibody, cells were examined using confocal microscopy using an Olympus Fluoview 1000 confocal microscope. Sequential optical slice images at 0.25-μm intervals starting from the apical membrane were analyzed for colocalization of PIP2 (green) and MARCKS (red) pixels using a quantitative algorithm (Colocalization Finder plugin in the Image J program; see materials and methods). The top 4 slices (closest to the apical membrane) are shown in the montage. The bottom panel indicates colocalization (in white). Only the pixels that have an intensity value >20% of the maximum value for the green and 10% for the red component are used to generate the colocalized point shown in white (so only pixels with substantial green and red intensity are colocalized). The other areas of the figures represent a traditional merge of the green and red channels.
Fig. 9.
Fig. 9.
Confocal microscopy illustrating the translocation of MARCKS in response to inomycin treatment. The cellular distribution of MARCKS (green) and phosphorylated MARCKS (red) is best seen in the z-stack images constituting the apical membrane (right) and basolateral membrane (bottom). A: endogenous MARCKS is shown to be strongly expressed at the apical membranes of live Xenopus 2F3 cells. B: after treatment with ionomycin to increase intracellular calcium and promote MARCKS translocation, endogenous MARCKS is reduced in the apical membrane and increased in the cytoplasm of live Xenopus 2F3 cells treated with inomycin.
Fig. 10.
Fig. 10.
Subcellular fractionation and Western blot analysis showing the effect of cytochalasin E on Xenopus ENaC and MARCKS. Western blots of Xenopus ENaC α-subunit (A) or MARCKS (B) after treatment of the apical side of Xenopus 2F3 cells grown on permeable inserts with vehicle alone (top) or cytochalasin E (bottom). MARCKS but not Xenopus ENaC-α redistributes from low- to high-density sucrose fractions with cytochalasin E treatment. Western blots are shown of caveolin-1 (C) as a lipid raft marker or μ-2 (D) as a non-lipid raft marker after treatment of the apical side of Xenopus 2F3 cells grown on permeable inserts with mock or cytochalasin E.
Fig. 11.
Fig. 11.
Measurements of transepithelial current in Xenopus 2F3 cells treated with PMA. A: Western blot analysis showing PMA-induced phosphorylation of MARCKS after 15 min using a polyclonal antibody specific for MARCKS (arrows) and MARCKS-related protein (MRP; bottom bands). The top band of the doublet represents the phosphorylated form of MARCKS. B: transepithelial resistance and voltage were measured after application of PMA on the apical side of Xenopus 2F3 cells, and transepithelial current was calculated. PMA treatment resulted in a dose- and time-dependent decrease in transepithelial current.
Fig. 12.
Fig. 12.
Effect of the PKC inhibitor GF109203X on the open probability (Po) of Xenopus ENaC. A: a 10-min baseline recording of ENaC activity (control to control end) shows typical channel run-down. GF109203X was added to the apical bath solution, and Xenopus ENaC activity was monitored for several minutes after the control recording. The addition of 0.4 μM GF109203X resulted in the recovery of ENaC activity, as measured at the level of Po of the channels. B: representative Western blot of 3 independent experiments showing protein levels of MARCKS after Xenopus 2F3 cells were treated with vehicle (MOCK), PKC inhibitor (GF109203X) for 5 min, then PKC activator (PMA) for an additional 15 min, or PMA alone for 15 min. The top band of the doublet represents the phosphorylated form of MARCKS. C: representative Western blot corresponding to B showing total actin protein as a loading control. D: densitometric analysis of B and C showing the PMA-induced increase in phospho MARCKS protein is blocked by treatment with the PKC inhibitor GF109203X. Values are means ± SE (*P < 0.05).
Fig. 13.
Fig. 13.
Proposed model illustrating that MARCKS acts as a reversible source of PIP2 at the plasma membrane for regulating Xenopus ENaC activity. MARCKS attaches to the cytoplasmic face of the plasma membrane of a quiescent cell, i.e., low free intracellular calcium concentration ([Ca2+]i) and low PKC activity, by its N-terminal myristate and its basic effector domain. MARCKS is displaced from the membrane and resides in the cytoplasm after being phosphorylated by PKC at serine residues in the basic effector domain or upon an increase in free [Ca2+]i, as Ca/CaM binds to the basic effector domain. PIPs bind and activate Xenopus ENaC after MARCKS is displaced from the membrane. PIPs may also stabilize Xenopus ENaC to the actin cytoskeleton and lipid rafts. DAG, diacylglyceride; IP3, inositol-1,4,5-trisphosphate.

Similar articles

Cited by

References

    1. Aderem A. The MARCKS brothers: a family of protein kinase C substrates. Cell 71: 713–716, 1992 - PubMed
    1. Ali N, Macala LJ, Hayslett JP. Identification and characterization of MARCKS in Xenopus laevis. Biochem Biophys Res Commun 234: 143–146, 1997 - PubMed
    1. Allen LH, Aderem A. A role for MARCKS, the alpha isozyme of protein kinase C and myosin I in zymosan phagocytosis by macrophages. J Exp Med 182: 829–840, 1995 - PMC - PubMed
    1. Alli AA, Gower WR., Jr The C type natriuretic peptide receptor tethers AHNAK1 at the plasma membrane to potentiate arachidonic acid-induced calcium mobilization. Am J Physiol Cell Physiol 297: C1157–C1167, 2009 - PubMed
    1. Alli AA, Gower WR., Jr Molecular approaches to examine the phosphorylation state of the C type natriuretic peptide receptor. J Cell Biochem 110: 985–994, 2010 - PubMed

Publication types

MeSH terms

LinkOut - more resources