. 2012 Sep 21;287(39):32367-80.
doi: 10.1074/jbc.M112.370999. Epub 2012 Jul 12.

Protein kinase D1 mediates anchorage-dependent and -independent growth of tumor cells via the zinc finger transcription factor Snail1

Affiliations

Protein kinase D1 mediates anchorage-dependent and -independent growth of tumor cells via the zinc finger transcription factor Snail1

Tim Eiseler et al. J Biol Chem. .

Abstract

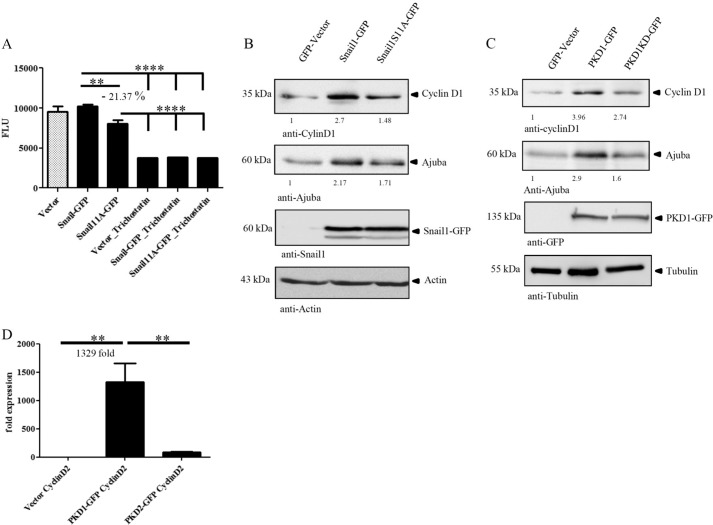
We here identify protein kinase D1 (PKD1) as a major regulator of anchorage-dependent and -independent growth of cancer cells controlled via the transcription factor Snail1. Using FRET, we demonstrate that PKD1, but not PKD2, efficiently interacts with Snail1 in nuclei. PKD1 phosphorylates Snail1 at Ser-11. There was no change in the nucleocytoplasmic distribution of Snail1 using wild type Snail1 and Ser-11 phosphosite mutants in different tumor cells. Regardless of its phosphorylation status or following co-expression of constitutively active PKD, Snail1 was predominantly localized to cell nuclei. We also identify a novel mechanism of PKD1-mediated regulation of Snail1 transcriptional activity in tumor cells. The interaction of the co-repressors histone deacetylases 1 and 2 as well as lysyl oxidase-like protein 3 with Snail1 was impaired when Snail1 was not phosphorylated at Ser-11, which led to reduced Snail1-associated histone deacetylase activity. Additionally, lysyl oxidase-like protein 3 expression was up-regulated by ectopic PKD1 expression, implying a synergistic regulation of Snail1-driven transcription. Ectopic expression of PKD1 also up-regulated proliferation markers such as Cyclin D1 and Ajuba. Accordingly, Snail1 and its phosphorylation at Ser-11 were required and sufficient to control PKD1-mediated anchorage-independent growth and anchorage-dependent proliferation of different tumor cells. In conclusion, our data show that PKD1 is crucial to support growth of tumor cells via Snail1.


Figures

FIGURE 1.
FIGURE 1.
Mapping of PKD phosphorylation sites in Snail1 in vivo. A, structural overview of Snail1. The N-terminal SNAG domain, serine-proline-rich region, destruction box, nuclear export sequence (NES), and C2H2 zinc fingers are shown. The putative PKD phosphorylation consensus motif of Snail1 Ser-11 and the consensus sequence of the phospho-PKD substrate motif antibody (pMotif) are shown below the graph. B, mapping of Snail1 phosphorylation at Ser-11 in vivo. Blots depict immunoprecipitates (IP) of FLAG-Snail1 from HeLa cells co-expressing Snail1-FLAG and Snail1S11A-FLAG constructs with active (CA) and kinase-inactive (KD) PKD1. Control blots on the right-hand side display transgene expression. Phosphorylation of Snail1 at Ser-11 was probed using pMotif antibody and reprobed with anti-FLAG M2. endogen, endogenous.
FIGURE 2.
FIGURE 2.
PKD1- and PKD2-GFP co-localize with Snail1-FLAG in nuclei of HeLa cells. Only PKD1-GFP is capable of efficiently interacting with Snail1-FLAG in nuclei, whereas interaction efficiency is significantly reduced by 3.38 times for PKD2. A, panels A′–F′, acceptor photobleach FRET experiment in HeLa cells co-expressing PKD1-GFP and Snail1-FLAG labeled with anti-FLAG M2 and Alexa Fluor 546 antibodies. Panels A′ and B′ depict donor pre- and postbleach, whereas panels D′ and E′ display acceptor pre- and postbleach states, respectively. Bleached regions of interest (ROIs) are shown in panel C′. Percent FRET values are depicted in panel F′, and FRET is represented by a thresholded seven-color look-up table (LUT). B, acceptor photobleach FRET experiment in HeLa cells co-expressing PKD2-GFP and Snail1-FLAG. Panels A′ and B′) depict donor pre- and postbleach, whereas panels D′ and E′ display acceptor pre- and postbleach states, respectively. Bleached regions of interest are shown in panel C′. Percent FRET values are depicted in panel F′. Images shown are of a single confocal section. The scale bar represents 10 μm. C, statistical analysis of acceptor photobleach FRET experiments displayed in A and B. The graph depicts mean FRET efficiency and S.E. for PKD1 (n = 18 cells) and PKD2-GFP (n = 17 cells) experiments. FRET efficiency values for all experiments are shown in supplemental Table 2. Statistical significance (****, p < 0.0001) was calculated using a two-tailed unpaired Student's t test. D, endogenous Snail1 and PKD1 interact. Anti-PKD1 and nonspecific IgGs were used for immunoprecipitation (IP) from Panc89 vector cells. Immunoprecipitations were subsequently probed for the presence of endogenous Snail1 using specific antibodies. Error bars in graphs represent S.E.
FIGURE 3.
FIGURE 3.
Phosphorylation of Ser-11 by PKD does not alter subcellular distribution of Snail1. A, Snail1-GFP (panels A′–E′), Snail1S11A-GFP (panels F′–J′), and Snail1S11E-GFP (panels K′–O′) are predominantly localized to the nucleus independently of Snail1 Ser-11 mutation status. B, co-expression of constitutively active PKD1.CA-GFP (A′) with wild type Snail1-FLAG (B′ and E′) does not alter subcellular localization of Snail1 (A′–E′). Nuclei were stained with DAPI. Images depict single confocal sections. The scale bar represents 10 μm.
FIGURE 4.
FIGURE 4.
A, Snail1, LOXL3, and PKD1 are expressed in a subset of pancreatic cancer cell lines, HeLa cells, and stable Panc89 cells expressing GFP vector as well as PKD1-GFP. 200 μg of total cell lysates were probed with specific antibodies. B, expression and upstream regulation of the Snail1 co-regulator lysyl oxidase-like proteins 2 and 3 in stable Panc89 cell lines. LOXL3, but not LOXL2, is up-regulated by ectopic PKD1. The graph displays -fold change in regulation relative to respective vector controls. qPCR for LOXL2 and LOXL3 was performed on RNA isolated from stable Panc89 cells expressing GFP and PKD1-GFP. Four independent experiments were quantified in triplicate replicas. Results were normalized to GAPDH and calculated according to the ΔΔCt method. Statistical significance was calculated using one-way ANOVA with Dunnett's multiple comparison post-testing (***, p < 0.05). C, LOXL3 expression is up-regulated in stable PKD1-GFP Panc89 cells. 250 μg of total cell lysates were probed for LOXL3 using specific antibodies. D, regulation of Snail1 activity by phosphorylation at Ser-11. Co-localization of Snail1-FLAG (panels A′–C′) and Snail1S11A-FLAG (panels D′ and E′) with their endogenous co-repressor HDAC1 in HeLa nuclei is shown. Images depict single confocal sections. The scale bar represents 10 μm. E, mutation Snail1S11A impairs interaction of Snail1 with co-expressed FLAG-HDAC2, whereas binding is reconstituted with Snail1S11E. Proteins were probed with respective specific antibodies in Western blots. F, statistical analysis of three independent co-precipitation experiments in E. -Fold change in HDAC2 co-precipitation with Snail1 and mutants was calculated from integrated band densities of Western blots. Significance was calculated using Student's t test. G, co-immunoprecipitation (IP) of endogenous HDAC1 with Snail1-, Snail1S11A-, and Snail1S11E-GFP from HeLa total cell lysates. Endogenous HDAC1 was probed with specific antibodies, and immunoprecipitations were reprobed for Snail1 expression by anti-Snail1 antibody. H, co-immunoprecipitation of endogenous HDAC2 with Snail1-, Snail1S11A-, and Snail1S11E-GFP in HeLa total cell lysates. Endogenous HDAC2 was probed with specific antibodies, and immunoprecipitations were reprobed for Snail1 expression. Error bars in graphs represent S.E.
FIGURE 5.
FIGURE 5.
Snail1-dependent histone deacetylase activity and regulation of proliferation markers. A, Snail1S11A reduces Snail1-associated HDAC activity as compared with wild type Snail1. HDAC activity was measured using a fluorometric assay kit. Crude nuclear extracts from 10 × 106 HeLa nuclei were normalized for protein expression, and HDAC activity was measured in triplicate wells per condition in 96-well plates (Tecan infinity M1000) for GFP vector, Snail1-GFP, and Snail1S11A-GFP. For Snail1-GFP and Snail1S11A-GFP, results were further normalized to GFP transgene expression levels in crude lysates. The graph depicts the combined statistical analysis of three experiments. Statistical significance was calculated using one-way ANOVA with Bonferroni multiple comparison post-testing. Expression of transgenes in HeLa crude nuclear extracts and loading controls are shown in supplemental Fig. 3C. B, Snail1S11A impairs Snail1-mediated proliferation marker protein expression in Panc1 cells. Panc1 cells were transfected with GFP, Snail1-GFP, and Snail1S11A-GFP. Cyclin D1 and Ajuba markers involved in the regulation of proliferation were probed in 60 μg of total cell lysates with specific antibodies. Transgenes were probed with anti-Snail1 antibody. Actin was used as a loading control. C, PKD1 and PKD1KD-GFP regulate proliferation marker protein levels in a pattern similar to that of phosphosite mutants. The expression levels of Cyclin D1 and Ajuba were probed with respective antibodies in 60 μg of total cell lysates of stable Panc89 cells. Transgenes were detected with anti-GFP antibody. Tubulin was used as a loading control. D, expression of the Snail target gene Cyclin D2 is prominently up-regulated by ectopic PKD1, but not PKD2 expression. The graph displays fold change in regulation relative to respective vector controls. Quantitative real-time PCR for Cyclin D2 was performed on RNA isolated from stable Panc89 cells expressing GFP, PKD1-GFP, and PKD2-GFP. Four independent experiments were quantified in triplicate replica. Results were normalized to GAPDH and calculated according to the ΔΔCT-method. Statistical significance (**, p < 0.05) was calculated using one-way Anova with Bonferroni multiple comparison post-testing. Error bars in graphs represent S.E.
FIGURE 6.
FIGURE 6.
A, PKD1, as opposed to PKD2, enhances anchorage-independent growth in soft agar experiments. We seeded 10,000 cells of stable Panc89 cell lines expressing GFP, PKD1-GFP, PKD1KD-GFP, PKD2-GFP, and PKD2KD-GFP in triplicate wells in 0.5% soft agar and documented assays after 13 days. A, the graph depicts the average number of colonies and S.E. per visual field documented at 10× magnification for five independent experiments. Statistical significance (****, p < 0.0001) was calculated using a two-tailed unpaired Student's t test. B, panels A′–E′, examples of soft agar colonies documented for quantification. The scale bar represents 100 μm. C, Snail1 expression enhances anchorage-independent growth of Panc1 cells as compared with vector control, whereas Snail1S11A reduces the number of colonies with respect to wild type Snail1. We transiently transfected 50,000 Panc1 cells and subsequently seeded cells in 0.5% soft agar in triplicate wells per assay and in three experiments. Assays were documented after 6 days. The graph depicts the average number of colonies and S.E. per well at 10× magnification. Statistical significance (****, p < 0.0001) was calculated using one-way ANOVA with Bonferroni multiple comparison post-testing. Representative transgene expression and images of colonies are shown in supplemental Fig. 4, A and B. Error bars in graphs represent S.E.
FIGURE 7.
FIGURE 7.
Snail1 is a necessary and sufficient mediator of PKD1-regulated anchorage-independent growth and proliferation in pancreatic cancer cells. Stable Panc89 cells expressing GFP vector and PKD1-GFP were transduced with lentiviruses expressing non-target shRNA (scrambled; Sigma-Aldrich), sh_Snail1 1 (NM_005985.2-136s1c1, Sigma-Aldrich), and sh_Snail1 2 (NM_005985.2-504s1c1, Sigma-Aldrich) and subjected to antibiotic selection. Then we used 10,000 cells of stable cell lines expressing the respective constructs and shRNAs and seeded cells in triplicate wells in 0.5% soft agar. Assays were documented after 10 days at 4× magnification for colony counting. A, the graph depicts the combined average number of colonies per visual field of three experiments with six images at 4× magnification per well and three replicate wells per experiment. B, exemplary images (panels A′–F′) used for quantification of colony numbers at 4× magnification. The scale bar represents 100 μm. Table 1 displays average differences (%) in colony number between conditions. Statistical significance (****, p < 0.0001) was calculated using one-way ANOVA with Bonferroni multiple comparison post-testing. C, control blots for knockdown efficacy of endogenous Snail1 with sh_Snail1 1 and 2 in stable Panc89 cells. Snail1 expression levels were probed in 60 μg of total cell lysates using anti-Snail1 antibody. Tubulin was used as a loading control. Error bars in graphs represent S.E.
FIGURE 8.
FIGURE 8.
Three-dimensional growth in BME. A, panels A′–C′, 10,000 single cells of stable Panc89 cell lines expressing GFP, PKD1-GFP, and PKD1KD-GFP were seeded in a BME gel and documented in assays after 16 days. The scale bar represents 100 μm. B, PKD1 significantly enhances clusters growth, whereas PKD1KD decreases cluster size. The average diameter of tumor cell clusters was quantified in perpendicular directions for each cluster using spacial calibration of images (for vector, n = 150; for PKD1-GFP, n = 161; and for PKD1KD-GFP, n = 181). The graph depicts average diameters and S.E. of three experiments. C, frequency distribution histograms of structure diameters for vector versus PKD1-GFP. D, frequency distribution histogram of structure diameters for vector versus PKD1KD-GFP. E, Snail1 enhances whereas S11A mutation inhibits proliferation in HeLa cells after 48 h. The combined analysis of three independent proliferation assays was performed with transiently transfected cells expressing vector, Snail1-GFP, and Snail1S11A-GFP. Cells were seeded after 24 h at a density of 5000 cells/well in triplicate replicas in 96-well plates. Cell density was quantified by measuring A550 of crystal violet-stained cells dissolved in methanol at time points T0, T24, and T48 h. The graph depicts the relative mean intensities for the respective cell lines after 24 and 48 h, respectively. Statistical significance was calculated using an unpaired Student's t test. Doubling times were calculated using linear regression (GraphPad Prism). Representative transgene expression is shown in supplemental Fig. 5. F, Panc89 GFP vector cells were transduced with lentiviruses expressing scrambled control shRNA (Sigma-Aldrich) and sh_PKD1 (NM_002742.x-2978s1c1, Sigma-Aldrich). A PKD1 knockdown was probed using a specific anti-PKD1 antibody in semistable cell lines following selection. Blots were reprobed for PKD2 expression, and Actin was used as a loading control. G, semistable Panc89 vector sh_scramble- and sh_PKD1-expressing cells were seeded at 10,000 single cells in BME gel and documented after 32 days. The scale bar represents 100 μm. H, knockdown of PKD1 significantly reduces clusters growth (diameter). The average diameter of tumor cell clusters was quantified in perpendicular directions for sh_scramble (n = 45) and sh_PKD1 (n = 84). The graph depicts average diameters and S.E. of three experiments. Numbers in the graph denote -fold change in percent. I, frequency distribution histogram for knockdown of PKD1 versus scrambled shRNA control. Knockdown of PKD1 significantly reduces cluster sizes in the BME matrix. Error bars in graphs represent S.E.
FIGURE 9.
FIGURE 9.
Overview of PKD1-mediated Snail1 regulation. PKD1 phosphorylation of Snail1 Ser-11 is necessary for efficient binding of co-repressors HDAC1 and -2 as well as LOXL3. Expression of LOXL3, acting as a functional transcriptional co-activator, is also up-regulated by PKD1, implying a positive synergistic activation of Snail1. Snail1 phosphorylation at Ser-11 by PKD1 enhances Snail1 marker protein expression involved in proliferation and anchorage-independent growth. This regulation is necessary as well as sufficient to modulate hyperproliferation in Panc89 pancreatic ductal adenocarcinoma cells and other cell lines. 2D, two-dimensional; 3D, three-dimensional.

Similar articles

Cited by

References

    1. Lint J. V., Rykx A., Vantus T., Vandenheede J. R. (2002) Getting to know protein kinase D. Int. J. Biochem. Cell Biol. 34, 577–581 - PubMed
    1. Eiseler T., Döppler H., Yan I. K., Goodison S., Storz P. (2009) Protein kinase D1 regulates matrix metalloproteinase expression and inhibits breast cancer cell invasion. Breast Cancer Res. 11, R13. - PMC - PubMed
    1. Eiseler T., Döppler H., Yan I. K., Kitatani K., Mizuno K., Storz P. (2009) Protein kinase D1 regulates cofilin-mediated F-actin reorganization and cell motility through slingshot. Nat. Cell Biol. 11, 545–556 - PMC - PubMed
    1. Eiseler T., Hausser A., De Kimpe L., Van Lint J., Pfizenmaier K. (2010) Protein kinase D controls actin polymerization and cell motility through phosphorylation of cortactin. J. Biol. Chem. 285, 18672–18683 - PMC - PubMed
    1. Eiseler T., Schmid M. A., Topbas F., Pfizenmaier K., Hausser A. (2007) PKD is recruited to sites of actin remodelling at the leading edge and negatively regulates cell migration. FEBS Lett. 581, 4279–4287 - PubMed

Publication types

MeSH terms