

Phosphatase of regenerating liver 2 (PRL2) is essential for placental development by down-regulating PTEN (Phosphatase and Tensin Homologue Deleted on Chromosome 10) and activating Akt protein
- PMID: 22791713
- PMCID: PMC3442547
- DOI: 10.1074/jbc.M112.393462
Phosphatase of regenerating liver 2 (PRL2) is essential for placental development by down-regulating PTEN (Phosphatase and Tensin Homologue Deleted on Chromosome 10) and activating Akt protein
Abstract
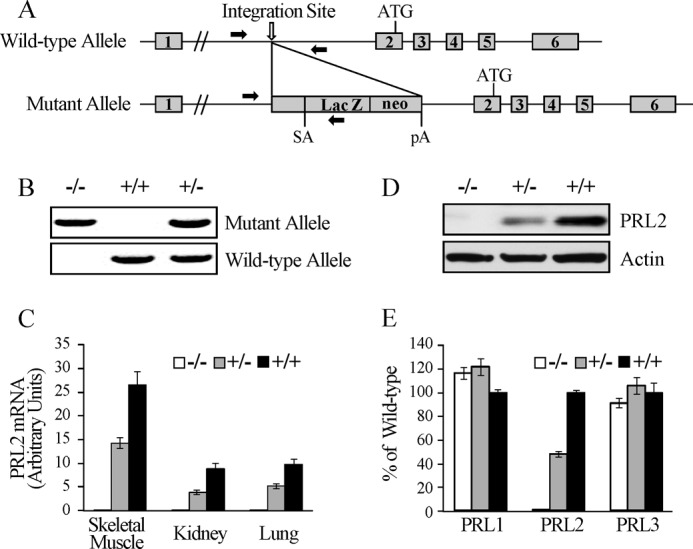
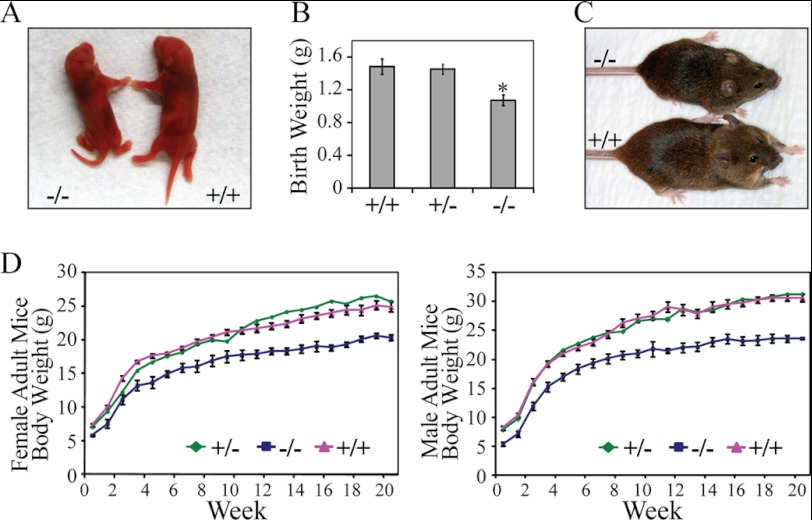
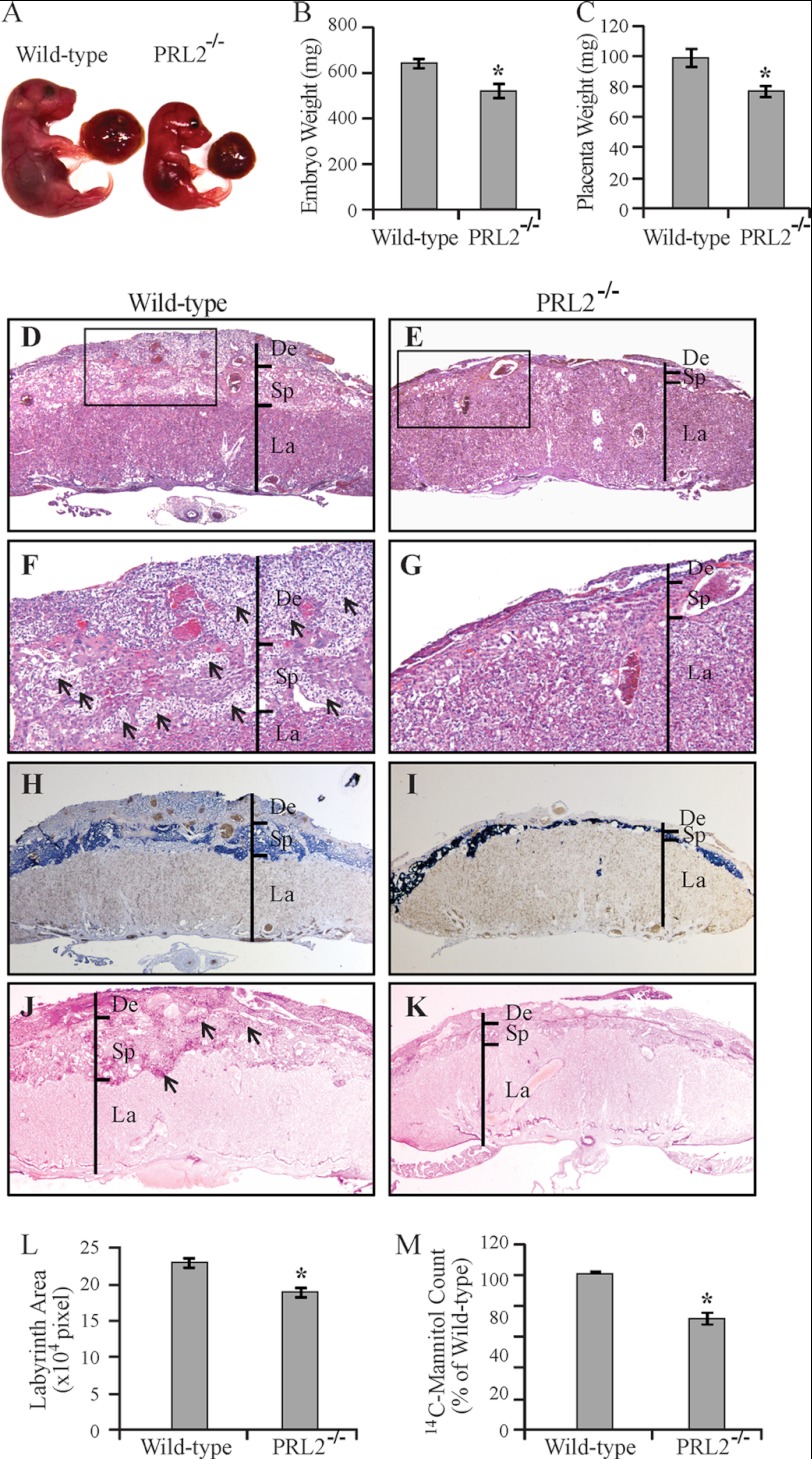
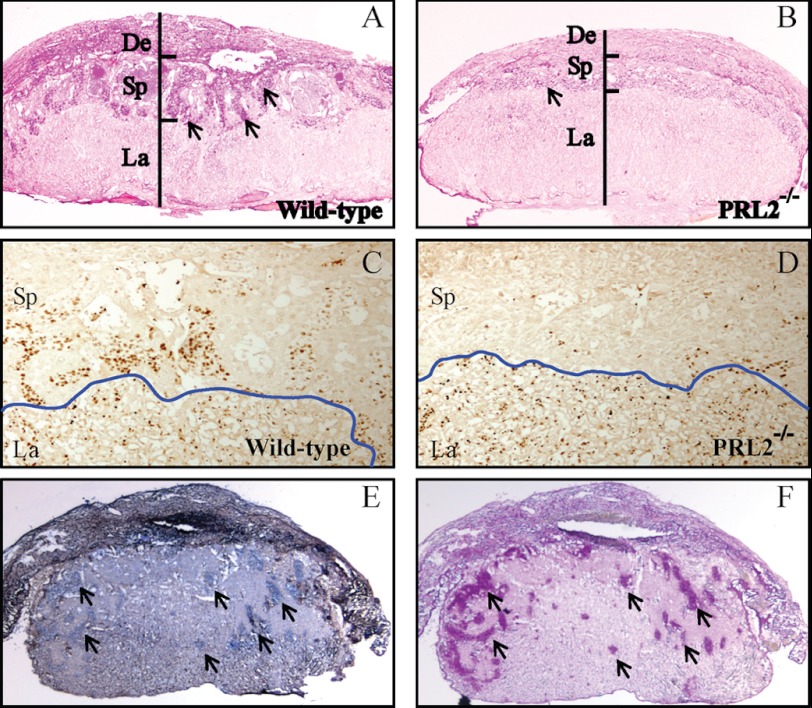
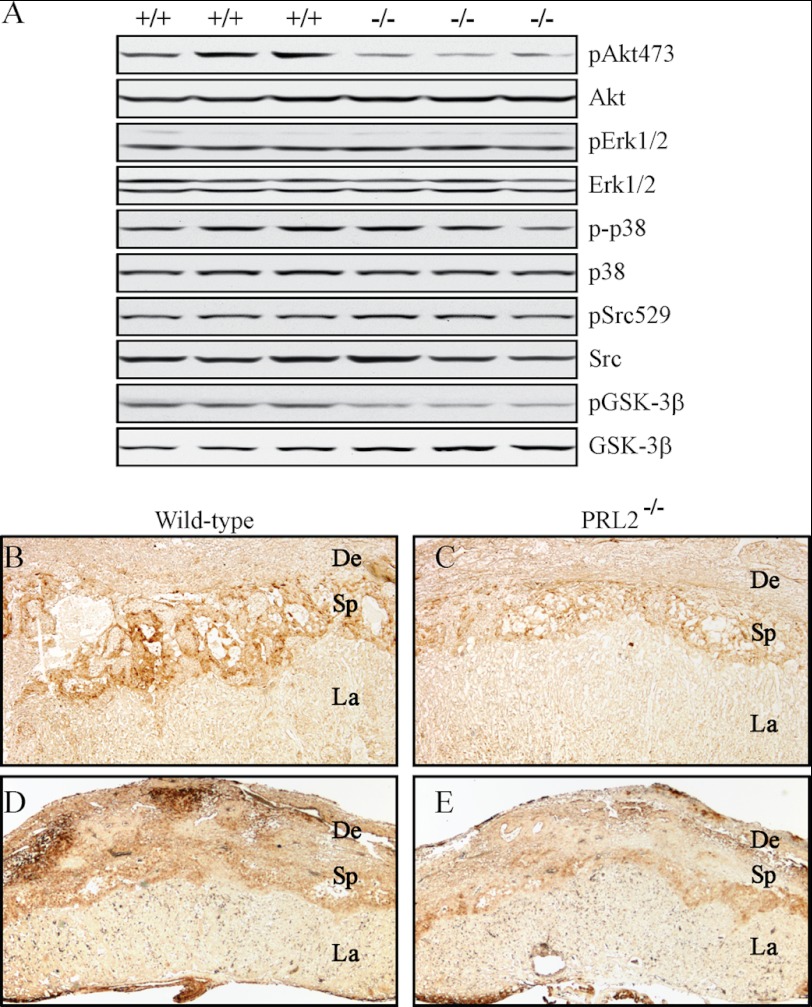
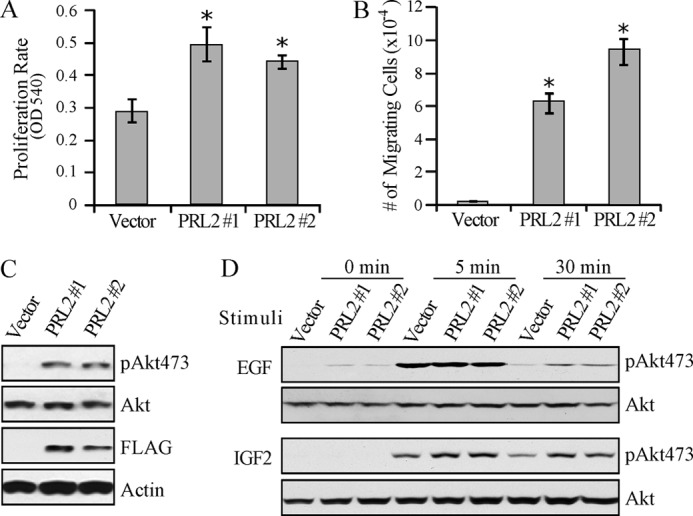
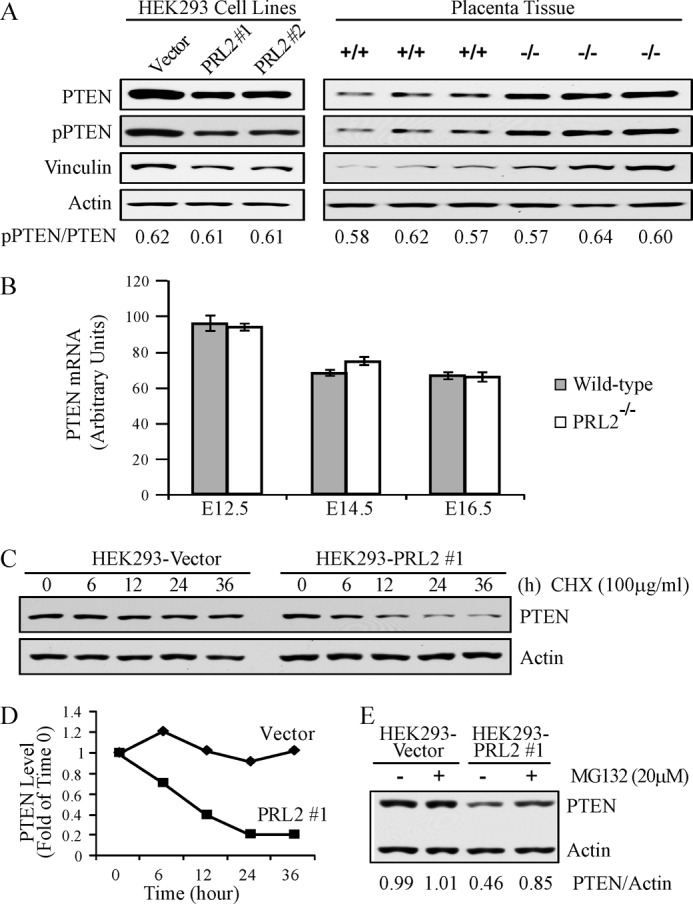
The PRL (phosphatase of regenerating liver) phosphatases are implicated in the control of cell proliferation and invasion. Aberrant PRL expression is associated with progression and metastasis of multiple cancers. However, the specific in vivo function of the PRLs remains elusive. Here we show that deletion of PRL2, the most ubiquitously expressed PRL family member, leads to impaired placental development and retarded growth at both embryonic and adult stages. Ablation of PRL2 inactivates Akt and blocks glycogen cell proliferation, resulting in reduced spongiotrophoblast and decidual layers in the placenta. These structural defects cause placental hypotrophy and insufficiency, leading to fetal growth retardation. We demonstrate that the tumor suppressor PTEN is elevated in PRL2-deficient placenta. Biochemical analyses indicate that PRL2 promotes Akt activation by down-regulating PTEN through the proteasome pathway. This study provides the first evidence that PRL2 is required for extra-embryonic development and associates the oncogenic properties of PRL2 with its ability to negatively regulate PTEN, thereby activating the PI3K-Akt pathway.
Figures
Similar articles
-
Mechanism of PRL2 phosphatase-mediated PTEN degradation and tumorigenesis.Proc Natl Acad Sci U S A. 2020 Aug 25;117(34):20538-20548. doi: 10.1073/pnas.2002964117. Epub 2020 Aug 11. Proc Natl Acad Sci U S A. 2020. PMID: 32788364 Free PMC article.
-
Phosphatase of regenerating liver 2 (PRL2) deficiency impairs Kit signaling and spermatogenesis.J Biol Chem. 2014 Feb 7;289(6):3799-810. doi: 10.1074/jbc.M113.512079. Epub 2013 Dec 26. J Biol Chem. 2014. PMID: 24371141 Free PMC article.
-
The PRL2 phosphatase up-regulates miR-21 through activation of the JAK2/STAT3 pathway to down-regulate the PTEN tumor suppressor.Biochem J. 2025 Apr 10;482(7):341-356. doi: 10.1042/BCJ20240626. Biochem J. 2025. PMID: 39665584 Free PMC article.
-
PTEN and Other PtdIns(3,4,5)P3 Lipid Phosphatases in Breast Cancer.Int J Mol Sci. 2020 Dec 2;21(23):9189. doi: 10.3390/ijms21239189. Int J Mol Sci. 2020. PMID: 33276499 Free PMC article. Review.
-
PTEN/PTENP1: 'Regulating the regulator of RTK-dependent PI3K/Akt signalling', new targets for cancer therapy.Mol Cancer. 2018 Feb 19;17(1):37. doi: 10.1186/s12943-018-0803-3. Mol Cancer. 2018. PMID: 29455665 Free PMC article. Review.
Cited by
-
Novel Anticancer Agents Based on Targeting the Trimer Interface of the PRL Phosphatase.Cancer Res. 2016 Aug 15;76(16):4805-15. doi: 10.1158/0008-5472.CAN-15-2323. Epub 2016 Jun 20. Cancer Res. 2016. PMID: 27325652 Free PMC article.
-
Inhibition of PRL2 Upregulates PTEN and Attenuates Tumor Growth in Tp53-deficient Sarcoma and Lymphoma Mouse Models.Cancer Res Commun. 2024 Jan 2;4(1):5-17. doi: 10.1158/2767-9764.CRC-23-0308. Cancer Res Commun. 2024. PMID: 38047587 Free PMC article.
-
Phosphatase of regenerating liver: a novel target for cancer therapy.Expert Opin Ther Targets. 2014 May;18(5):555-69. doi: 10.1517/14728222.2014.892926. Epub 2014 Mar 1. Expert Opin Ther Targets. 2014. PMID: 24579927 Free PMC article. Review.
-
Targeting PRL phosphatases in hematological malignancies.Expert Opin Ther Targets. 2024 Apr;28(4):259-271. doi: 10.1080/14728222.2024.2344695. Epub 2024 Apr 26. Expert Opin Ther Targets. 2024. PMID: 38653737 Free PMC article. Review.
-
Protein tyrosine phosphatases--from housekeeping enzymes to master regulators of signal transduction.FEBS J. 2013 Jan;280(2):346-78. doi: 10.1111/febs.12077. Epub 2013 Jan 17. FEBS J. 2013. PMID: 23176256 Free PMC article. Review.
References
-
- Cates C. A., Michael R. L., Stayrook K. R., Harvey K. A., Burke Y. D., Randall S. K., Crowell P. L., Crowell D. N. (1996) Prenylation of oncogenic human PTPCAAX protein-tyrosine phosphatases. Cancer Lett. 110, 49–55 - PubMed
-
- Zeng Q., Hong W., Tan Y. H. (1998) Mouse PRL-2 and PRL-3, two potentially prenylated protein-tyrosine phosphatases homologous to PRL-1. Biochem. Biophys. Res. Commun. 244, 421–427 - PubMed
-
- Stephens B. J., Han H., Gokhale V., Von Hoff D. D. (2005) PRL phosphatases as potential molecular targets in cancer. Mol. Cancer Ther. 4, 1653–1661 - PubMed
-
- Bessette D. C., Qiu D., Pallen C. J. (2008) PRL PTPs: mediators and markers of cancer progression. Cancer Metastasis Rev. 27, 231–252 - PubMed
Publication types
MeSH terms
Substances
Grants and funding
LinkOut - more resources
Full Text Sources
Molecular Biology Databases
Research Materials
