. 2012 Sep;135(Pt 9):2711-25.
doi: 10.1093/brain/aws160. Epub 2012 Jul 11.

Fractionation of social brain circuits in autism spectrum disorders

Affiliations

Fractionation of social brain circuits in autism spectrum disorders

Stephen J Gotts et al. Brain. 2012 Sep.

Abstract

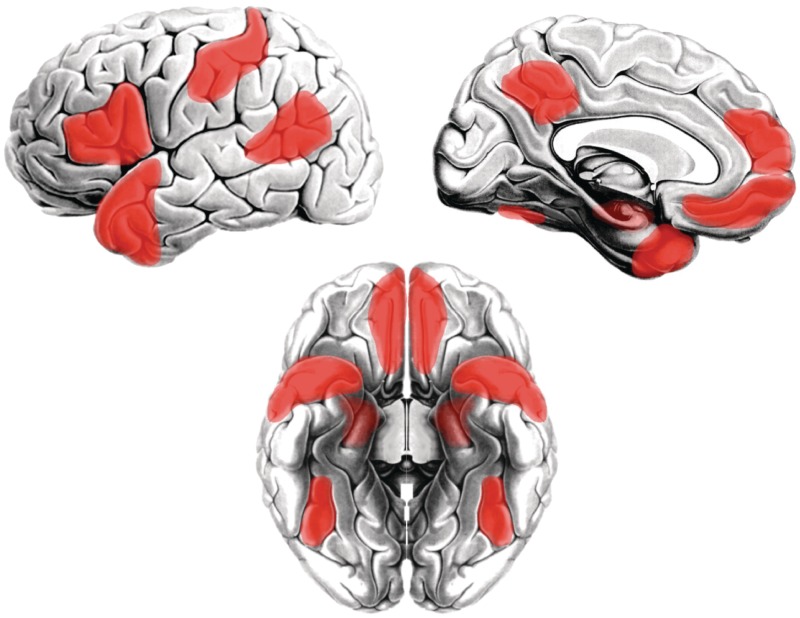
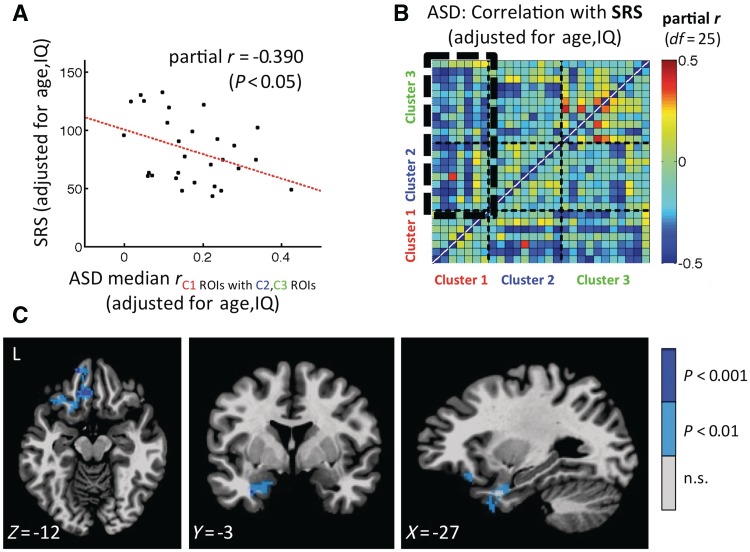
Autism spectrum disorders are developmental disorders characterized by impairments in social and communication abilities and repetitive behaviours. Converging neuroscientific evidence has suggested that the neuropathology of autism spectrum disorders is widely distributed, involving impaired connectivity throughout the brain. Here, we evaluate the hypothesis that decreased connectivity in high-functioning adolescents with an autism spectrum disorder relative to typically developing adolescents is concentrated within domain-specific circuits that are specialized for social processing. Using a novel whole-brain connectivity approach in functional magnetic resonance imaging, we found that not only are decreases in connectivity most pronounced between regions of the social brain but also they are selective to connections between limbic-related brain regions involved in affective aspects of social processing from other parts of the social brain that support language and sensorimotor processes. This selective pattern was independently obtained for correlations with measures of social symptom severity, implying a fractionation of the social brain in autism spectrum disorders at the level of whole circuits.


Figures

Figure 1
Figure 1
Areas of the ‘social brain’. A set of brain regions are commonly co-activated across a range of social tasks: the medial and ventromedial prefrontal cortex, the posterior cingulate/precuneus, the amygdala and anterior hippocampus, the anterior temporal lobes, the posterior superior temporal sulcus and temporo-parietal junction, the lateral portion of the fusiform gyrus, the left inferior frontal gyrus, somatosensory and anterior intraparietal cortices, and the anterior insula (not shown). These are often referred to collectively as the ‘social brain’ (for reviews, see Frith and Frith, 2007; Olson et al., 2007; Blakemore, 2008; Adolphs, 2009; Mitchell, 2009).
Figure 2
Figure 2
Using ‘connectedness’ to identify seed regions of interest that yield differences in functional connectivity between autism spectrum disorders (ASD) and typically developing (TD) groups. For each participant, in A, functional connectedness was calculated for each voxel within the brain mask by first extracting its specific time series (i.e. the ‘seed’), then correlating it with all of the other voxels’ time series. These correlation values were then averaged over the brain mask, storing the mean value back into the seed voxel, and this process was then repeated for all voxels. For group analyses, in B, individual connectedness maps were transformed to normally distributed values (Fisher’s z) and averaged by group (autism spectrum disorders versus typically developing) (shown are the group-average z-transformed connectedness values, formula image
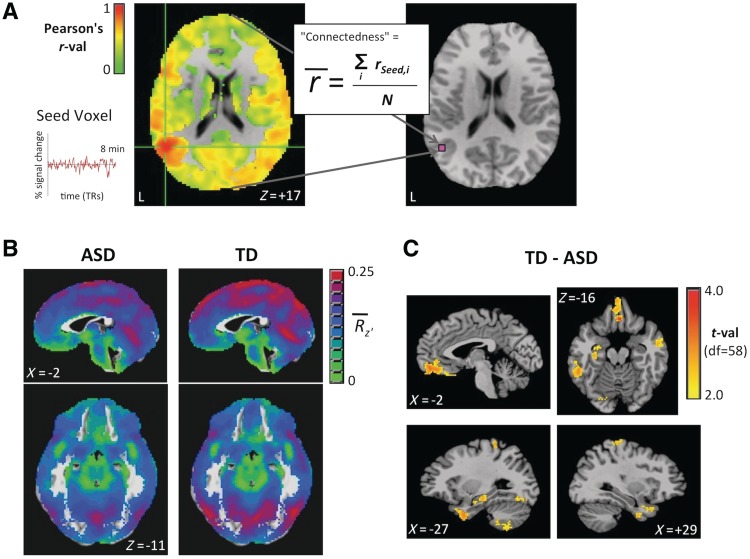
; see colour bar). (C) The normally distributed group maps could then be compared using t-tests (P < 0.05, two-tailed, minimum cluster size = 100 contiguous voxels). Data for this and subsequent figures are plotted in standard anatomical coordinates (Talairach-Tournoux).
Figure 3
Figure 3
Seed and non-seed regions of interest showing significant differences between the autism spectrum disorders (ASD) group and the typically developing (TD) group. Seed regions of interest from Fig. 2 that yielded significant differences in functional connectivity between groups (all typically developing > autism spectrum disorders) are shown in orange. Contiguous non-seed voxels that appeared in ≥2 of the individual seed maps were included as additional non-seed regions of interest (shown in yellow). All results are corrected for multiple comparisons with P < 0.05 both for whole-brain tests, as well as the number of seeds tested (see Supplementary Fig. 4 and Table 2 for complete details).
Figure 4
Figure 4
Autism spectrum disorders (ASD) and typically developing (TD) groups differ in the functional relationships among regions of interest (ROI) at the level of whole circuits. Functional relationships among the regions of interest were visualized both through multidimensional scaling and K-means clustering with good agreement between the methods in A. Points in the 2D scatter plot represent the 27 regions of interest, shown separately for the autism spectrum disorders group and the typically developing group, with near points in the plot indicating similarity in the pattern of correlation with respect to the entire set of regions of interest. A three-cluster solution (shown in red, blue and green) served as the best trade-off of variance explained to model complexity (inset), with Cluster 1 (red) identifying limbic-related regions of interest involved in emotional/affective aspects of social processing, Cluster 2 (blue) identifying regions of interest related to linguistic aspects, and Cluster 3 (green) identifying regions of interest related to visuospatial and somatomotor aspects. The 3D anatomical locations of these regions of interest are shown in B by cluster membership in Talairach coordinates. Thick lines connecting regions of interest correspond to Bonferroni-corrected group differences (t-tests) in the correlation values between those regions of interest, whereas thin lines denote group differences that failed to survive correction. The full Region X Region correlation matrices are shown in C for the autism spectrum disorders and typically developing groups, sorted by cluster. The corresponding t-tests, which highlight the reliable differences between the groups, are shown to the right (see Table 2 for row/column order of region of interest identities). Correlation values are selectively lower in the autism spectrum disorders group between limbic-related regions of interest in Cluster 1 and those in Clusters 2 and 3, but are relatively preserved within Cluster 1 (see colour bars for corresponding r- and t-values; red t-values indicate a Bonferroni-corrected level of significance).
Figure 5
Figure 5
Correlations with autism spectrum disorders (ASD) symptom severity reveal the same circuit-level organization as the group comparisons. The median correlation value between regions of interest (ROI) in Cluster 1 and those in Clusters 2 and 3 for each participant with an autism spectrum disorders is negatively related to Social Responsiveness Scale (SRS) total score after controlling age and IQ (lower median correlation > higher severity) is shown in A. The x- and y-axes show adjusted values after removing the linear effects of age and IQ from each variable using multiple regression. The partial correlation values between functional connectivity (region of interest–region of interest correlation) and Social Responsiveness Scale total score are shown in B for all region of interest combinations, revealing the mirror pattern to that observed in C. A thick, dashed line denotes the portion of the matrix used to calculate the median correlations in A. In a whole-brain search, negative partial correlations of autism spectrum disorders functional connectedness with Social Responsiveness Scale total score are observed in left ventromedial prefrontal cortex, amygdala and anterior ventral temporal cortex (adjusted for age, IQ) is shown in C. Results are corrected for multiple comparisons to P < 0.05 and overlap with three of the seed region of interest identified independently in the group comparisons (see colour bar for uncorrected significance levels in single voxels).

Comment in

  • Autism and intellectual disability.
    Tallantyre E, Robertson NP. Tallantyre E, et al. J Neurol. 2013 Mar;260(3):936-9. doi: 10.1007/s00415-013-6861-y. J Neurol. 2013. PMID: 23423245 No abstract available.

Similar articles

Cited by

References

    1. Adolphs R. The social brain: neural basis of social knowledge. Annu Rev Psychol. 2009;60:693–716. - PMC - PubMed
    1. Adolphs R. What does the amygdala contribute to social cognition? Ann N Y Acad Sci. 2010;1191:42–61. - PMC - PubMed
    1. Adolphs R, Spezio M. Role of the amygdala in processing visual social stimuli. Prog Brain Res. 2006;156:363–78. - PubMed
    1. Amaral DG, Schumann CM, Nordahl CW. Neuroanatomy of autism. Trends Neurosci. 2008;31:137–45. - PubMed
    1. Amodio DM, Frith CD. Meeting of minds: the medial frontal cortex and social cognition. Nat Rev Neurosci. 2006;7:268–77. - PubMed

Publication types