. 2012 Oct;33(10):1930-9.
doi: 10.1093/carcin/bgs231. Epub 2012 Jul 12.

Both stromal cell and colonocyte epidermal growth factor receptors control HCT116 colon cancer cell growth in tumor xenografts

Affiliations

Both stromal cell and colonocyte epidermal growth factor receptors control HCT116 colon cancer cell growth in tumor xenografts

Reba Mustafi et al. Carcinogenesis. 2012 Oct.

Abstract

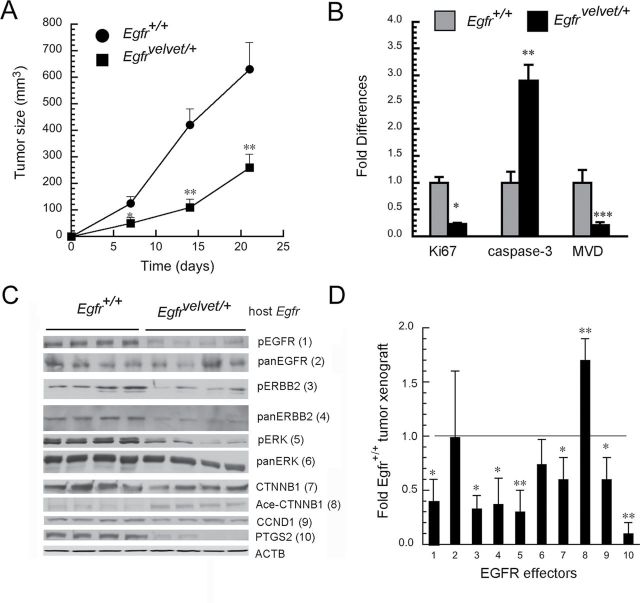
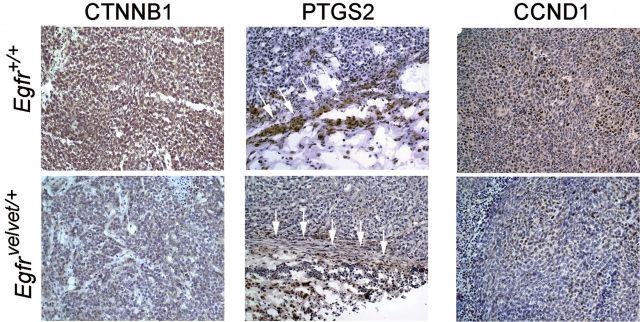
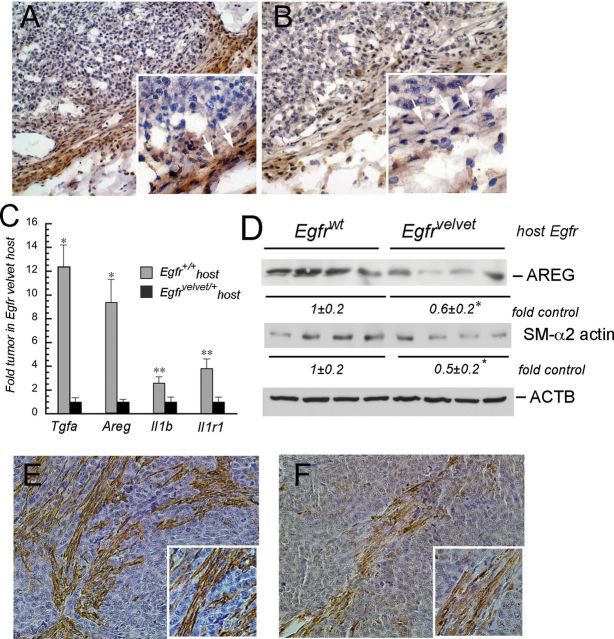
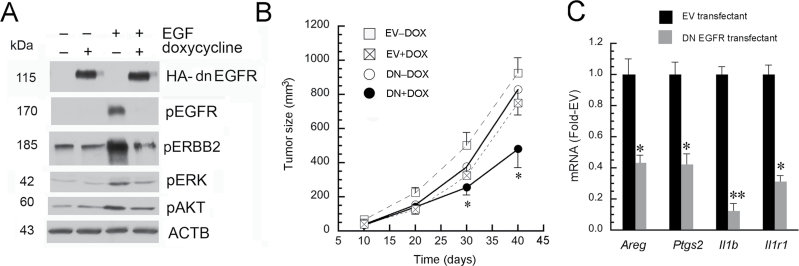
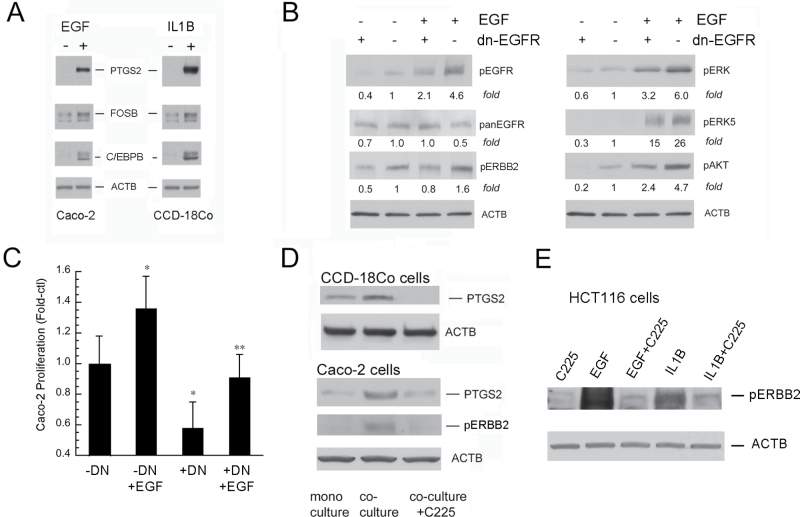
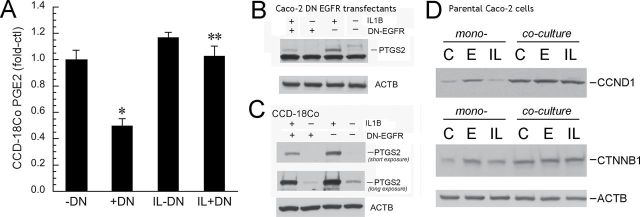
Colon cancer growth requires growth-promoting interactions between malignant colonocytes and stromal cells. Epidermal growth factor receptors (EGFR) are expressed on colonocytes and many stromal cells. Furthermore, EGFR is required for efficient tumorigenesis in experimental colon cancer models. To dissect the cell-specific role of EGFR, we manipulated receptor function on stromal cells and cancer cells. To assess the role of stromal EGFR, HCT116 human colon cancer cells were implanted into immunodeficient mice expressing dominant negative (DN) Egfr(Velvet/+) or Egfr(+/+). To assess the role of cancer cell EGFR, HCT116 transfectants expressing inducible DN-Egfr were implanted into immunodeficient mice. To dissect EGFR signals in vitro, we examined colon cancer cells in monoculture or in cocultures with fibroblasts for EGFR transactivation and prostaglandin synthase 2 (PTGS2) induction. EGFR signals were determined by blotting, immunostaining and real-time PCR. Tumor xenografts in Egfr(Velvet/+) mice were significantly smaller than tumors in Egfr(+/+) mice, with decreased proliferation (Ki67) and increased apoptosis (cleaved caspase-3) in cancer cells and decreased stromal blood vessels. Mouse stromal transforming growth factor alpha (TGFA), amphiregulin (AREG), PTGS2 and Il1b and interleukin-1 receptor 1 (Il1r1) transcripts and cancer cell beta catenin (CTNNB1) and cyclin D1 (CCND1) were significantly lower in tumors obtained from Egfr(Velvet/+) mice. DN-EGFR HCT116 transfectants also formed significantly smaller tumors with reduced mouse Areg, Ptgs2, Il1b and Il1r1 transcripts. Coculture increased Caco-2 phospho-active ERBB (pERBB2), whereas DN-EGFR in Caco-2 cells suppressed fibroblast PTGS2 and prostaglandin E2 (PGE2). In monoculture, interleukin 1 beta (IL1B) transactivated EGFR in HCT116 cells. Stromal cell and colonocyte EGFRs are required for robust EGFR signals and efficient tumor growth, which involve EGFR-interleukin-1 crosstalk.


Conflict of interest statement

Conflict of Interest Statement: None declared.

Figures

Fig. 1.
Fig. 1.
Stromal cell EGFR controls tumor xenograft growth and EGFR effector signals. HCT116 cells (5 × 10⁶) were implanted in the flanks of Rag1-/- Egfr+/+ and Rag1-/- EgfrVelvet/+ mice that were killed 3 weeks later. (A) Tumor growth; (n = 4 for each genotype, *p < 0.05, **P < 0.005 compared with tumors in Rag1-/- Egfr+/+ mice). (B) Quantitation of Ki67, cleaved caspase-3 and microvessel density (MVD). Tumors were fixed in 10% formalin and stained for Ki67, cleaved caspase-3 and nestin-1. Immunostaining was quantified by computer-assisted image analysis and microvessel density (MVD) as described (11). *P < 0.005; **P < 0.05; ***P < 0.001, compared with tumors in Egfr+/+ mice (n = four tumors for each genotype). (C) Western blots of indicated proteins. Numbers adjacent to proteins refer to bar graph in Figure 1D. (D) Quantitative densitometry of indicated proteins in tumors growing in EgfrVelvet/+ mice expressed as fold proteins in tumors growing in Egfr+/+ mice. 1 = pEGFR; 2 = panEGFR; 3 = pERBB2; 4 = panERBB2, 5 = pERK; 6 = panERK; 7= CTNNB1; 8 = acetylated CTNNB1; 9 = CCND1; and 10 = PTGS2. Horizontal line indicates normalized expression levels of proteins in tumors from Egfr+/+ mice. *P < 0.05, **P < 0.005 compared with proteins from tumors growing in Egfr +/+ mice (n = four tumors for each genotype).
Fig. 2.
Fig. 2.
Loss of stromal EGFR reduces expression of CTNNB1 and CCND1 in colon cancer cells and PTGS2 in stromal cells. Tumor xenografts derived from HCT116 cells implanted in Egfr +/+ and Egfr Velvet/+ mice were stained for the indicated proteins as described in Materials and methods. Note decreased CTNNB1 and CCND1 staining in malignant colonocytes and reduced PTGS2 expression in stromal cells in tumors growing in Egfr Velvet/+ mice. For PTGS2, in the middle panel, compare areas indicated by white arrows. PTGS2-positive cells have fibroblast-like appearance and stain for smooth muscle alpha2 actin (SMA; see Figure 3E and 3F). Sections are representative of four tumors stained for the indicated proteins.
Fig. 3.
Fig. 3.
Stromal cell EGFR controls stroma-derived EGFR ligands and Il1b expression in tumor xenografts. (A) TGFA expression in tumor xenograft in Egfr+/+ mice. (B) TGFA expression in tumor xenograft in EgfrVelvet/+ mouse. Note the increased TGFA expression (brown staining) in stromal cells surrounding the tumor in Egfr+/+ mouse compared with stromal cells surrounding the tumor in EgfrVelvet/+ mice. TGFA-expressing cells exhibit a fibroblast-like appearance (compare areas marked with white arrows in insets in A and B). (C) Mouse Tgfa, Areg, Il1b and Il1r1 transcripts are decreased in tumor xenografts growing in EgfrVelvet/+ mice. Real-time PCR was carried out using mouse species-specific primers for the indicated genes. *P < 0.005, **P < 0.05 compared with Egfr+/+ mice (n = four tumors for each genotype). (D) AREG and smooth muscle alpha2 actin (SMA) expression in tumor xenografts in Egfrwt and EgfrVelvet/+ mice. *P < 0.05 compared with tumors in Egfrwt mice. Note that smooth muscle alpha2 actin (SMA) abundance is lower in the tumor growing in EgfrVelvet/+ mouse. E. Smooth muscle alpha2 actin immunostaining in tumor xenograft in Egfrwt mouse. F. Smooth muscle alpha2 actin immunostaining in tumor xenograft in EgfrVelvet mouse. Note the darker brown staining in Figure 3E compared with that in Figure 3F.
Fig. 4.
Fig. 4.
DN-EGFR inhibits EGFR signals in cell culture and tumor xenograft growth of HCT116 transfectants. (A) DN-EGFR inhibits receptor activation and signals in HCT116 transfectants in vitro. Transfectants were plated overnight on six-well plates and then treated with 25ng doxycycline (+) or phosphate-buffered saline (PBS; –). Twelve hours later, cells were stimulated with EGF (+, 10ng/ml) or PBS (–) for 5min. Cells were lysed and indicated proteins were probed by western blotting. Note that doxycycline induced DN-EGFR (HA tag) expression, which blocked EGFR activation. (B) DN-EGFR induction in HCT116 colon cancer cell transfectants inhibits tumor xenograft growth. HCT116 DN-EGFR or EV transfectants were implanted into Egfr +/+ NOD-Scid Il2rg null mice. After one week, mice were provided chow supplemented with 625mg doxycycline/kg chow (+Dox) or continued on standard chow (–Dox). Tumor growth was monitored and tumor size calculated as width2 × length/2. *P < 0.05, compared with DN-Dox mice (n = four tumors/group). Error bars were omitted from EV+Dox group for clarity. (Note EV-Dox and EV+Dox were not significantly different). (C) Induction of DN-EGFR in HCT116 cells reduces mouse stromal Areg, Ptgs2, Il1b and Il1r1 in tumor xenografts. Mice implanted with EV or DN-EGFR transfectants were supplemented with doxycycline as described in Figure 4B (EV+Dox and DN+Dox). RNA was extracted from tumor xenografts at killing. Real-time PCR was carried out using mouse-specific primers, as described in Materials and methods (n = four tumors per group; *P < 0.05, **P < 0.005 compared with tumor xenografts derived from EV cells).
Fig. 5.
Fig. 5.
EGF and IL1B activate colon cancer cells and colonic fibroblasts. (A) EGF and IL1B increase PTGS2, FOSB and C/EBPB in Caco-2 cells (left panel) and CCD-18Co cells (right panel). Cells were treated for 4h with vehicle (–) or EGF (+, 10ng/ml) or IL1B (+, 10ng/ml) and lysates were assayed for indicated proteins. (B) DN-EGFR blocks receptor activation in Caco-2 cells. (C) DN-EGFR inhibits basal and EGF-stimulated Caco-2 cell proliferation. Cells were treated with doxycycline (–DN) or media alone (+DN) ; stimulated with EGF (+EGF, 10ng/ml) or vehicle (–EGF); and proliferation was measured 48h later by the Wst-1 assay (*P < 0.05 compared with –DN; **P < 0.05 compared with –DN+EGF). (D) Coculture increases pERBB2 in Caco-2 and PTGS2 in fibroblast and Caco-2 cell by an EGFR-dependent mechanism. Cells were cultured on transwells alone (monoculture) or on opposite sides of the transwells (coculture) for 24h. Where indicated, C225-neutralizing anti-EGFR antibodies (20 µg/ml) were added during coculture. Results represent n = 3 independent platings. (E) IL1B transactivates EGFR in HCT116 colon cancer cells. HCT116 cells were treated with C225 antibodies (20 µg/ml) or vehicle for 2h and then stimulated for 5min with EGF (10ng/ml), or IL1B (10ng/ml). Whole-cell lysates were probed for phospho-active ERBB2 (pERBB2) by western blotting. Results represent n = 2 independent platings.
Fig. 6.
Fig. 6.
EGFR signals in Caco-2 cells regulate fibroblast PTGS2 and PGE2, whereas fibroblasts regulate CTNNB1 and CCND1 expression in Caco-2 cells. (A) Colonic fibroblast PGE2 (pg/ml) by EIA. CCD-18Co colonic fibroblasts and Caco-2 DN-EGFR transfectants were cocultured on transwells. DN-EGFR was suppressed (–DN) or induced (+DN) for 24h, and cells were then treated with IL1B (IL, 10ng/ml) or vehicle for 4h. Fibroblast-conditioned medium was collected for PGE2 analysis and cells were lysed to assess PTGS2 protein expression. *P < 0.05 compared with cells without DN-EGFR induction (–DN), **P < 0.05, compared with IL1B-treated cells without DN-EGFR induction (IL–DN). PGE2 secretion in Caco-2 cells was <10% of CCD-18Co cells (data not shown). (B) PTGS2 expression in Caco-2 cells. Methods were the same as in Figure 6A. (C) PTGS2 expression in CCD-18Co cells. Methods were the same as in Figure 6A. A long exposure is shown in Figure 6C to demonstrate basal PTGS2 in CCD-18Co cells. A short exposure is shown to compare PTGS2 expression in IL1B-treated –DN cells versus IL1B-treated +DN cells. Results represent n = 3 independent platings. (D) Fibroblasts increase basal and EGF- and IL1B-induced CTNNB1 and CCND1 in cocultured Caco-2 cells. Caco-2 cells and CCD-18Co were seeded on transwells and cultured as mono- or cocultures. Cells were treated with vehicle (PBS) or EGF (E, 10ng/ml) or IL1B (IL, 10ng/ml). After 24h, Caco-2 cells were harvested and lysates were probed for CTNNB1 and CCND1. Note that coculture conditions increased expression of these proto-oncogenes in Caco-2 cells under both basal and stimulated conditions. Shown are representative western blots of two independent experiments.

Similar articles

Cited by

References

    1. Li H., et al. (2007). Tumor microenvironment: the role of the tumor stroma in cancer J Cell Biochem., 101 805–815 - PubMed
    1. Inatomi O., et al. (2006). Regulation of amphiregulin and epiregulin expression in human colonic subepithelial myofibroblasts Int. J. Mol. Med. 18 497–503 - PubMed
    1. Blanchot-Jossic F., et al. (2005). Up-regulated expression of ADAM17 in human colon carcinoma: co-expression with EGFR in neoplastic and endothelial cells J. Pathol. 207 156–163 - PubMed
    1. Barnard J.A., et al. (1995). Epidermal growth factor-related peptides and their relevance to gastrointestinal pathophysiology Gastroenterology 108 564–580 - PubMed
    1. Inatomi O., et al. (2006). Regulation of amphiregulin and epiregulin expression in human colonic subepithelial myofibroblasts Int. J. Mol. Med. 18 497–503 - PubMed

Publication types