. 2011 Jul 1:41:133-168.
doi: 10.1146/annurev-matsci-062910-100431.

Nanomechanics of the Cartilage Extracellular Matrix

Affiliations

Nanomechanics of the Cartilage Extracellular Matrix

Lin Han et al. Annu Rev Mater Res. .

Abstract

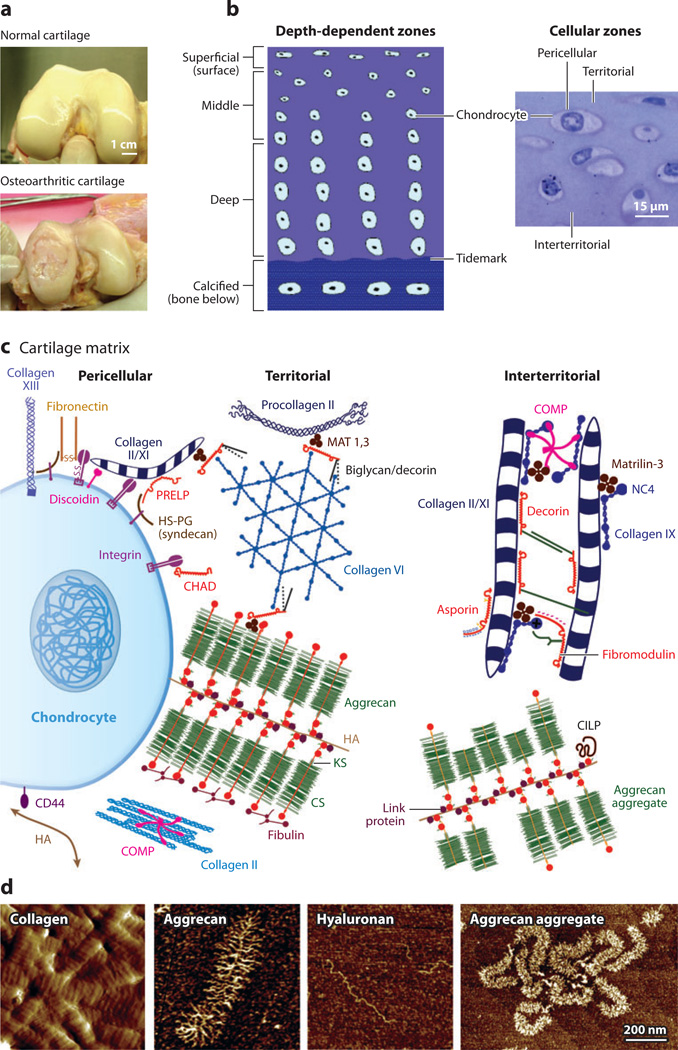
Cartilage is a hydrated biomacromolecular fiber composite located at the ends of long bones that enables proper joint lubrication, articulation, loading, and energy dissipation. Degradation of extracellular matrix molecular components and changes in their nanoscale structure greatly influence the macroscale behavior of the tissue and result in dysfunction with age, injury, and diseases such as osteoarthritis. Here, the application of the field of nanomechanics to cartilage is reviewed. Nanomechanics involves the measurement and prediction of nanoscale forces and displacements, intra- and intermolecular interactions, spatially varying mechanical properties, and other mechanical phenomena existing at small length scales. Experimental nanomechanics and theoretical nanomechanics have been applied to cartilage at varying levels of material complexity, e.g., nanoscale properties of intact tissue, the matrix associated with single cells, biomimetic molecular assemblies, and individual extracellular matrix biomolecules (such as aggrecan, collagen, and hyaluronan). These studies have contributed to establishing a fundamental mechanism-based understanding of native and engineered cartilage tissue function, quality, and pathology.


Figures

Figure 1
Figure 1
Schematic illustration of the molecular constituents in cartilage and their arrangement into large multimolecular assemblies. (a) Macroscale comparison of normal (healthy) and osteoarthritic human cartilage tissue; courtesy of Drs. D. Chai & C.Wheeler. (b) Cross-sectional schematic of cartilage tissue showing a depth-dependent zone and gradient in cell size, shape, and collagen network morphology. The cells are flattened near the surface (superficial zone) and become larger and rounder with increasing depth in the middle and deep zones. The tidemark is the boundary between the nonmineralized and the mineralized (calcified) cartilage. In addition, the cartilage extracellular matrix is organized into pericellular, territorial, and interterritorial matrices, each of which is present at increasing distance from the chondrocyte cell surface. Panel b adapted with permission from Reference . (c) Matrix molecular composition and organization in the different extracellular regions. At the cell surface, many receptors interact with specific matrix molecules as well as with soluble proteins (e.g., growth factors). Matrix molecules in this pericellular zone are also connected to molecules in the territorial region. Panel c adapted with permission from Reference . (d) Nanostructures of different cartilage molecular constituents via tapping-mode AFM imaging. Type II collagen fibrils from proteoglycan-digested calf knee cartilage surface (amplitude image), single aggrecan and hyaluronan molecules, and aggrecan aggregates composed of fetal bovine aggrecan noncovalently bound to hyaluronan, which is further stabilized by the small globular link protein (height images). Panel d reproduced with permission from Reference and courtesy of Dr. H.-Y. Lee.
Figure 2
Figure 2
Instrumented microindentation of cartilage tissue. (a) Representative load-displacement curves using a spherical indenter tip (R ~ 100 µm) in a hydrated state and safranin-O-stained histological sections red stains for aggrecan) for control and repair tissue via a rabbit model (rabbit B of panel b). (b) Indentation stiffness S for three tissue regions (control, distal repair, and proximal repair) of three rabbits (mean ± SD). Asterisks denote that the repair region is significantly different from the control region (p < 0.05). Daggers denote that the distal and proximal regions are significantly different from each other (p < 0.05). Panels a and b adapted with permission from Reference . (c) Schematic of seven different regions of interest (ROI) for a normal rabbit metacarpophalangeal joint tested by microindentation. (Left) Marked boxes indicate a square pattern of four indentations (labeled 1–4) at each distal ROI or three indentations (labeled 5–7) at each proximal ROI (not drawn to scale). Adapted with permission from Reference . (Right) The plot shows the corresponding indentation stiffness S for the seven ROI shown at left (mean ± SD). Data adapted from table 3 in Reference .
Figure 3
Figure 3
Atomic force microscopy–based nanoindentation on articular cartilage. (Left panels) Schematic of microsized (top) and nanosized (bottom) indenter tips versus cartilage collagen and aggrecan molecular size (drawn to scale). (a) Scanning electron microscope image of pericellular and territorial/interterritorial matrices of middle/deep zone extracellular matrix of porcine articular cartilage, where the hole in the middle represents the region originally occupied by a chondrocyte. (b) Representative height and indentation modulus Eind spatial map of porcine cartilage using a microspherical tip (R = 2.5 µm) in phosphate-buffered saline (PBS). Panels a and b adapted with permission from Reference . (c,d) Typical nanoindentation force–versus–z-piezo displacement unloading curves on normal and type IX collagen gene-knockout (Col9a1−/−) murine joints via a nanosized pyramidal tip in PBS: (c) aging normal C57BL/6 mice (n = 15 per group) and (d) 1-month-old wild-type controls and Col9a1−/− mice using a nanosized pyramidal tip (n = 7). Panels c and d adapted with permission from Reference .
Figure 4
Figure 4
Temporal development of tissue-engineered, chondrocyte-associated matrix. (a) (Left) Schematic of indentation (using a spherical tip R ~ 2.5 µm) on individual chondrocytes and their cell-associated matrix, which are fixed within pyramidal wells of a silicon microfabricated substrate. (Middle) Tapping-mode atomic force microscopy image of a chondrocyte and newly synthesized tissue-engineered cell-associated matrix after 11-day culture in 10% fetal bovine serum (FBS). (Right) Nanoindentation curve (mean ± SEM of five loading cycles per cell for n ≥ 5 cells) on loading of individual chondrocytes with engineered cell-associated matrix (after release from alginate at different times) in culture with 10% FBS and with insulin-like growth factor-1 (IGF-1) and osteogenic protein-1 (OP-1). Panel a adapted with permission from Reference . (b) Dynamic mechanical properties of chondrocytes and their engineered cell-associated matrix (mean ± SEM; n = 5 cells) using a spherical tip in culture with IGF-1 and OP-1. (Left) Schematic of the dynamic oscillatory nanoindentation. (Middle) Dynamic indentation modulus, |E*|, and (Right) the phase angle, δ, as a function of oscillation frequency after 21 and 28 days of culture. Panel b adapted with permission from Reference .
Figure 5
Figure 5
Microfriction of cartilage tissue using lateral force microscopy. (a) Friction coefficients of normal bovine humeral articular cartilage surface from a microscale atomic force microscopy (AFM) test (µAFM; mean ± SD for three locations on each sample) using a polystyrene spherical tip (R ~ 2.5 µm) and macroscopic experiments (µmin and µeq) for each specimen pair in phosphate-buffered saline (PBS). Panel a adapted with permission from Reference . (b) Effect of enzymatic treatment on friction coefficients µ of bovine articular cartilage surface regions subject to relatively high (M1) and low (M4) contact pressure in vivo (mean ± 95% confidence interval), measured via a Si3N4 pyramidal AFM tip in PBS. Asterisks indicate a significant effect on µ upon enzymatic treatment; p ≤ 0.0145 from one-way nested analysis of variance (ANOVA). Panel b adapted with permission from Reference .
Figure 6
Figure 6
Compressive nanomechanics of cartilage chondroitin sulfate glycosaminoglycans (CS-GAGs) and aggrecan. (Left) Schematic of high-resolution force spectroscopy experiments involving compression between two opposing CS-GAG layers and aggrecan layers. (a) Normal force-versus-separation distance for a nanosized GAG-functionalized probe tip (R ~ 50 nm) versus a GAG-functionalized planar substrate with GAG-GAG separation distances of ~6.5 nm in different bath ionic strengths (IS) (0.0001–1.0 M NaCl, pH ~ 5.6). (b) Comparison of GAG-GAG repulsion high-resolution force spectroscopy data in panel a at 0.1 M IS with the predictions of the interdigitated charged-rod model with parameter values fixed at [NaCl] = 0.1 M, tip radius R ~ 50 nm, rod height h = 45 nm, radius w = 2 nm, inter-rod distance s = 6–7 nm, and total charge per rod Qrod = −8 × 10⁻¹⁸ C. Panels a and b reproduced with permission from Reference . (c) Normal force-versus-separation distance between an aggrecan-functionalized spherical tip (R ~ 2.5 µm) and an aggrecan-functionalized planar gold substrate in different bath IS (0.001–1.0 M NaCl, pH ~ 5.6). (d) Comparison of converted stress-strain aggrecan-aggrecan repulsion data in panel c at 0.1 M IS with the charged-rod model (112, 113), unit cell model (71, 112), and volume charge Donnan model (112). Panels c and d adapted with permission from Reference .
Figure 7
Figure 7
Shear and self-adhesion nanomechanics of cartilage aggrecan. (Left) Schematics of lateral force microscopy experiments involving shear of two opposing aggrecan layers and high-resolution force spectroscopy experiments that probe aggrecan self-adhesion. (a) Lateral-versus-applied normal force (mean ± SD, n = 8 different locations) between an aggrecan-functionalized spherical tip (R ~ 2.5 µm) and an aggrecan-functionalized planar gold substrate in different bath ionic strengths (IS) (0.001–1.0 M NaCl, pH ~ 5.6), with corresponding least squares linear regression fit for each IS (R2 > 0.92 for all the fits; 95% confidence interval width of µ < 0.01). (b) Lateral proportionality ratio µ versus lateral tip displacement rate (mean ± 95% confidence interval at n = 8 different locations; R2 > 0.88 for all data) between the aggrecan tip and aggrecan substrate. Panels a and b adapted with permission from Reference . (c) Comparison of force-distance curves obtained via neutral hydroxyl-terminated self-assembled monolayer (OH-SAM) and aggrecan-functionalized tips (R ~ 2.5 µm) on aggrecan end-grafted planar substrates (IS = 1.0 M, NaCl aqueous solution, surface dwell time t = 30 s, maximum compressive force Fmax ~ 45 µN, z-piezo displacement rate z = 4 µm s−1). Different experiments were carried out at 10 different locations, as shown for each probe tip. (Inset) Definition of adhesive interaction distance Dad, maximum adhesion force Fad, and adhesion energy Ead for each pair of approach-retract force-distance curves. (d) Adhesion energy, Ead, versus surface dwell time t between two opposing aggrecan end-grafted layers in 0.001–1.0 M NaCl, pH ~ 5.6 (Fmax ≈ 45 nm, z ≈ 4 µm s−1, mean ± SEM, n ≥ 30 for each t at each IS). Ead depended significantly on t and IS [two-way analysis of variance (ANOVA), pt < 0.0001, pIS < 0.0001]. Panels c and d adapted with permission from Reference .
Figure 8
Figure 8
Molecular structure and compressive nanomechanics of tissue-engineered aggrecan. (a) Three-dimensional contact-mode atomic force microscopy (AFM) height image of micropatterned, chemically end-attached aggrecan monolayers in 0.001 M NaCl aqueous solution at ~100 pN normal load and tapping-mode AFM images of single aggrecan molecules. (Left) Aggrecan synthesized by adult equine bone marrow stromal cells (BMSCs) cultured in self-assembling peptide hydrogel scaffold. (Right) Aggrecan extracted from articular cartilage of adult equine knee joint femoropatellar grooves. (b) (Left) Schematic of compressive nanomechanics experiment on end-grafted aggrecan layer using a neutral hydroxyl-functionalized self-assembling monolayer spherical tip (R ~ 2.5 µm). (Right) Corresponding normal force-versus-distance curves in 0.001–1.0 M NaCl solutions (pH ~ 5.6). (c) Stress–versus–GAG concentration curves converted from the 0.1 M NaCl data in panel b. Adapted with permission from Reference .
Figure 9
Figure 9
Boundary lubrication by hyaluronan (HA) measured by the surface force apparatus (SFA). (a) Schematic of HA’s chemical structure and the proposed mechanism of HA attachment onto a lipid bilayer–coated mica surface: Each HA molecule is expected to covalently attach to positively charged caproylamine-phosphatidylethanolamine lipid head groups. (b) Shear (friction) force versus applied normal force between two mica surfaces with covalently attached HA on lipid bilayer coatings (as illustrated in panel a) in 1 mg ml−1 HA solution. The friction force increased after damage occurred at point 1. Adapted with permission from Reference .
Figure 10
Figure 10
Boundary lubrication by lubricin. (a) Schematic of proposed lubricin physisorbed molecular conformation on mica (negatively charged surface), alkanethiol (hydrophobic surface), and aminothiol (positively charged surface); interlubricin bonding occurs for negatively and positively charged surfaces. (b) Friction coefficients µ (= df/dF, where F is the applied normal force and f is the friction force) measured for the surfaces shown in panel a in phosphate-buffered saline (PBS) solution of lubricin. Each data point represents an independent experiment. For each group, the horizontal marks indicate the mean values, <µ>, and the vertical boxes show the dispersion (scatter) of the experimental data. Panels a and b reproduced with permission from Reference . (c) Friction force versus applied normal force between hydroxyl-terminated self-assembled monolayer (OH-SAM) surfaces in PBS, and the addition of 200 µg ml−1 hyaluronan, 3.3 mg ml−1 hyaluronan, and a mixture of lubricin and hyaluronan, as measured via lateral force microscopy using an OH-SAM-functionalized spherical tip (R ~ 5 µm). Panel c adapted with permission from Reference .
Figure 11
Figure 11
Mechanics of single cartilage extracellular matrix macromolecules. (a) (Top) Schematic of stretching single bovine nasal septal chondroitin sulfate glycosaminoglycan (CS-GAG) in 1% CS-GAG aqueous solution via atomic force microscopy (AFM)-based single-molecule force spectroscopy (SMFS) (tip radius R ~ 10 nm). (Bottom) Corresponding force-versus-extension curves (displacement normalized to contour length) from the CS-GAG SMFS experiment; the solid line is a fit to the data of the extensible worm-like chain model (116). Data symbols with different colors show multiple repeats of the experiment. (b) (Top) Schematic of calcium-mediated self-adhesion interaction between aggrecan monomers immobilized on a gold-coated tip and gold substrate surface via AFM-based SMFS (R ~ 25 nm) in 0.1 M NaCl + 0.01 M CaCl2 aqueous solution (pH 5.6). (Bottom) Corresponding force versus z-piezo extension curve from the aggrecan self-adhesion SMFS experiment. (c) (Top) Schematic of stretching a single type II collagen molecule using polystyrene beads (R ~ 2.05 µm) via optical tweezers. The collagen is stretched as the large bead is moved away from the trapping center of the XY stage in the aqueous solution of 25 mM KCl, 1 mM EGTA, 0.2% Tween 20, 0.1% casein, and 25 mM HEPES at pH 7.4. (Bottom) Corresponding force-versus-extension curve from the type II collagen extension optical tweezers experiment; the solid line is a fit to the data of the extensible worm-like chain model (116). The contour length Lc and persistence length Lp are 300 nm and 7.6 nm, respectively. Panels a, b, and c adapted with permission from References , , and , respectively.

Similar articles

Cited by

References

    1. Cleland AN. Foundations of Nanomechanics: From Solid-State Theory to Device Applications. New York: Springer; 2002.
    1. Lin DC, Horkay F. Nanomechanics of polymer gels and biological tissues: a critical review of analytical approaches in the Hertzian regime and beyond. Soft Matter. 2008;4:669–682. - PubMed
    1. Leckband D, Israelachvili J. Intermolecular forces in biology. Q. Rev. Biophys. 2001;34:105–267. - PubMed
    1. Israelachvili JN. Intermolecular and Surface Forces. London: Academic; 1992.
    1. Bao G, Suresh S. Cell and molecular mechanics of biological materials. Nat. Mater. 2003;2:715–725. - PubMed

LinkOut - more resources