. 2012 Jul;8(7):e1002784.
doi: 10.1371/journal.pgen.1002784. Epub 2012 Jul 5.

Comparative genomics of plant-associated Pseudomonas spp.: insights into diversity and inheritance of traits involved in multitrophic interactions

Affiliations

Comparative genomics of plant-associated Pseudomonas spp.: insights into diversity and inheritance of traits involved in multitrophic interactions

Joyce E Loper et al. PLoS Genet. 2012 Jul.

Abstract

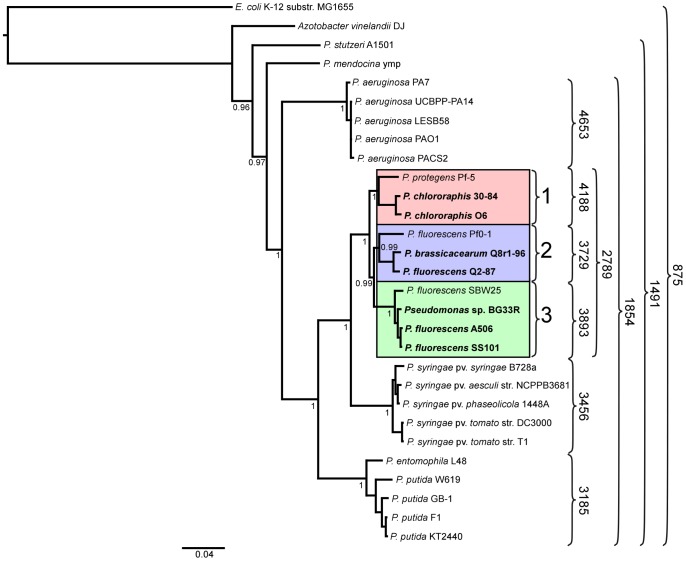
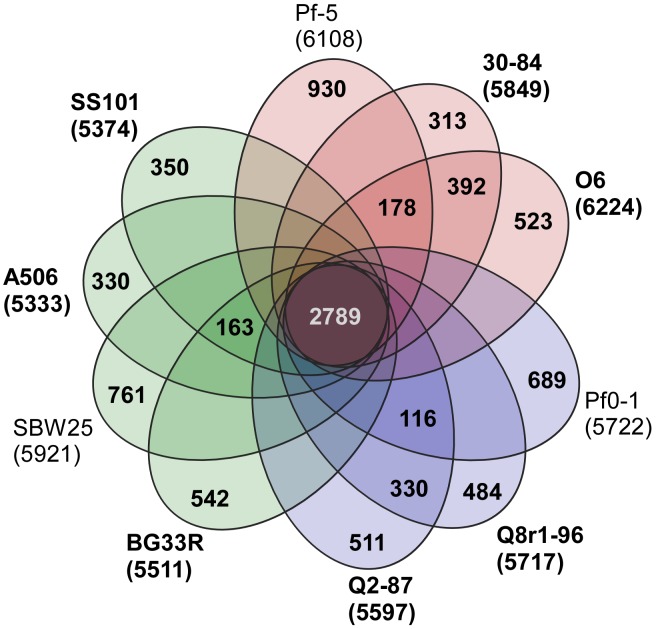
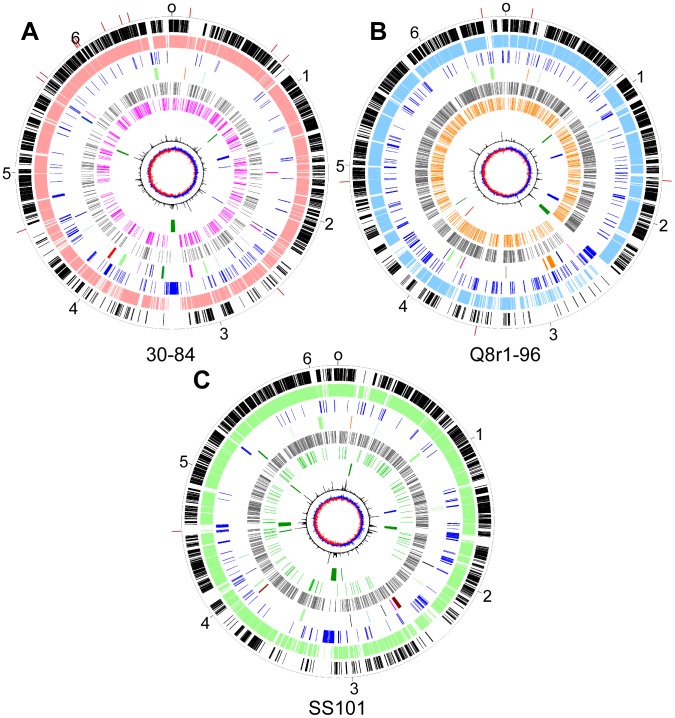
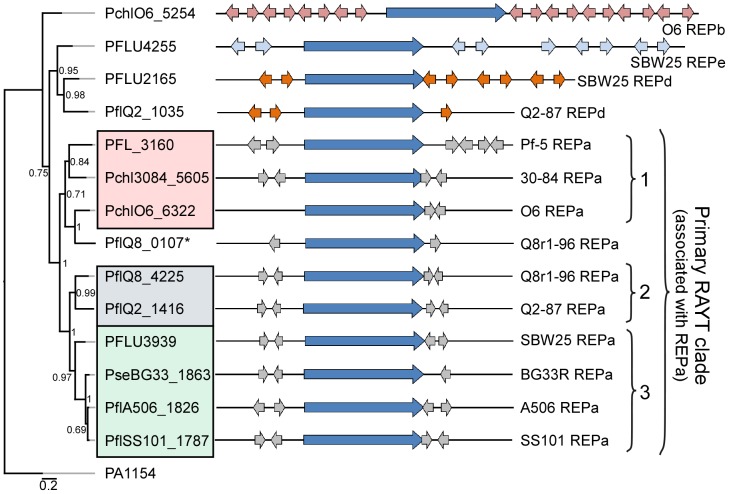
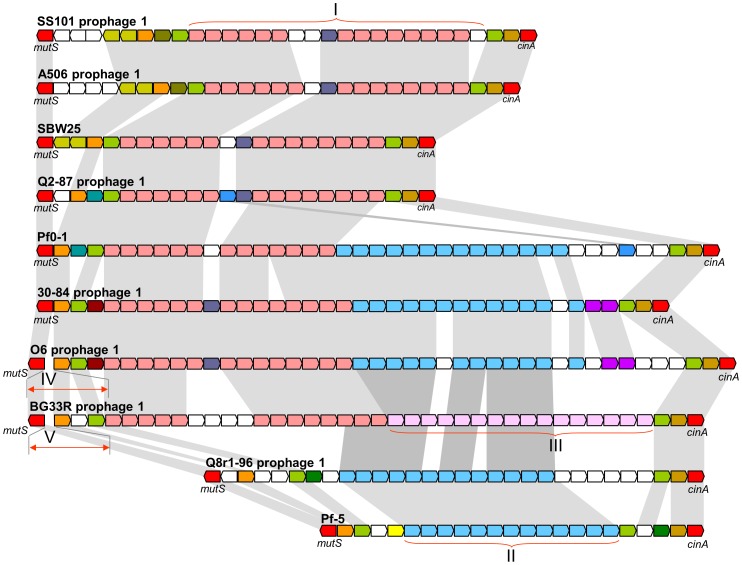
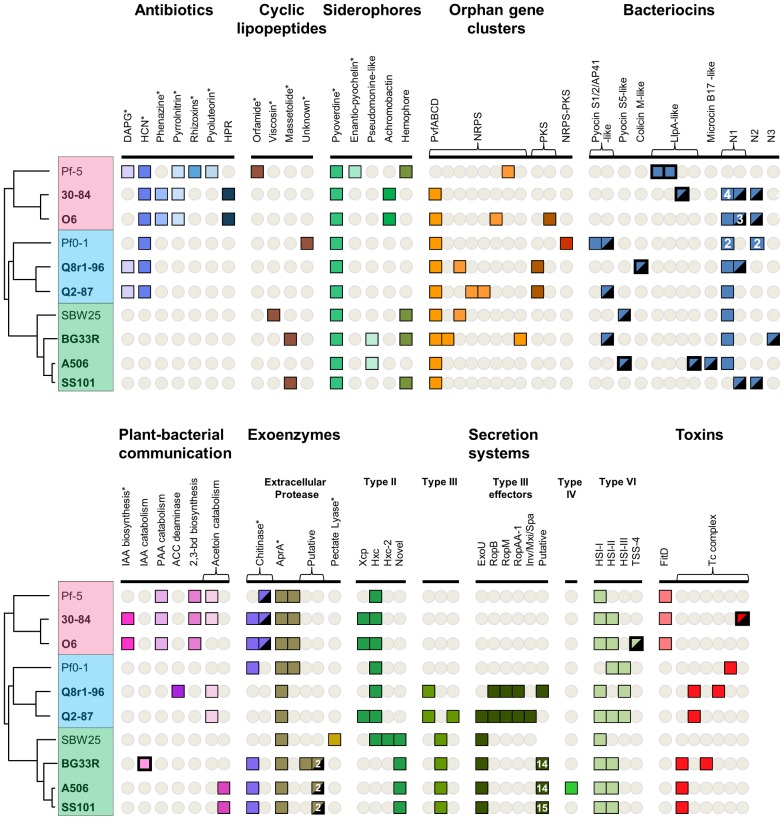
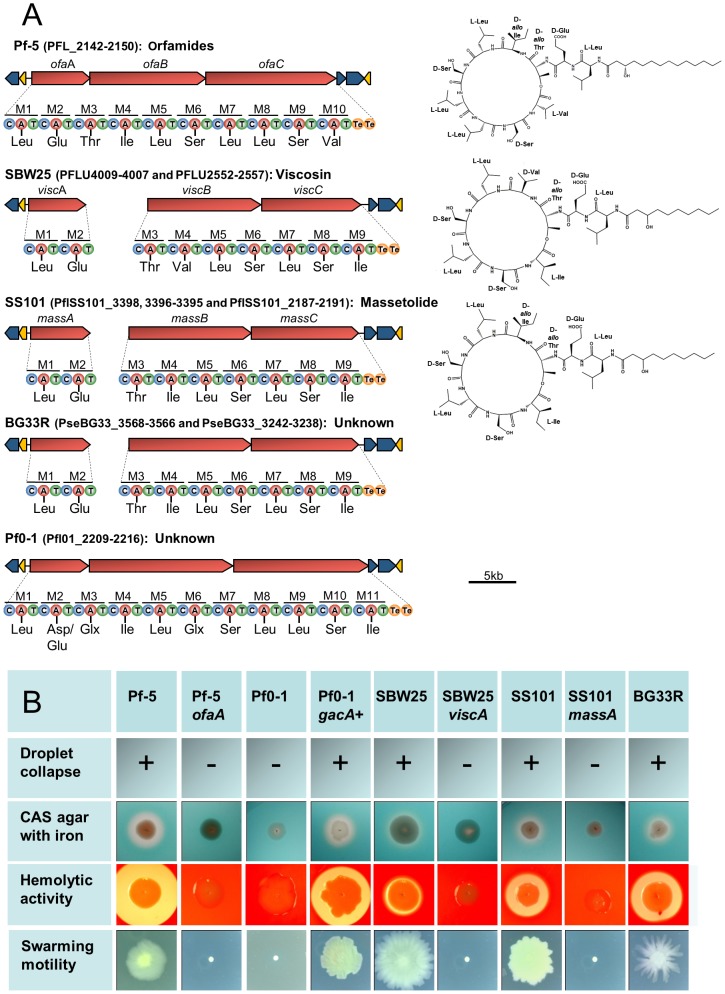
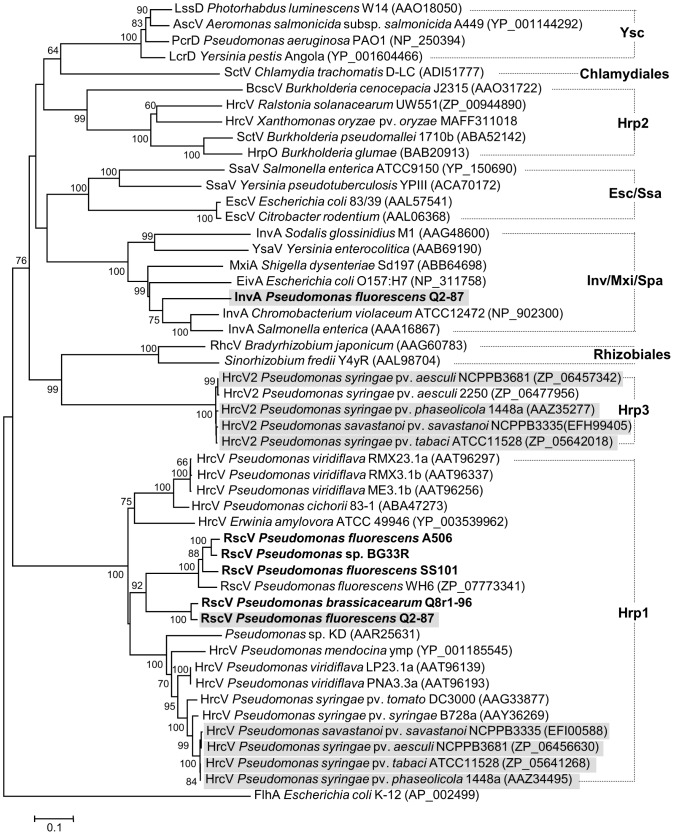
We provide here a comparative genome analysis of ten strains within the Pseudomonas fluorescens group including seven new genomic sequences. These strains exhibit a diverse spectrum of traits involved in biological control and other multitrophic interactions with plants, microbes, and insects. Multilocus sequence analysis placed the strains in three sub-clades, which was reinforced by high levels of synteny, size of core genomes, and relatedness of orthologous genes between strains within a sub-clade. The heterogeneity of the P. fluorescens group was reflected in the large size of its pan-genome, which makes up approximately 54% of the pan-genome of the genus as a whole, and a core genome representing only 45-52% of the genome of any individual strain. We discovered genes for traits that were not known previously in the strains, including genes for the biosynthesis of the siderophores achromobactin and pseudomonine and the antibiotic 2-hexyl-5-propyl-alkylresorcinol; novel bacteriocins; type II, III, and VI secretion systems; and insect toxins. Certain gene clusters, such as those for two type III secretion systems, are present only in specific sub-clades, suggesting vertical inheritance. Almost all of the genes associated with multitrophic interactions map to genomic regions present in only a subset of the strains or unique to a specific strain. To explore the evolutionary origin of these genes, we mapped their distributions relative to the locations of mobile genetic elements and repetitive extragenic palindromic (REP) elements in each genome. The mobile genetic elements and many strain-specific genes fall into regions devoid of REP elements (i.e., REP deserts) and regions displaying atypical tri-nucleotide composition, possibly indicating relatively recent acquisition of these loci. Collectively, the results of this study highlight the enormous heterogeneity of the P. fluorescens group and the importance of the variable genome in tailoring individual strains to their specific lifestyles and functional repertoire.


Conflict of interest statement

The authors have declared that no competing interests exist.

Figures

Figure 1
Figure 1. Phylogenetic tree depicting the relationships of sequenced strains of Pseudomonas spp.
The tree is based on concatenated alignments of ten core housekeeping genes: acsA, aroE, dnaE, guaA, gyrB, mutL, ppsA, pyrC, recA, and rpoB, and was generated using the MrBayes package . The interior node values of the tree are clade credibility values, which represent the likelihood of the clade existing, based on the posterior probability values produced by MrBayes. Strains in the P. fluorescens group fall within a single clade comprised of three sub-clades, which are numbered 1 to 3 and highlighted pink, blue and green, respectively. Strains sequenced in this study are in bold font. Numbers on the right of the figure represent the size of the core genome of the strains included within the curved brackets.
Figure 2
Figure 2. Genomic diversity of strains in the P. fluorescens group.
Each strain is represented by an oval that is colored according to sub-clade (as in Figure 1). The number of orthologous coding sequences (CDSs) shared by all strains (i.e., the core genome) is in the center. Overlapping regions show the number of CDSs conserved only within the specified genomes. Numbers in non-overlapping portions of each oval show the number of CDSs unique to each strain. The total number of protein coding genes within each genome is listed below the strain name. Strains sequenced in this study are in bold font.
Figure 3
Figure 3. Circular genome diagrams of representative strains from each of three sub-clades in the P. fluorescens group.
P. chlororaphis 30-84, Sub-clade 1 (A); P. brassicacearum Q8r1-96, Sub-clade 2 (B), and; P. fluorescens SS101, Sub-clade 3 (C). The outer scales designate the coordinates (in Mb) and the red marks indicate the boundaries of scaffolds. The first (outer-most) circles show the core genes shared across P. aeruginosa, P. syringae, P. putida and the P. fluorescens group (black). The second circles show the core genes conserved within each respective sub-clade (Sub-clade 1, pink; Sub-clade 2, blue, and; Sub-clade 3, green). The third circles show genes unique to each strain (blue). The fourth circles show the locations of genes or gene clusters coding for the production of antibiotics (blue), cyclic lipopeptides (brown), siderophores (dark green), orphan clusters (orange), bacteriocins (light blue), plant communication (magenta), exoenzymes (black), secretion systems (light green) or insect toxins (red). The fifth and sixth circles show the positions of repetitive extragenic palindromic elements; REPa (grey), REPb (magenta), REPc (green) and REPd (orange, in Q8r1-96 using the REP HMM trained on SBW25 sequences). The seventh circles show the locations of putative mobile genetic elements; genomic islands (dark green), prophage (blue) and transposons (red). The eighth circles show the trinucleotide content (black lines) and the ninth circles show the GC-skew.
Figure 4
Figure 4. Repeated extragenic palindromic (REP) elements and REP–associated tyrosine transposases (RAYTs) of the P. fluorescens group.
The left panel shows a phylogenetic tree, generated using the MrBayes package , depicting the relationships between RAYT proteins identified within each strain of the P. fluorescens group. The interior node values of the tree are clade credibility values, which represent the likelihood of the clade existing, based on the posterior probability values produced by MrBayes. The locus tags for primary RAYT proteins are shaded according to sub-clade using the color scheme of Figure 1; locus tags for secondary RAYT proteins are not shaded. The second primary RAYT in Q8r1-96 is within PflQ8_0107, in a separate reading frame. The right panel shows schematic representations of the RAYT genes (dark blue arrows) and the locations of associated flanking REP elements (REPa sequences in grey; REPd in orange; and REPe in light blue). The P. aeruginosa RAYT protein encoded by PA1154 is used as an outgroup, since this RAYT protein was shown previously to fall within a clade separate from the P. fluorescens RAYT proteins .
Figure 5
Figure 5. Comparative organization of prophages in the mutS-cinA region of ten genomes of the P. fluorescens group.
Predicted genes and their orientation are shown by arrows. The conserved housekeeping genes mutS and cinA are colored red, whereas strain-specific genes are colored white. Homologous prophage genes are indicated by other colors and connected with grey shading. Roman numerals correspond to conserved blocks of bacteriophage genes shared among strains. The size of genes and intergenic regions are not to scale.
Figure 6
Figure 6. Selected biosynthetic/catabolic genes or gene clusters in the sequenced strains of the P. fluorescens group.
Colored boxes represent the presence of a gene or gene cluster within a genome, while absence of a cluster is represented by a grey circle; numbers within a box represent the number of copies of a gene or cluster within a genome. Putative T3SS effectors were not examined for SBW25, therefore no box or circle is present in that column for SBW25. Genes within a mobile genetic element have the box outline bolded; genes within regions of atypical trinucleotide content have half of their boxes blackened. Plant-bacterial communication gene clusters are composed of: iaaMH (IAA biosynthesis); iacR, an ABC transporter, and iacHABICDEFG (IAA catabolism); paaCYBDFGHIJKWLN (PAA catabolism); acdS (ACC deaminase); budC/ydjL+ilvBN (2,3-butanediol biosynthesis); acoRABC+acoX+bdh (light pink, acetoin catabolism); acoRABC+budC (dark pink, acetoin catabolism). Abbreviations are as follows: 2,4-diacetylphloroglucinol (DAPG); hydrogen cyanide (HCN); derivatives of rhizoxin (Rhizoxins); 2-hexyl-5-propyl-alkylresorcinol (HPR); non-ribosomal peptide synthetase (NRPS); polyketide synthase (PKS); novel groups 1–3, respectively, of the carocin- and pyocin-like bacteriocins found in these strains (N1, N2, N3); indole-3-acetic acid (IAA); phenylacetic acid (PAA); aminocyclopropane-1-carboxylic acid (ACC); type VI secretion systems found within virulence loci HSI-I, HSI-II, and HSI-III, respectively, of P. aeruginosa (HSI-I, II, II); TSS-4 from Burkholderia pseudomallei (TSS-4). Asterisks indicate that the expected phenotype is known to be expressed or was detected in this study by the strains having the indicated genes or gene clusters.
Figure 7
Figure 7. Biosynthetic gene clusters, predicted structures, and phenotypes associated with cyclic lipopeptide (CLP) production by strains in the P. fluorescens group.
(A) Organization of the clusters and predicted amino acid composition of the CLP peptide chains in five genomes. NRPSs (red arrows) have nine to eleven modules (M1-M11) each containing a condensation (C), adenylation (A), and thiolation (T) domain, with two thioesterase domains (Te) at the terminus. Amino acids predicted to be incorporated into the CLP peptide are shown beneath each adenylation domain. Structures of orfamide A , viscosin , and massetolide are shown to the right of the corresponding gene clusters. The organization of the biosynthetic clusters, which include genes encoding LysR regulators (yellow arrows) and efflux proteins (blue arrows), is similar among the genomes. (B) Phenotypes associated with CLP production. Strains Pf-5, SBW25, SS101 and BG33R, which have CLP biosynthetic clusters, exhibited surfactant activity, determined by a droplet collapse assay; produced zones on CAS agar containing 0.1 mM FeCl3; expressed hemolytic activity; and exhibited swarming motility. Mutants deficient in CLP biosynthesis (Pf-5 ofaA, SBW25 viscA, and SS101 massA) did not express these phenotypes. The four phenotypes also were expressed by a derivative of Pf0-1 containing the gacA+ gene from Pf-5, but not by Pf0-1 or a derivative containing the gacS+ gene from Pf-5 (data not shown).
Figure 8
Figure 8. Neighbor-joining phylogeny inferred from aligned amino acid sequences of Hrc(Rsc)V proteins.
Pseudomonas strains with genomes sequenced in this study are highlighted in boldface, whereas strains carrying two different type III secretion systems are shaded in gray. GenBank accession numbers are shown in brackets. Families of T3SSs are labeled according to Troisfontaines and Cornelis . Flagellar export pore protein FlhA from E. coli was used as an outgroup. Indels were ignored during analyses. Evolutionary distances for Hrc(Rsc)V proteins were estimated using the Jones-Taylor-Thornton (JTT) model of amino acid substitution. Bootstrap values equal to or greater than 60% are shown, and the scale bar represents the number of substitutions per site. Branch lengths are proportional to the amount of evolutionary change.

Similar articles

Cited by

References

    1. Wu X, Monchy S, Taghavi S, Zhu W, Ramos J, et al. Comparative genomics and functional analysis of niche-specific adaptation in Pseudomonas putida. FEMS Microbiol Rev. 2010;35:299–323. - PMC - PubMed
    1. Lessie TG, Phibbs PV., Jr Alternative pathways of carbohydrate utilization in Pseudomonads. Annu Rev Microbiol. 1984;38:359–388. - PubMed
    1. Gross H, Loper JE. Genomics of secondary metabolite production by Pseudomonas spp. Nat Prod Rep. 2009;26:1408–1446. - PubMed
    1. Raaijmakers JM, Vlami M, de Souza JT. Antibiotic production by bacterial biocontrol agents. Antonie Van Leeuwenhoek. 2002;81:537–547. - PubMed
    1. Bender CL, Alarcón-Chaidez F, Gross DC. Pseudomonas syringae phytotoxins: mode of action, regulation, and biosynthesis by peptide and polyketide synthases. Microbiol Mol Biol Rev. 1999;63:266–292. - PMC - PubMed

Publication types

MeSH terms