. 2012 Jul;8(7):e1002810.
doi: 10.1371/journal.pgen.1002810. Epub 2012 Jul 5.

Gene conversion occurs within the mating-type locus of Cryptococcus neoformans during sexual reproduction

Affiliations

Gene conversion occurs within the mating-type locus of Cryptococcus neoformans during sexual reproduction

Sheng Sun et al. PLoS Genet. 2012 Jul.

Abstract

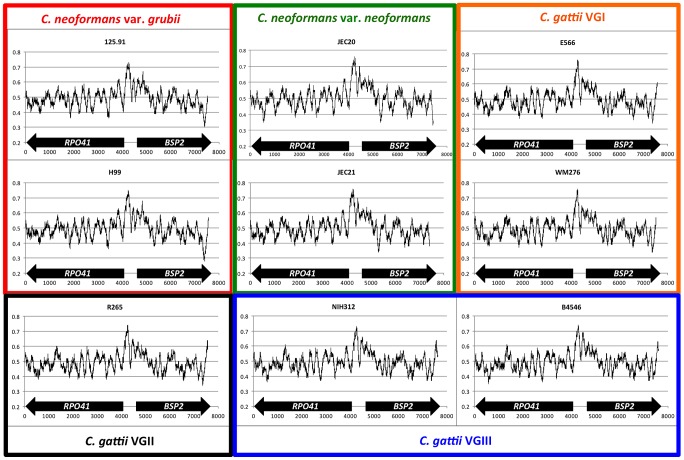
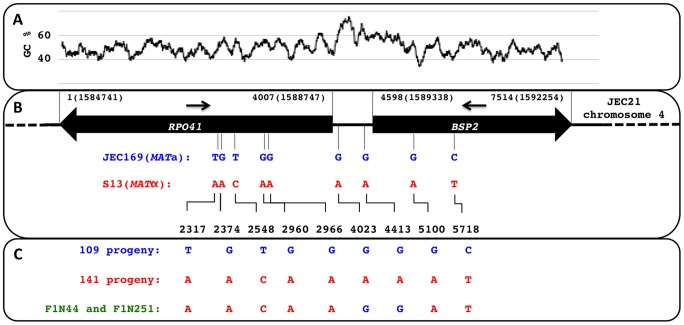
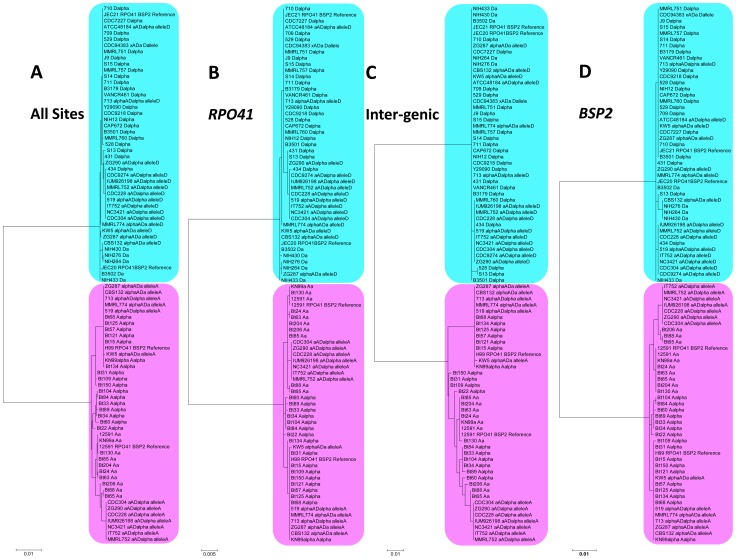
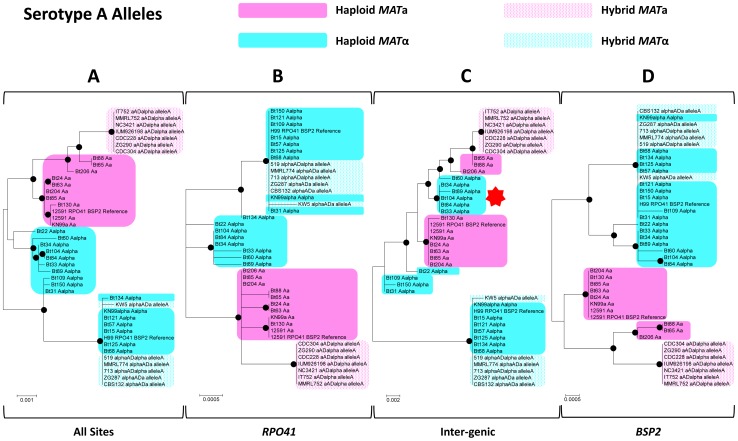
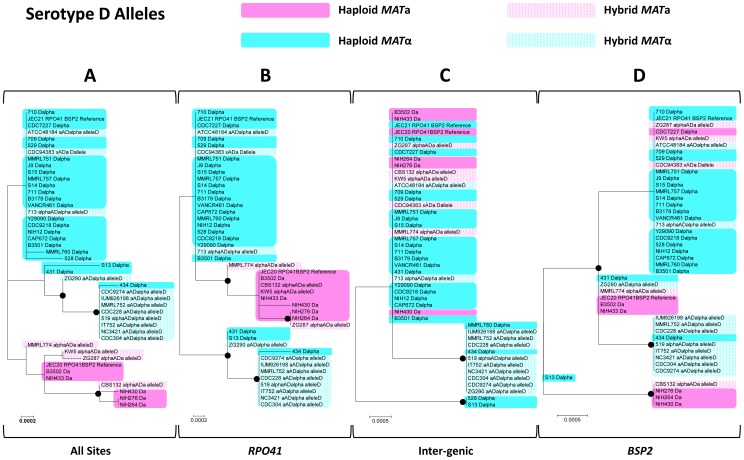
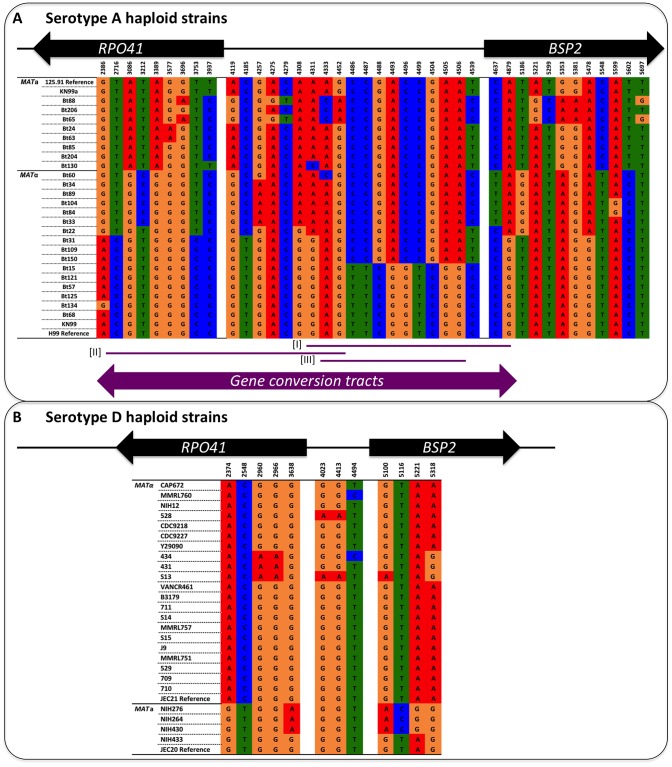
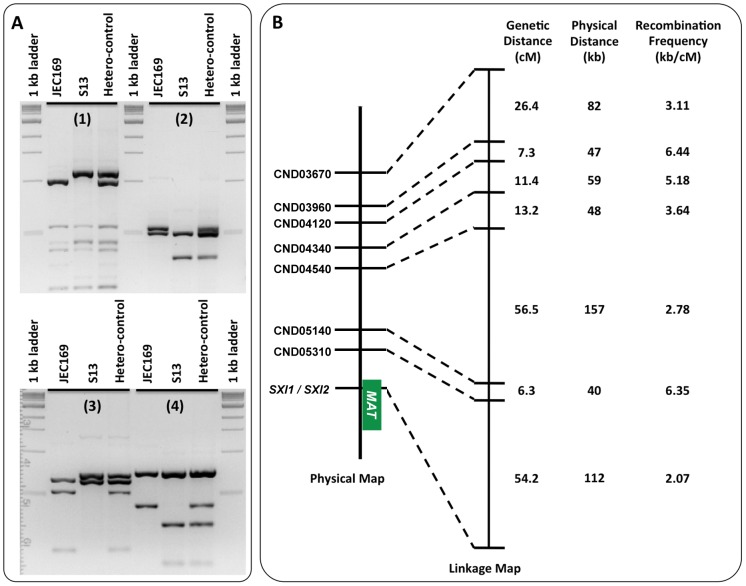
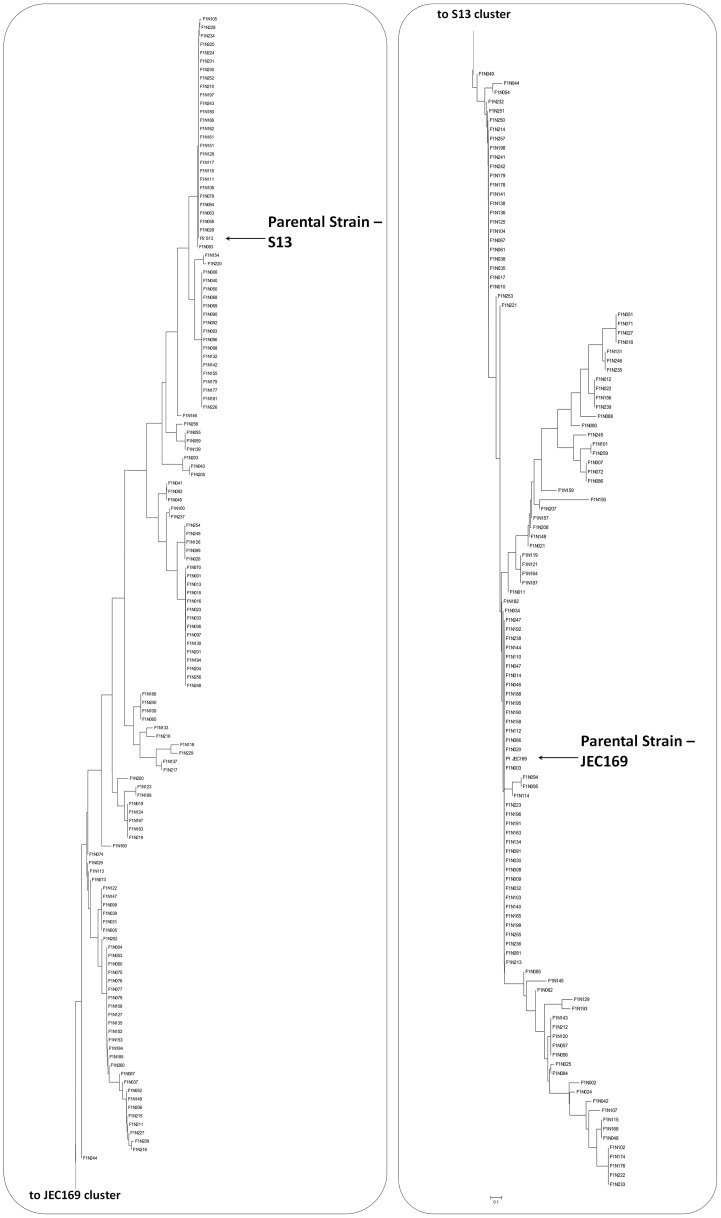
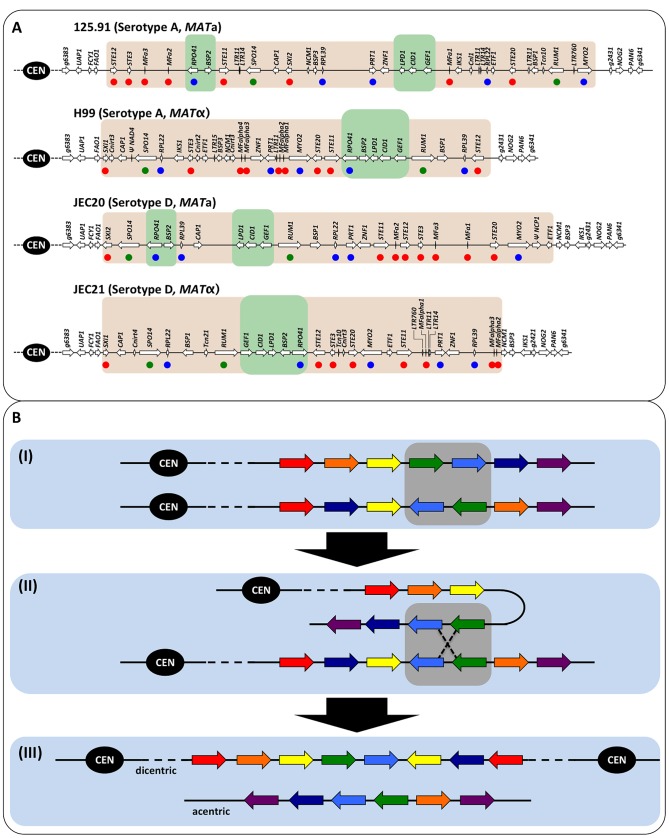
Meiotic recombination of sex chromosomes is thought to be repressed in organisms with heterogametic sex determination (e.g. mammalian X/Y chromosomes), due to extensive divergence and chromosomal rearrangements between the two chromosomes. However, proper segregation of sex chromosomes during meiosis requires crossing-over occurring within the pseudoautosomal regions (PAR). Recent studies reveal that recombination, in the form of gene conversion, is widely distributed within and may have played important roles in the evolution of some chromosomal regions within which recombination was thought to be repressed, such as the centromere cores of maize. Cryptococcus neoformans, a major human pathogenic fungus, has an unusually large mating-type locus (MAT, >100 kb), and the MAT alleles from the two opposite mating-types show extensive nucleotide sequence divergence and chromosomal rearrangements, mirroring characteristics of sex chromosomes. Meiotic recombination was assumed to be repressed within the C. neoformans MAT locus. A previous study identified recombination hot spots flanking the C. neoformans MAT, and these hot spots are associated with high GC content. Here, we investigated a GC-rich intergenic region located within the MAT locus of C. neoformans to establish if this region also exhibits unique recombination behavior during meiosis. Population genetics analysis of natural C. neoformans isolates revealed signals of homogenization spanning this GC-rich intergenic region within different C. neoformans lineages, consistent with a model in which gene conversion of this region during meiosis prevents it from diversifying within each lineage. By analyzing meiotic progeny from laboratory crosses, we found that meiotic recombination (gene conversion) occurs around the GC-rich intergenic region at a frequency equal to or greater than the meiotic recombination frequency observed in other genomic regions. We discuss the implications of these findings with regards to the possible functional and evolutionary importance of gene conversion within the C. neoformans MAT locus and, more generally, in fungi.


Conflict of interest statement

The authors have declared that no competing interests exist.

Figures

Figure 1
Figure 1. Sliding window analyses of GC content of the regions encompassing RPO41, intergenic region, and BSP2 in C. neoformans and C. gattii.
For each figure, the Y axis is the GC%, while the X axis indicates the relative distance (bp) from the 3′ end of the RPO41 gene. Sequences from the MAT a and MATα reference strains of the same variety (as in C. neoformans) or the same molecular group (as in C. gattii) are grouped together by rectangles of different colors. The size of the sliding window was 200 bp.
Figure 2
Figure 2. Distribution of polymorphic sites between the two parental strains and the genotypes identified among the meiotic progeny.
(A) Illustration of the distribution of GC content along the region encompassing the RPO41 and BSP2 genes, as well as the intergenic region between the two genes. (B) Positions of the nine polymorphic sites present within the sequenced region between the two strains, JEC169 (MAT a) and S13 (MATα), which were used in the laboratory cross to generate meiotic progeny. The two arrows indicate the approximate locations of the forward and reverse primers used to amplify this region from both natural isolates and progeny generated by laboratory cross. (C) Summary of the genotypes identified among 255 meiotic progeny based on the above mentioned nine polymorphic sites.
Figure 3
Figure 3. Phylogenetic trees of alleles existing in natural C. neoformans isolates based on the sequenced RPO41-intergenic-BSP2 region.
Phylogenetic trees were constructed using maximum likelihood methods with 1000 bootstraps. Alleles shaded with pink color were all serotype A (from both haploid and hybrid isolates), while alleles shaded with blue color were all serotype D (from both haploid and hybrid isolates). A) Sequences from the entire RPO41-intergenic-BSP2 region were analyzed. B) Only sequences within the gene RPO41 were used. C) Only sequences within the intergenic region were studied. D) Only sequences within the gene BSP2 were subjected to analysis.
Figure 4
Figure 4. Phylogenetic trees of serotype A alleles existing in natural C. neoformans isolates based on the sequenced RPO41-intergenic-BSP2 region.
Phylogenetic trees based on whole sequences (A), sequences corresponding to the RPO41 gene (B), the intergenic regions (C), and the BSP2 gene (D) were constructed using the maximum likelihood method with 1000 bootstrap replications. Black dots indicate the nodes supported by bootstrap values of 75 or higher. Solid and dotted pink shades highlight MAT a alleles from haploid and hybrid isolates, respectively. Solid and dotted blue shades highlight MATα alleles from haploid and hybrid isolates, respectively. The red star in section (C) highlights the group of haploid MATα alleles that clustered together with MAT a alleles.
Figure 5
Figure 5. Phylogenetic trees of serotype D alleles existing in natural C. neoformans isolates based on the sequenced RPO41-intergenic-BSP2 region.
Phylogenetic trees based on whole sequences (A), sequences corresponding to the RPO41 gene (B), the intergenic regions (C), and the BSP2 gene (D) were constructed using the maximum likelihood method with 1000 bootstrap replications. Black dots indicate the nodes supported by bootstrap values of 75 or higher. As in Figure 4, solid and dotted pink shades highlight MAT a alleles from haploid and hybrid isolates, respectively, while solid and dotted blue shades highlight MATα alleles from haploid and hybrid isolates, respectively.
Figure 6
Figure 6. Illustration of polymorphic sites among serotype A and D haploid strains.
The positions of the polymorphic sites are shown at the top, and they correspond to the distances of the sites from the 3′ end of the RPO41 gene (see also Figure 2). For simplicity, only parsimony informative sites are shown here. (A) Serotype A strains. Sites from 2386 to 3937 are located within the RPO41 gene, sites from 4119 to 4539 are located within the intergenic region, while sites from 4637 to 5697 are located within the BSP2 gene. The purple lines and arrow at the bottom indicate locations and lengths of gene conversion tracts detected by GENECONV software. Examples of strain pairs from which the three gene conversion tracts were detected are: Bt22-Bt150 for tract [I], Bt109-Bt125 for tract [II], and Bt60-Bt31 for tract [III]. (B) Serotype D strains. Sites from 2374 to 3638 are located within the RPO41 gene, sites from 4023 to 4494 are located within the intergenic region, while sites from 5100 to 5318 are located within the BSP2 gene.
Figure 7
Figure 7. Meiotic recombination frequencies in chromosomal regions proximal to the MAT locus.
(A) Examples of the co-dominant PCR-RFLP markers used to construct the genetic linkage map of the meiotic progeny shown in Figure 7B. Shown here are the gel separations of the restriction enzyme digestion products of markers CND05310 (A1), CND04540 (A2), CND03960 (A3), and CND04340 (A4). For each marker, from left to right, are the digestions of PCR products using genomic DNA of JEC169, S13, and a mixture of JEC169 and S13 (heterozygous control) as templates, respectively. (B) On the left is the physical map of the eight genetic markers on strain JEC20/JEC21 chromosome 4. The green block indicates the position of the MAT locus. In the middle is the genetic linkage map constructed using the PCR-RFLP data listed in Table 3 and Table S2. The three columns on the right list the genetic distances between adjacent markers, the physical distances between adjacent markers, and the corresponding recombination frequencies (high kb/cM value indicates low recombination frequency).
Figure 8
Figure 8. Genetic diversity among meiotic progeny from the laboratory cross between strains JEC169 and S13.
The tree was constructed using the Neighbor-Joining method based on the PCR-RFLP data listed in Table 3 and Table S2. The two parental strains are highlighted by the arrows.
Figure 9
Figure 9. Diagrams of the MAT loci of C. neoformans var. grubii and var. neoformans and illustration of meiotic recombination within inverted chromosomal region.
(A) Regions shaded in gray indicate the MAT loci. Green shading indicates the gene clusters, within which the RPO41 and BSP2 genes are located, and which have been hypothesized to be the most recent strata that was recruited into the MAT locus. Red dots denote the genes involved in mating and/or meiosis, green dots indicate hypothetical meiotic genes, and blue dots highlight known essential genes. (B) The black circle labeled “CEN” is the centromere. The seven arrows with different colors indicate seven different genes. The balanced composition of each chromosome at these seven genes is indicated by the presence of one gene of each of the seven colors (e.g., the two chromosomes in (I)). Gray shading highlights the two genes, green and blue, that are inverted. (I) The two chromatids involved in meiotic recombination are shown. (II) Inverted chromosomal regions align during meiosis, and meiotic recombination occurs within the inverted region. (III) Meiotic recombination within the inverted chromosomal region results in two chromosomes that are imbalanced in their gene compositions, and are acentric and dicentric, respectively.

Similar articles

Cited by

References

    1. Malkova A, Swanson J, German M, McCusker JH, Housworth EA, et al. Gene conversion and crossing over along the 405-kb left arm of Saccharomyces cerevisiae chromosome VII. Genetics. 2004;168:49–63. - PMC - PubMed
    1. Copenhaver GP, Housworth EA, Stahl FW. Crossover interference in Arabidopsis. Genetics. 2002;160:1631–1639. - PMC - PubMed
    1. Haubold B, Kroymann J, Ratzka A, Mitchell-Olds T, Wiehe T. Recombination and gene conversion in a 170-kb genomic region of Arabidopsis thaliana. Genetics. 2002;161:1269–1278. - PMC - PubMed
    1. Hilliker AJ, Clark SH, Chovnick A. The effect of DNA sequence polymorphisms on intragenic recombination in the rosy locus of Drosophila melanogaster. Genetics. 1991;129:779–781. - PMC - PubMed
    1. Frisse L, Hudson RR, Bartoszewicz A, Wall JD, Donfack J, et al. Gene conversion and different population histories may explain the contrast between polymorphism and linkage disequilibrium levels. The American Journal of Human Genetics. 2001;69:831–843. - PMC - PubMed

Publication types

Substances

Associated data