. 2012;7(7):e39884.
doi: 10.1371/journal.pone.0039884. Epub 2012 Jul 6.

Following ligand migration pathways from picoseconds to milliseconds in type II truncated hemoglobin from Thermobifida fusca

Affiliations

Following ligand migration pathways from picoseconds to milliseconds in type II truncated hemoglobin from Thermobifida fusca

Agnese Marcelli et al. PLoS One. 2012.

Abstract

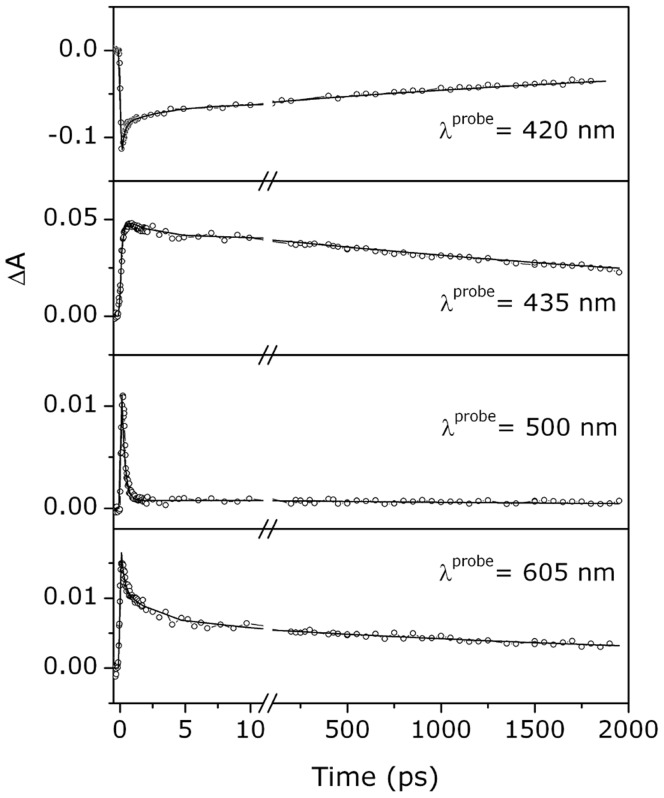
CO recombination kinetics has been investigated in the type II truncated hemoglobin from Thermobifida fusca (Tf-trHb) over more than 10 time decades (from 1 ps to ∼100 ms) by combining femtosecond transient absorption, nanosecond laser flash photolysis and optoacoustic spectroscopy. Photolysis is followed by a rapid geminate recombination with a time constant of ∼2 ns representing almost 60% of the overall reaction. An additional, small amplitude geminate recombination was identified at ∼100 ns. Finally, CO pressure dependent measurements brought out the presence of two transient species in the second order rebinding phase, with time constants ranging from ∼3 to ∼100 ms. The available experimental evidence suggests that the two transients are due to the presence of two conformations which do not interconvert within the time frame of the experiment. Computational studies revealed that the plasticity of protein structure is able to define a branched pathway connecting the ligand binding site and the solvent. This allowed to build a kinetic model capable of describing the complete time course of the CO rebinding kinetics to Tf-trHb.


Conflict of interest statement

Competing Interests: The authors have declared that no competing interests exist.

Figures

Figure 1
Figure 1. Transient absorption spectra.
Top: Steady-state absorption spectra of the CO complex of the Tf-trHb (red line) and the ferrous 5c-protein (black line). The protein concentration is 36 µM (2 mm path length cell). Bottom: Transient absorption spectra of the CO complex of the Tf-trHb excited at 400 nm with femtosecond pulses (energy = 0.5 µJ): at 200 fs (green line), at 1 ps (blue line) and at 40 ps (cyan line) delay times. The latter is perfectly overlapped with the scaled steady-state difference spectrum between the CO and the ferrous 5-c spectra (magenta line). B: Bleaching; ESA: excited state absorption. Inset: transient absorption spectra from 40 ps until 1.5 ns. The time evolution of the signal is shown by the arrows.
Figure 2
Figure 2. Kinetic profiles at single wavelength.
Transient absorbance of the CO complex of the Tf-trHb as a function of the delay time after excitation at 400 nm with femtosecond pulses. Solid lines are the results of the fitting to a multiexponential decay, as reported in Table 1.
Figure 3
Figure 3. Laser flash photolysis data.
Top: CO rebinding kinetics to Tf-trHb in solution equilibrated with 1 (black line) and 0.1 (red line) atm CO. T = 20°C; λ = 435 nm. Bottom: Lifetime distributions associated with the rebinding kinetics in the top panel. Protein concentration is 38 µM (2 mm path-length).
Figure 4
Figure 4. Complete rebinding kinetics.
Top: Merging rebinding curves measured in TA and LFP experiments: fraction of the 5c-protein - N(t) = ΔA(t)/ΔA(t0) - as a function of the delay time after excitation. In the inset the experimental profile recorded at early delay times after photolysis with ns laser pulses (open circles) is reported in comparison with the convolution result (red solid line). The kinetic trace in the first 20 ns is affected by the instrumental function. Bottom: Lifetime distributions associated with the rebinding kinetics in the top panel.
Figure 5
Figure 5. Laser-induced optoacoustic spectroscopy data.
Left: LIOAS signals of a 10−5 M Tf-trHb solution in phosphate buffer at 0.1 M ionic strength (continuous line) and of a calorimetric reference solution at 20°C (upper panel) and at 10°C (lower panel). A vertical line marks the first maximum of the reference signal at 10°C to highlight the time shift of the sample signal. Right: (upper panel) Plot of the decay amplitudes φi - multiplied by the laser energy Eλ - for the prompt (full circles) and the slow (hollow circles) components of the LIOAS signals vs the thermoelastic parameter ratio Cpρ/β. Linear least-square fittings are superimposed on the data. (lower panel) Eyring plots for the prompt (full circles) and the slow (hollow circles) components. Activation enthalpies ΔH and entropies ΔS are estimated for each rate constant ki in the investigated temperature range, according to the equation: ln(hki/k B T) )  =  ΔS /R – ΔH /RT, where R is the gas constant, h is the Planck constant, and k B is the Boltzmann constant.
Figure 6
Figure 6. Distal site cavities.
Representations of the heme distal pocket, the tunnel and cavity system. Two spatial conformations (A and B) of TyrCD1 (in red) are depicted, the second one (B) making accessible the (trHb:CO)3 cavity.
Figure 7
Figure 7. Molecular dynamics simulations.
Time evolution of distance between TyrCD1 and TrpG8 side chains along 50 ns MD simulation. Frequency information and swapping configurations of TyrCD1 related with the presence of (trHb:CO)3 can be appreciated (labeled A and B). “A” (∼ 4 Å) corresponds to the conformation depicted in Fig. 6A while “B” (∼ 5.75 Å) corresponds to the conformation showed in Fig. 6B.
Figure 8
Figure 8. Schematic representation of the Tf-trHb structure.
Figure 9
Figure 9. Fitting results.
Results of global analysis of the complete course of CO binding kinetics to Tf-trHb merging ultrafast transient absorption and nanosecond laser flash photolysis data at T = 20°C and 1 (black) and 0.1 atm (red). The fits (green lines) are superimposed to the experimental data (circles).

Similar articles

Cited by

References

    1. Martin JL, Vos MH. Femtosecond biology. Annu Rev Bioph Biomol Struct. 1992;21:199–222. - PubMed
    1. Vos MH, Martin JL. Femtosecond processes in protein. Biochim Biophys Acta. 1999;1411:1–20. - PubMed
    1. Vos MH. Ultrafast dynamics of ligands within heme proteins. Biochim Biophys Acta. 2008;1777:15–31. - PubMed
    1. Ansari A, Jones CM, Henry ER, Hofrichter J, Eaton WA. Conformational relaxation and ligand binding in myoglobin. Biochemistry. 1994;33:5128–5145–2226. - PubMed
    1. Olson JS, Phillips GN., Jr Kinetics pathway and barriers for ligand binding myoglobin. J. Biol. Chem. 2008;271:17593–17596. - PubMed

Publication types