

Harborview burns--1974 to 2009
- PMID: 22792216
- PMCID: PMC3390332
- DOI: 10.1371/journal.pone.0040086
Harborview burns--1974 to 2009
Erratum in
- PLoS One. 2013;8(10). doi:10.1371/annotation/8dffa635-e876-48e1-958a-0016d3618d64
Abstract
Background: Burn demographics, prevention and care have changed considerably since the 1970s. The objectives were to 1) identify new and confirm previously described changes, 2) make comparisons to the American Burn Association National Burn Repository, 3) determine when the administration of fluids in excess of the Baxter formula began and to identify potential causes, and 4) model mortality over time, during a 36-year period (1974-2009) at the Harborview Burn Center in Seattle, WA, USA.
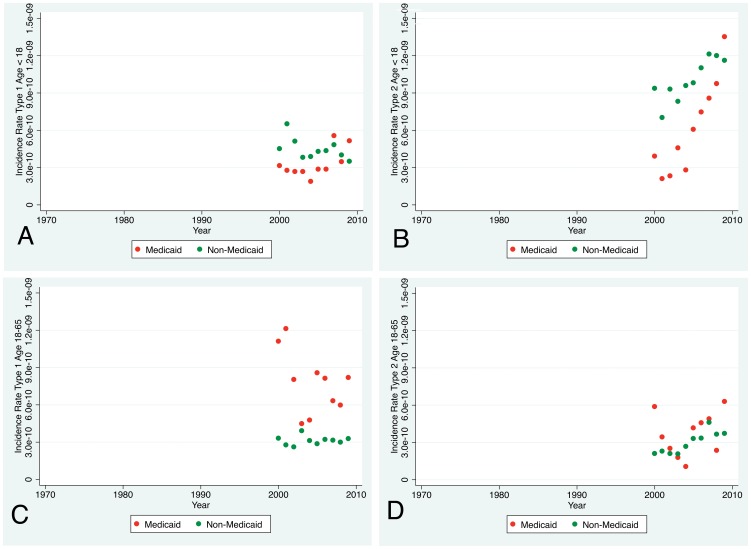
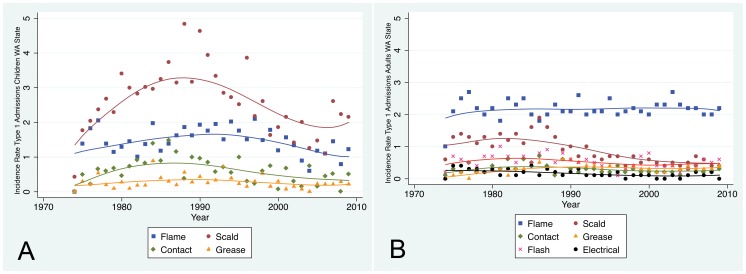
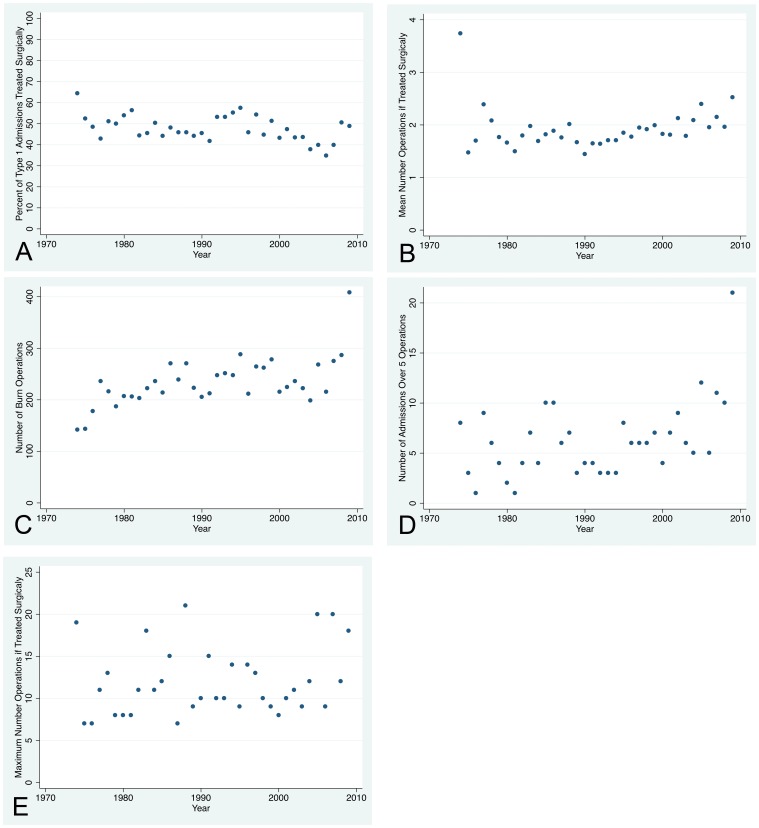
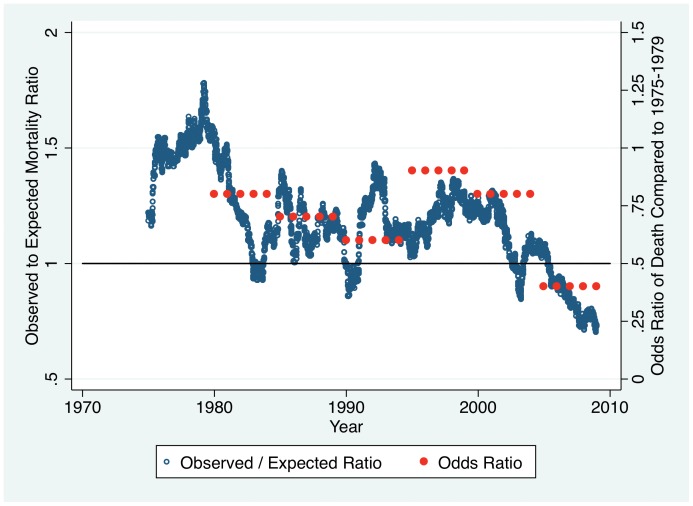
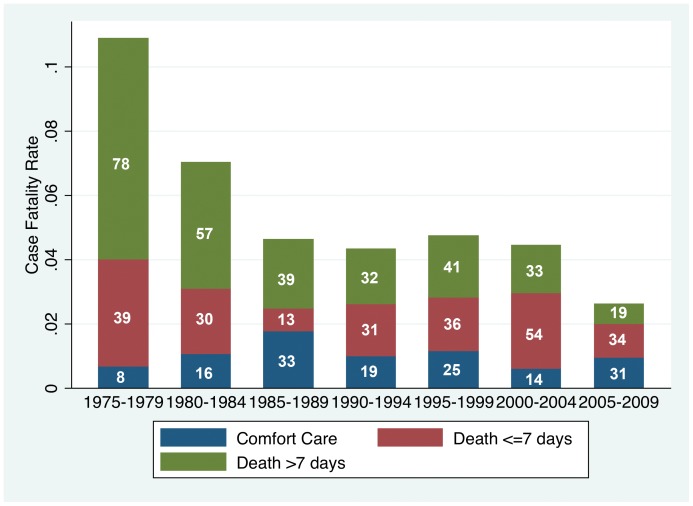
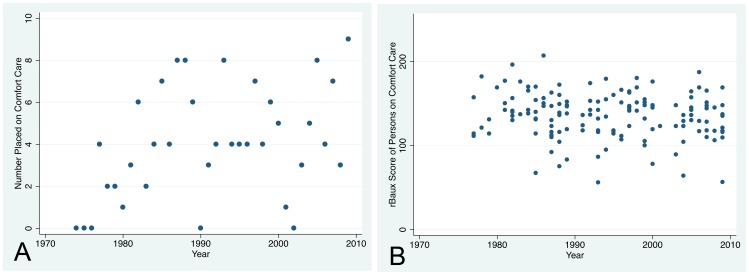
Methods and findings: 14,266 consecutive admissions were analyzed in five-year periods and many parameters compared to the National Burn Repository. Fluid resuscitation was compared in five-year periods from 1974 to 2009. Mortality was modeled with the rBaux model. Many changes are highlighted at the end of the manuscript including 1) the large increase in numbers of total and short-stay admissions, 2) the decline in numbers of large burn injuries, 3) that unadjusted case fatality declined to the mid-1980s but has changed little during the past two decades, 4) that race/ethnicity and payer status disparity exists, and 5) that the trajectory to death changed with fewer deaths occurring after seven days post-injury. Administration of fluids in excess of the Baxter formula during resuscitation of uncomplicated injuries was evident at least by the early 1990s and has continued to the present; the cause is likely multifactorial but pre-hospital fluids, prophylactic tracheal intubation and opioids may be involved.
Conclusions: 1) The dramatic changes include the rise in short-stay admissions; as a result, the model of burn care practiced since the 1970s is still required but is no longer sufficient. 2) Fluid administration in excess of the Baxter formula with uncomplicated injuries began at least two decades ago. 3) Unadjusted case fatality declined to ∼6% in the mid-1980s and changed little since then. The rBaux mortality model is quite accurate.
Conflict of interest statement
Figures
Similar articles
-
A population-based study of the epidemiology of acute adult burn injuries in the Calgary Health Region and factors associated with mortality and hospital length of stay from 1995 to 2004.Burns. 2009 Jun;35(4):572-9. doi: 10.1016/j.burns.2008.10.003. Epub 2009 Feb 8. Burns. 2009. PMID: 19203840
-
Epidemiology of burn injuries in Singapore from 1997 to 2003.Burns. 2005 Jan;31 Suppl 1:S18-26. doi: 10.1016/j.burns.2004.10.005. Burns. 2005. PMID: 15649612
-
Demographics and clinical outcomes of adult burn patients admitted to a single provincial burn centre: A 40-year review.Burns. 2020 Dec;46(8):1958-1967. doi: 10.1016/j.burns.2020.06.020. Epub 2020 Jul 3. Burns. 2020. PMID: 32660831 Review.
-
Burden of burns in Portugal, 2000-2013: A clinical and economic analysis of 26,447 hospitalisations.Burns. 2016 Jun;42(4):891-900. doi: 10.1016/j.burns.2016.01.017. Epub 2016 Apr 29. Burns. 2016. PMID: 27133714
-
[SENTIERI - Epidemiological Study of Residents in National Priority Contaminated Sites. Sixth Report].Epidemiol Prev. 2023 Jan-Apr;47(1-2 Suppl 1):1-286. doi: 10.19191/EP23.1-2-S1.003. Epidemiol Prev. 2023. PMID: 36825373 Italian.
Cited by
-
Patient Reported Experiences at a Swedish National Burn Centre.J Burn Care Res. 2022 Jan 5;43(1):249-255. doi: 10.1093/jbcr/irab091. J Burn Care Res. 2022. PMID: 34131732 Free PMC article.
-
Influential Factors in the Recovery Process of Burn Survivors in a Predominately Rural State: A Qualitative Study.J Burn Care Res. 2022 Mar 23;43(2):374-380. doi: 10.1093/jbcr/irab232. J Burn Care Res. 2022. PMID: 34891162 Free PMC article.
-
Race, area deprivation index, and access to surgical burn care in a pediatric population in North Carolina.Burns. 2023 Sep;49(6):1298-1304. doi: 10.1016/j.burns.2023.01.001. Epub 2023 Jan 16. Burns. 2023. PMID: 36682975 Free PMC article.
-
Division of overall duration of stay into operative stay and postoperative stay improves the overall estimate as a measure of quality of outcome in burn care.PLoS One. 2017 Mar 31;12(3):e0174579. doi: 10.1371/journal.pone.0174579. eCollection 2017. PLoS One. 2017. PMID: 28362844 Free PMC article.
-
Adult Human Dermal Progenitor Cell Transplantation Modulates the Functional Outcome of Split-Thickness Skin Xenografts.Stem Cell Reports. 2019 Dec 10;13(6):1068-1082. doi: 10.1016/j.stemcr.2019.10.011. Epub 2019 Nov 14. Stem Cell Reports. 2019. PMID: 31735655 Free PMC article.
References
-
- Jie X, Ren CB. Burn injuries in the Dong Bei area of China: a study of 12,606 cases. Burns. 1992;18:228–232. - PubMed
-
- Sarma BP, Sarma N. Epidemiology, morbidity, mortality and treatment of burn injuries–a study in a peripheral industrial hospital. Burns. 1994;20:253–255. - PubMed
-
- Turegun M, Sengezer M, Selmanpakoglu N, Celikoz B, Nisanci M. The last 10 years in a burn centre in Ankara, Turkey: an analysis of 5264 cases. Burns. 1997;23:584–590. - PubMed
-
- Davey RB. The changing face of burn care: the Adelaide Children’s Hospital Burn Unit: 1960–1996. Burns. 1999;25:62–68. - PubMed
-
- Rashid A, Khanna A, Gowar JP, Bull JP. Revised estimates of mortality from burns in the last 20 years at the Birmingham Burns Centre. Burns. 2001;27:723–730. - PubMed
Publication types
MeSH terms
Grants and funding
- R43 MD001986/MD/NIMHD NIH HHS/United States
- L60 MD002006/MD/NIMHD NIH HHS/United States
- L60 MD002002/MD/NIMHD NIH HHS/United States
- R44 MD001986/MD/NIMHD NIH HHS/United States
- L60 MD001988/MD/NIMHD NIH HHS/United States
- L60 MD002009/MD/NIMHD NIH HHS/United States
- L60 MD001984/MD/NIMHD NIH HHS/United States
- L60 MD001998/MD/NIMHD NIH HHS/United States
- L60 MD001990/MD/NIMHD NIH HHS/United States
- L60 MD002000/MD/NIMHD NIH HHS/United States
- L60 MD001987/MD/NIMHD NIH HHS/United States
- L60 MD001985/MD/NIMHD NIH HHS/United States
- L60 MD001995/MD/NIMHD NIH HHS/United States
- L60 MD001994/MD/NIMHD NIH HHS/United States
- L60 MD001983/MD/NIMHD NIH HHS/United States
- L60 MD002007/MD/NIMHD NIH HHS/United States
LinkOut - more resources
Full Text Sources
Other Literature Sources
Medical
Miscellaneous
