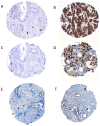
A novel survival-based tissue microarray of pancreatic cancer validates MUC1 and mesothelin as biomarkers
- PMID: 22792233
- PMCID: PMC3391218
- DOI: 10.1371/journal.pone.0040157
A novel survival-based tissue microarray of pancreatic cancer validates MUC1 and mesothelin as biomarkers
Erratum in
- PLoS One. 2012;7(8): doi/10.1371/annotation/2533f354-bbec-404a-9661-2c052963b918
Abstract
Background: One-fifth of patients with seemingly 'curable' pancreatic ductal adenocarcinoma (PDA) experience an early recurrence and death, receiving no definable benefit from a major operation. Some patients with advanced stage tumors are deemed 'unresectable' by conventional staging criteria (e.g. liver metastasis), yet progress slowly. Effective biomarkers that stratify PDA based on biologic behavior are needed. To help researchers sort through the maze of biomarker data, a compendium of ∼2500 published candidate biomarkers in PDA was compiled (PLoS Med, 2009. 6(4) p. e1000046).
Methods and findings: Building on this compendium, we constructed a survival tissue microarray (termed s-TMA) comprised of short-term (cancer-specific death <12 months, n = 58) and long-term survivors (>30 months, n = 79) who underwent resection for PDA (total, n = 137). The s-TMA functions as a biological filter to identify bona fide prognostic markers associated with survival group extremes (at least 18 months separate survival groups). Based on a stringent selection process, 13 putative PDA biomarkers were identified from the public biomarker repository. Candidates were tested against the s-TMA by immunohistochemistry to identify the best markers of tumor biology. In a multivariate model, MUC1 (odds ratio, OR = 28.95, 3+ vs. negative expression, p = 0.004) and MSLN (OR = 12.47, 3+ vs. negative expression, p = 0.01) were highly predictive of early cancer-specific death. By comparison, pathologic factors (size, lymph node metastases, resection margin status, and grade) had ORs below three, and none reached statistical significance. ROC curves were used to compare the four pathologic prognostic features (ROC area = 0.70) to three univariate molecular predictors (MUC1, MSLN, MUC2) of survival group (ROC area = 0.80, p = 0.07).
Conclusions: MUC1 and MSLN were superior to pathologic features and other putative biomarkers as predicting survival group. Molecular assays comparing cancers from short and long survivors are an effective strategy to screen biomarkers and prioritize candidate cancer genes for diagnostic and therapeutic studies.
Conflict of interest statement
Figures


References
-
- Kalser MH, Ellenberg SS. Pancreatic cancer. Adjuvant combined radiation and chemotherapy following curative resection. Arch Surg. 1985;120:899–903. - PubMed
-
- Neoptolemos JP, Stocken DD, Friess H, Bassi C, Dunn JA, et al. A randomized trial of chemoradiotherapy and chemotherapy after resection of pancreatic cancer. N Engl J Med. 2004;350:1200–1210. - PubMed
-
- Oettle H, Post S, Neuhaus P, Gellert K, Langrehr J, et al. Adjuvant chemotherapy with gemcitabine vs observation in patients undergoing curative-intent resection of pancreatic cancer: a randomized controlled trial. JAMA. 2007;297:267–277. - PubMed
-
- Regine WF, Winter KA, Abrams RA, Safran H, Hoffman JP, et al. Fluorouracil vs gemcitabine chemotherapy before and after fluorouracil-based chemoradiation following resection of pancreatic adenocarcinoma: a randomized controlled trial. JAMA. 2008;299:1019–1026. - PubMed
Publication types
MeSH terms
Substances
Grants and funding
LinkOut - more resources
Full Text Sources
Other Literature Sources
Research Materials
Miscellaneous

