

Towards predicting basin-wide invertebrate organic biomass and production in marine sediments from a coastal sea
- PMID: 22792267
- PMCID: PMC3391270
- DOI: 10.1371/journal.pone.0040295
Towards predicting basin-wide invertebrate organic biomass and production in marine sediments from a coastal sea
Abstract
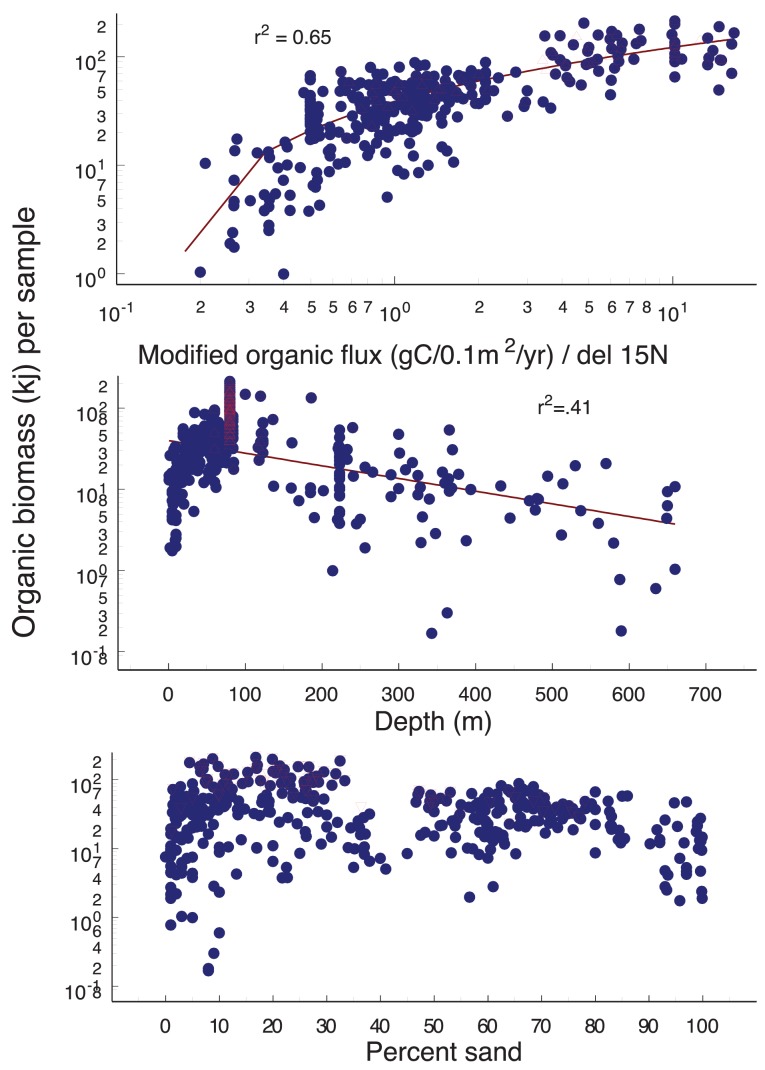
Detailed knowledge of environmental conditions is required to understand faunal production in coastal seas with topographic and hydrographic complexity. We test the hypothesis that organic biomass and production of subtidal sediment invertebrates throughout the Strait of Georgia, west coast of Canada, can be predicted by depth, substrate type and organic flux modified to reflect lability and age of material. A basin-wide database of biological, geochemical and flux data was analysed using an empirical production/biomass (P/B) model to test this hypothesis. This analysis is unique in the spatial extent and detail of P/B and concurrent environmental measurements over a temperate coastal region. Modified organic flux was the most important predictor of organic biomass and production. Depth and substrate type were secondary modifiers. Between 69-74% of variability in biomass and production could be explained by the combined environmental factors. Organisms <1 mm were important contributors to biomass and production primarily in shallow, sandy sediments, where high P/B values were found despite low organic flux. Low biomass, production, and P/B values were found in the deep, northern basin and mainland fjords, which had silty sediments, low organic flux, low biomass of organisms <1 mm, and dominance by large, slow-growing macrofauna. In the highest organic flux and biomass areas near the Fraser River discharge, production did not increase beyond moderate flux levels. Although highly productive, this area had low P/B. Clearly, food input is insufficient to explain the complex patterns in faunal production revealed here. Additional environmental factors (depth, substrate type and unmeasured factors) are important modifiers of these patterns. Potential reasons for the above patterns are explored, along with a discussion of unmeasured factors possibly responsible for unexplained (30%) variance in biomass and production. We now have the tools for basin-wide first-order estimates of sediment invertebrate production.
Conflict of interest statement
Figures


Similar articles
-
Size structure of marine soft-bottom macrobenthic communities across natural habitat gradients: implications for productivity and ecosystem function.PLoS One. 2012;7(7):e40071. doi: 10.1371/journal.pone.0040071. Epub 2012 Jul 20. PLoS One. 2012. PMID: 22911694 Free PMC article.
-
Responses of subtidal benthos of the Strait of Georgia, British Columbia, Canada to ambient sediment conditions and natural and anthropogenic depositions.Mar Environ Res. 2008 Dec;66 Suppl:S62-79. doi: 10.1016/j.marenvres.2008.08.009. Epub 2008 Sep 10. Mar Environ Res. 2008. PMID: 18950854
-
Distribution, inventory and turnover of benthic organic biomass in the Strait of Georgia, Canada, in relation to natural and anthropogenic inputs.Mar Pollut Bull. 2014 May 15;82(1-2):155-66. doi: 10.1016/j.marpolbul.2014.03.004. Epub 2014 Mar 29. Mar Pollut Bull. 2014. PMID: 24690409
-
A review of subtidal benthic habitats and invertebrate biota of the Strait of Georgia, British Columbia.Mar Environ Res. 2008 Dec;66 Suppl:S3-38. doi: 10.1016/j.marenvres.2008.09.004. Epub 2008 Oct 10. Mar Environ Res. 2008. PMID: 19036427 Review.
-
The Minderoo-Monaco Commission on Plastics and Human Health.Ann Glob Health. 2023 Mar 21;89(1):23. doi: 10.5334/aogh.4056. eCollection 2023. Ann Glob Health. 2023. PMID: 36969097 Free PMC article. Review.
Cited by
-
Size structure of marine soft-bottom macrobenthic communities across natural habitat gradients: implications for productivity and ecosystem function.PLoS One. 2012;7(7):e40071. doi: 10.1371/journal.pone.0040071. Epub 2012 Jul 20. PLoS One. 2012. PMID: 22911694 Free PMC article.
References
-
- Johannessen SC, Macdonald RW, Burd B, van Roodselaar A. Biogeochemical cycling in the Strait of Georgia. Marine Environmental Research. 2008;66:S1–S2. - PubMed
-
- Smith C, De Leo F, Bernardino A. Abyssal food limitation, ecoystems structure and climate change. Trends in Ecology and Evolution. 2008;23:518–528. - PubMed
-
- Johannessen SC, Macdonald RW, Paton DW. A sediment and organic carbon budget for the greater Strait of Georgia. Estuarine, Coastal and Shelf Science. 2003;56:845–860.
-
- Gobas F. Harrad S, editor. Assessing bioaccumulation factors of persistent organic pollutants in aquatic food-chains. 2001. pp. 145–165. editor. Persistent organic pollutants: environmental behaviour and pathways of human exposure. Norwell, Massachusetts: Kluwer.
-
- Gobas F, Pasternak J, Lien K, Duncan R. Development & Field-Validation of a multi-media exposure assessment model for waste load allocation in aquatic ecosystems: application toTCDD and TCDF in the Fraser River watershed. Environmental Science and Technology. 1998;32:2442–2449.
Publication types
MeSH terms
Substances
LinkOut - more resources
Full Text Sources
