. 2012;7(7):e40307.
doi: 10.1371/journal.pone.0040307. Epub 2012 Jul 6.

Characteristic features of kynurenine aminotransferase allosterically regulated by (alpha)-ketoglutarate in cooperation with kynurenine

Affiliations

Characteristic features of kynurenine aminotransferase allosterically regulated by (alpha)-ketoglutarate in cooperation with kynurenine

Ken Okada et al. PLoS One. 2012.

Abstract

Kynurenine aminotransferase from Pyrococcus horikoshii OT3 (PhKAT), which is a homodimeric protein, catalyzes the conversion of kynurenine (KYN) to kynurenic acid (KYNA). We analyzed the transaminase reaction mechanisms of this protein with pyridoxal-5'-phosphate (PLP), KYN and α-ketoglutaric acid (2OG) or oxaloacetic acid (OXA). 2OG significantly inhibited KAT activities in kinetic analyses, suggesting that a KYNA biosynthesis is allosterically regulated by 2OG. Its inhibitions evidently were unlocked by KYN. 2OG and KYN functioned as an inhibitor and activator in response to changes in the concentrations of KYN and 2OG, respectively. The affinities of one subunit for PLP or 2OG were different from that of the other subunit, as confirmed by spectrophotometry and isothermal titration calorimetry, suggesting that the difference of affinities between subunits might play a role in regulations of the KAT reaction. Moreover, we identified two active and allosteric sites in the crystal structure of PhKAT-2OG complexes. The crystal structure of PhKAT in complex with four 2OGs demonstrates that two 2OGs in allosteric sites are effector molecules which inhibit the KYNA productions. Thus, the combined data lead to the conclusion that PhKAT probably is regulated by allosteric control machineries, with 2OG as the allosteric inhibitor.


Conflict of interest statement

Competing Interests: The authors have declared that no competing interests exist.

Figures

Figure 1
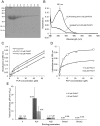
Figure 1. One-step purification of PhKAT and spectrophotometric analysis of the cofactor (PLP) binding to apo-KAT.
(A) SDS-polyacrylamide gel electrophoresis (SDS-PAGE). Lanes ∼1–10, verification of the purity of PhKAT in each elution fraction from the metal-affinity column. Protein fractions in lanes ∼2–10 were used for further analysis and crystallization. The positions of the protein standards (molecular masses, 97, 66, 45, 30, 20.1, and 14.4 kDa) are indicated. (B) UV–visible absorption spectra of as-isolated PhKAT (lower spectrum) and its cofactor-binding form (holo-PhKAT, upper spectrum). The lower spectrum was obtained with the as-purified protein, and the upper spectrum was recorded after mixing 20 µM PhKAT with 20 µM PLP. The spectrum shows a maximum at 361 nm. (C) Spectrophotometric titration of PLP for 10 and 20 µM PhKAT. (D) Relationship between the equilibrium-binding response and the concentrations of PLP and PhKAT. The solid lines represent the fitting curve obtained by the 2-site binding model with hill slopes using Prism5 software. (E) Summary table of binding parameters from D. Errors are the S.E. from the fit of the data. The binding affinity of a second binding site for PLP was stronger than a first binding site in PhKAT (K d1>K d2).
Figure 2
Figure 2. Overall crystal structure of the PLP–KAT complex and PLP in complex.
(A) Stereoview and cartoon representation of the structure of functional PhKAT dimer bound to 2 PLP cofactors. A C-α trace is shown with rainbow coloring from N- (blue) to C-termini (red). Black arrows indicate the position of PLP molecules and active sites. (B) Part of PLP with a 2Fo-Fc electron density map contoured at 1.5 σ. PLP molecules formed a Schiff-base link with lysine-269. (C), (D) Superimposed representation of the structures of PhKAT and HuKAT II. (C) Cartoon representations of PLP complex structures of PhKAT (PDB code: 3AOV) and HuKAT II (PDB code: 2VGZ) after optimal superimposition. PhKAT and HuKAT II are rainbow-colored and gray, respectively. The left-hand molecule is shown in the same orientation as in A, whereas the right-hand molecule is rotated −90°. (D) Stick representation of the PLP cofactor-binding sites with PhKAT and HuKAT II after optimal superposition of the 2 structures. HuKAT II is colored blue-gray. These results indicate that the secondary structures of KAT are conserved between P. horikoshii and humans. The figure was generated using PyMOL.
Figure 3
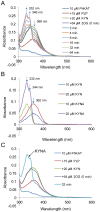
Figure 3. Catalytic activity of PhKAT.
(A) Spectrophotometric assay of the time course of the PhKAT-catalyzed activity of KYN. The PhKAT-catalyzed activity of KYN was examined by spectrophotometry using both PLP and 2OG. Time-dependent absorbance changes were monitored during the PhKAT reaction after the addition of 2OG. The arrows indicate the direction of absorbance changes during incubation. The absorption band at 368 nm decreases with time, while bands at 332 and 346 nm appear and increase, respectively. The spectrum at 32 min was identical to that at 64 min. (B) Comparison of the absorption spectra of KYN and KYNA. The absorption spectra of KYN and KYNA measured at concentrations of 10 and 20 µM. The spectrum of KYNA exhibits 2 peaks at 332 and 344 nm, and KYN exhibits a peak at 362 nm. (C) The observed absorbance before and after the PhKAT catalyzed-reaction. The final product of the PhKAT-catalyzed reaction from KYN substrate was identified with KYNA.
Figure 4
Figure 4. Kinetics of the KAT reaction with 2 substrates.
The KAT-catalyzed reaction from KYN to KYNA was determined by monitoring the change in absorption at 332 nm. (A), (B) Measurement of the KAT-catalyzed conversion to KYNA with definite KYN concentrations, and the allostery of 2OG for PhKAT. Values are mean±S.D. ((A), (B): n = 5). The arrow and arrow heads indicate the conformation changes of PhKAT from R state to T state in conjunction with binding of 2OG to a first binding site and allosteric inhibitions, respectively. The KYNA productions from KYN by KAT are regulated at two respects of low and high 2OG concentrations. Black arrow-head: first allosteric inhibition by a first 2OG effector molecule; white arrow-head: second allosteric inhibition by a second 2OG effector molecule. (C), (D) The PhKAT-catalyzed reaction by α-keto acid analogs. The solid line represents the fitting curve obtained by allosteric sigmoidal model using Prism5 software (Equation S3). The arrows indicate the conformation changes from R state to T state in conjunction with binding of keto acid analogs to a first binding site. (E), (F) Comparison of the PhKAT-catalyzed reaction by OXA and 2OG, and the allostery of OXA for PhKAT. Values are mean±S.D. ((E), (F): n = 5 and 4, respectively). The arrow indicates the conformation changes of PhKAT from R state to T state in conjunction with binding of OXA to a first binding site. Black arrow-heads: first allosteric inhibition by OXA; white arrow-head: binding of fourth KYN. (G) Comparison of E and F. (H) Magnified views of E and F (∼2 µM). (A), (E) 50 µM KYN; (B), (C), (D), (F) 100 µM KYN. (I) Keto acids: 2OG, α-KBA, α-KMB and OXA. A dot circle indicates the important parts in 2OG for the allostery.
Figure 5
Figure 5. ITC analysis of the interaction between the cofactor, substrates, and KAT.
The ITC profiles include experimental conditions. (A) KAT and PLP; (B) KAT-PLP and 2OG; (C) KAT-PLP-KYN and 2OG. The numbers indicate a binding site. The binding between the KAT–PLP complex and 2OG might be an overestimation of the limit of ITC. (A), (B) The shapes of binding curves indicated that the dissociation constants for PLP (as apparent constant) and 2OG of second and first binding sites, respectively, might be approximately femtomole orders. (C) A curve fitting was performed by using a sequential binding 4-site model.
Figure 6
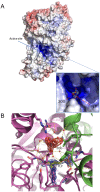
Figure 6. Surface and substrate binding site representations of 2OG, PLP, and KAT complexes.
(A) Electrostatic potential mapped onto the molecular surface of a functional KAT dimer with bound 2OG and PLP shown as sticks. The 2OG/PLP-bound site of KAT is positively charged. Electrostatic potential calculated using APBS and PDB2PQR server. Potentials are contoured from −15 kT/e (negative charge, red) to +15 kT/e (positive charge, blue). The positively charged sites bind to both the substrates and cofactor with high affinity. (B) Close-up view of a 2OG-bound site of KAT structure. Parts of 2OG and PLP with 2Fo-Fc electron density maps contoured at 1.5 σ. The figure was generated using PyMOL.
Figure 7
Figure 7. Overall crystal structure of PhKAT in complex with PLP and 2OG as a substrate and allosteric effector (PDB code: 3ATH).
(A) Surface and cartoon representation of the structure of functional PhKAT dimer bound with 2 PLP cofactors and 4 2OGs. A Cα trace is shown with blue and green coloring with 2 subunit chains. Black arrows indicate the position of PLP as cofactor and 2OG as substrate and allosteric effector. Left hand, cartoon-and-surface representation of the allosteric–effector complex. Right hand, cut-away of the overall structure of the left-hand complex. (B), (C) Part of 2OG as a substrate (B) and as an allosteric effector (C) with a 2Fo-Fc electron density map contoured at 1.3 σ. (D), (E), (F) Superimposed representation of 2OG complex structures of PhKAT. (D) Cartoon representations of 2OG complex structures of PhKAT after optimal superimposition. 2OG as a substrate complex (PDB code: 3AOW) and 2OG as a substrate and an allosteric effector complex (PDB code: 3ATH). Gray cartoon-and-line represents PhKAT bound only to 2OG as a substrate complex; PhKAT bound to 2OG as substrates and allosteric effectors is colored green and blue for 2 subunits. Yellow circles show regions with significant conformation changes. Black arrows indicate the position of 2OG as substrates and allosteric effectors. (E), (F) Stick-and-line representation of the PLP-cofactor binding sites and 2OG as substrate after optimal superposition of the 2 PhKAT complex structures. 2OG as a substrate complex only is colored gray. (E) Black and gray labels, and dotted lines show the distance (Å) between 2OG and the C4A atom of PLP in a Schiff-base link with lysine-269. (F) Angles (°) of 2OG between substrate-bound PhKAT, and substrate- and allosteric effector-bound PhKAT structures. The figure was generated using PyMOL.
Figure 8
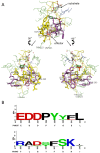
Figure 8. Close-up view of an allosteric effector-binding site and its sequence logo.
(A) Line-and-stick representations of the binding sites of PLP and 2OG molecules as a cofactor, substrate, and allosteric effector. Black arrows show 2OG in its positions as a substrate (upper) and allosteric effector (lower). Lower sites are rotated 90° and −90° relative to the upper site. The figure was generated using PyMOL. (B) Sequence logo of the allosteric effector-bound site. Upper, yellow stick representation region of (A) + Glu-235; lower, magenta stick representation region of (A). “K-269” is a ligand bound with a C4A atom of PLP. Amino acids are colored according to their chemical properties: polar amino acids (G, S, T, and Y) are green, basic (K and R) blue, acidic (D and E) red, and hydrophobic (V, A, L, I, P, and F) amino acids are black. The protein sequence alignment used mammalian KAT IIs and PhKAT. GenBank database (GB) accession numbers for P. horikoshii, humans (Homo sapiens), rats (Rattus norvegicus), mice (Mus musculus), pigs (Sus scrofa), and monkeys (Macaca mulatta) are NP_142204, NP_057312, NP_058889, NP_035964, XP_001924647, and XP_002804303, respectively. Multiple alignments were performed using ClustalW2. The sequence logo was generated using WebLogo .

Similar articles

Cited by

References

    1. Tobes MC, Mason M. Alpha-Aminoadipate aminotransferase and kynurenine aminotransferase. Purification, characterization, and further evidence for identity. J Biol Chem. 1977;252:4591–4599. - PubMed
    1. Wu HQ, Pereira EF, Bruno JP, Pellicciari R, Albuquerque EX, et al. The astrocyte-derived alpha7 nicotinic receptor antagonist kynurenic acid controls extracellular glutamate levels in the prefrontal cortex. J Mol Neurosci. 2010;40:204–210. - PMC - PubMed
    1. Hartai Z, Juhasz A, Rimanoczy A, Janaky T, Donko T, et al. Decreased serum and red blood cell kynurenic acid levels in Alzheimer’s disease. Neurochem Int. 2007;50:308–313. - PubMed
    1. Erhardt S, Schwieler L, Engberg G. Kynurenic acid and schizophrenia. Adv Exp Med Biol. 2003;527:155–165. - PubMed
    1. Rossi F, Schwarcz R, Rizzi M. Curiosity to kill the KAT (kynurenine aminotransferase): structural insights into brain kynurenic acid synthesis. Curr Opin Struct Biol. 2008;18:748–755. - PubMed

Publication types