. 2012;7(7):e40328.
doi: 10.1371/journal.pone.0040328. Epub 2012 Jul 6.

Low level sequence variant analysis of recombinant proteins: an optimized approach

Affiliations

Low level sequence variant analysis of recombinant proteins: an optimized approach

Anne Zeck et al. PLoS One. 2012.

Abstract

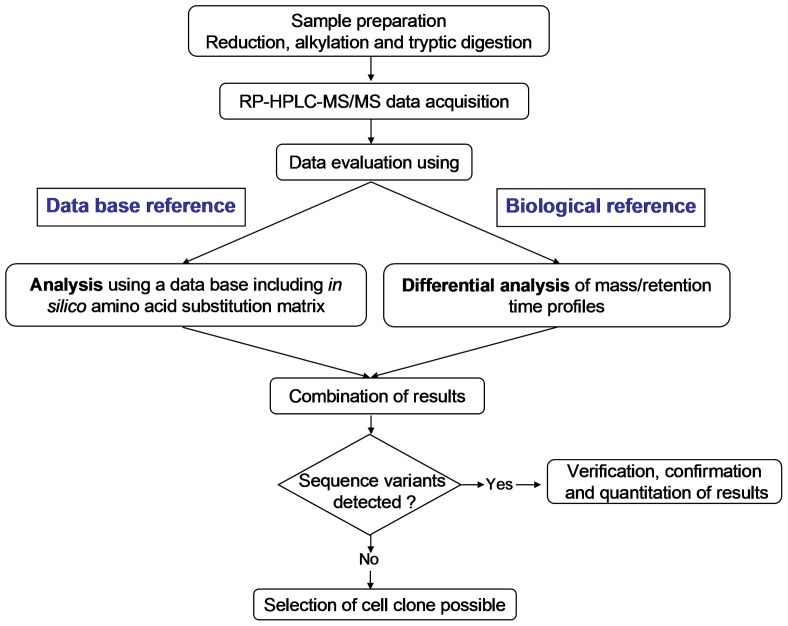
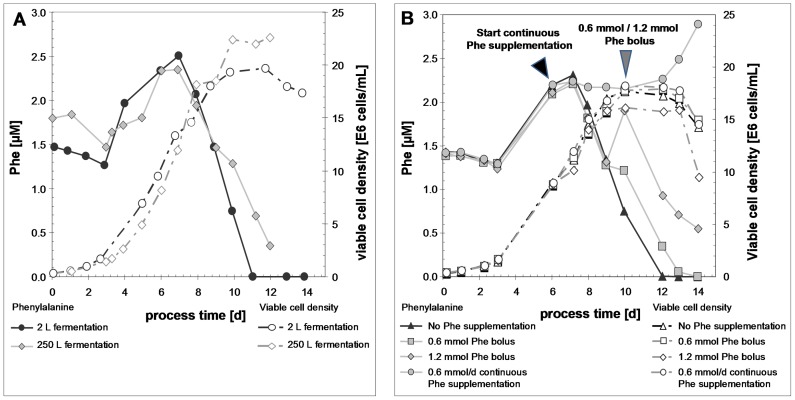
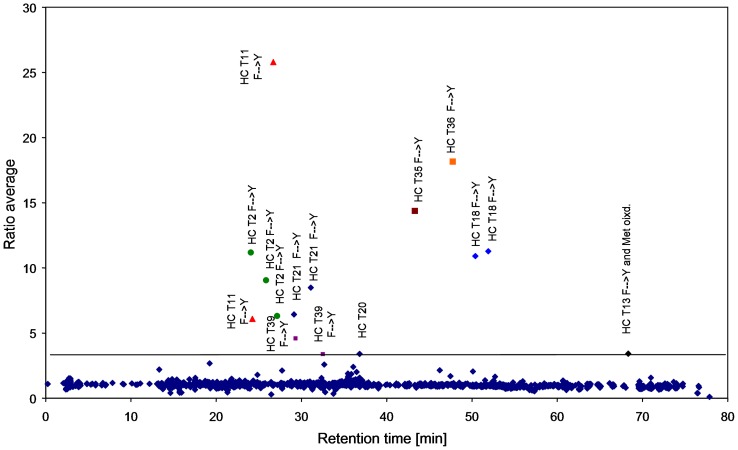
Sequence variants in recombinant biopharmaceuticals may have a relevant and unpredictable impact on clinical safety and efficacy. Hence, their sensitive analysis is important throughout bioprocess development. The two stage analytical approach presented here provides a quick multi clone comparison of candidate production cell lines as a first stage, followed by an in-depth analysis including identification and quantitation of aberrant sequence variants of selected clones as a second stage. We show that the differential analysis is a suitable tool for sensitive and fast batch to batch comparison of recombinant proteins. The optimized approach allows for detection of not only single amino acid substitutions in unmodified peptides, but also substitutions in posttranslational modified peptides such as glycopeptides, for detection of truncated or elongated sequence variants as well as double amino acid substitutions or substitution with amino acid structural isomers within one peptide. In two case studies we were able to detect sequence variants of different origin down to a sub percentage level. One of the sequence variants (Thr → Asn) could be correlated to a cytosine to adenine substitution at DNA (desoxyribonucleic acid) level. In the second case we were able to correlate the sub percentage substitution (Phe → Tyr) to amino acid limitation in the chemically defined fermentation medium.


Conflict of interest statement

Competing Interests: At the time of writing, all authors were employees at Roche Diagnostic. Since then FW is now affiliated to Abbott GmbH. There are no patents, products in development or marketed products to declare. This does not alter the authors’ adherence to all the PLoS ONE policies on sharing data and materials, as detailed online in the guide for authors.

Figures

Figure 1
Figure 1. Workflow of sequence variant analysis of recombinant monoclonal antibodies.
Figure 2
Figure 2. Scatter plot showing differences in m/z and retention time domain between the LC-MS/MS data sets of rhumAb A tryptic digests with ant without 1% rhumAb B.
For labeling nomenclature see Table 1.
Figure 3
Figure 3. Fragment ion spectra of the HC T13** peptide originating from the spiking antibody B (upper spectrum) and the corresponding peptide originating from the reference antibody A (lower spectrum).
SIEVE detected the HC T13 peptide and MS/MS was triggered.
Figure 4
Figure 4. Scatter plot showing differences in m/z and retention time domain of two LC-MS/MS data set replicates from tryptic digests of recombinant human IgG1 antibody A clone 1 and clone 2.
Figure 5
Figure 5. Frequency of base exchanges, deletions or insertions within the 48 base pair DNA region coding for HC peptide VVSVLTVLHQDWLNGK as it was detected by bidirectional ultra-deep sequencing.
Separate statistics are shown for base substitutions by guanine (N→G), adenine (N→A), thymine (N→T) or cytosine (N→C). Upper panel (A): sequencing in forward direction; lower panel (B): sequencing in reverse direction.
Figure 6
Figure 6. Time course analysis of phenylalanine concentration and viable cell density during fermentation runs of a cell line expressing rhumAb C.
A: Comparison of fed-batch (2 L) and scale-up (250 L) fermentation runs without phenylalanine supplementation. B: Comparison of fed-batch fermentation runs (2 L) under different phenylalanine nutrition regimes.
Figure 7
Figure 7. Differential analysis of mass/retention time profiles of two LC-MS/MS data set replicates from tryptic digests of recombinant human IgG1 antibody C under phenylalanine starvation versus phenylalanine supplementation conditions.
The horizontal line indicates the minimal intensity ratio value above which m/z signals are considered. Peaks showing identical MS and MS/MS data but eluting at different retentions time are marked by shape and color.

References

    1. Reichert JM. Antibody-based therapeutics to watch in 2011. MAbs. 2011;3:76–99. - PMC - PubMed
    1. Reichert JM. Monoclonal antibodies as innovative therapeutics. Curr Pharm Biotechnol. 2008;9:423–430. - PubMed
    1. Samaranayake H, Wirth T, Schenkwein D, Raty JK, Yla-Herttuala S. Challenges in monoclonal antibody-based therapies. Ann Med. 2009;41:322–331. - PubMed
    1. Durocher Y, Butler M. Expression systems for therapeutic glycoprotein production. Curr Opin Biotechnol. 2009;20:700–707. - PubMed
    1. Omasa T, Furuichi K, Iemura T, Katakura Y, Kishimoto M, et al. Enhanced antibody production following intermediate addition based on flux analysis in mammalian cell continuous culture. Bioprocess Biosyst Eng. 2010;33:117–125. - PubMed

MeSH terms