. 2012;7(7):e40343.
doi: 10.1371/journal.pone.0040343. Epub 2012 Jul 5.

Dysregulation of suppressor of cytokine signaling 3 in keratinocytes causes skin inflammation mediated by interleukin-20 receptor-related cytokines

Affiliations

Dysregulation of suppressor of cytokine signaling 3 in keratinocytes causes skin inflammation mediated by interleukin-20 receptor-related cytokines

Ayako Uto-Konomi et al. PLoS One. 2012.

Abstract

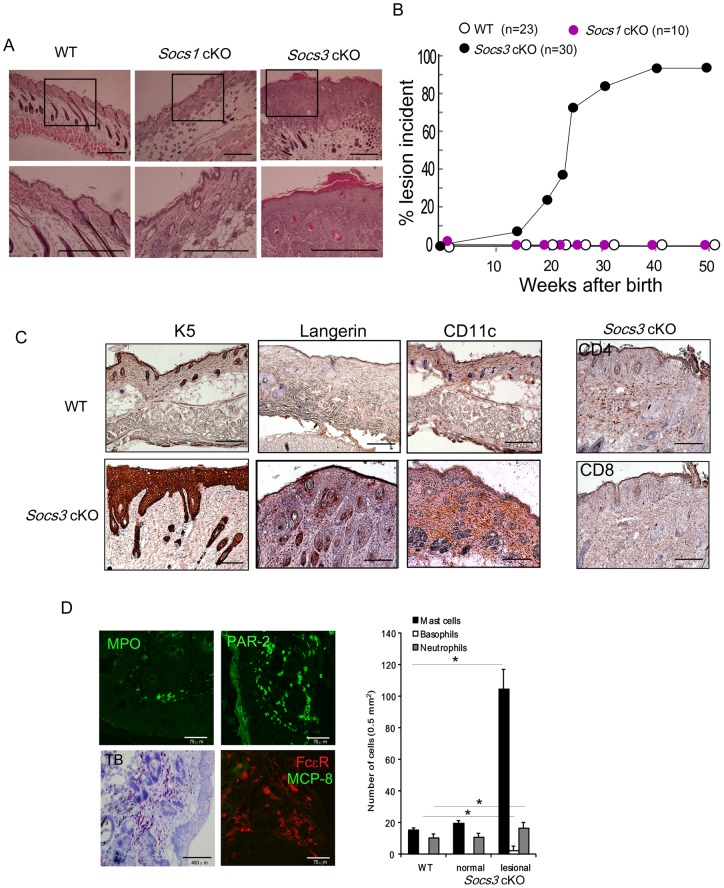
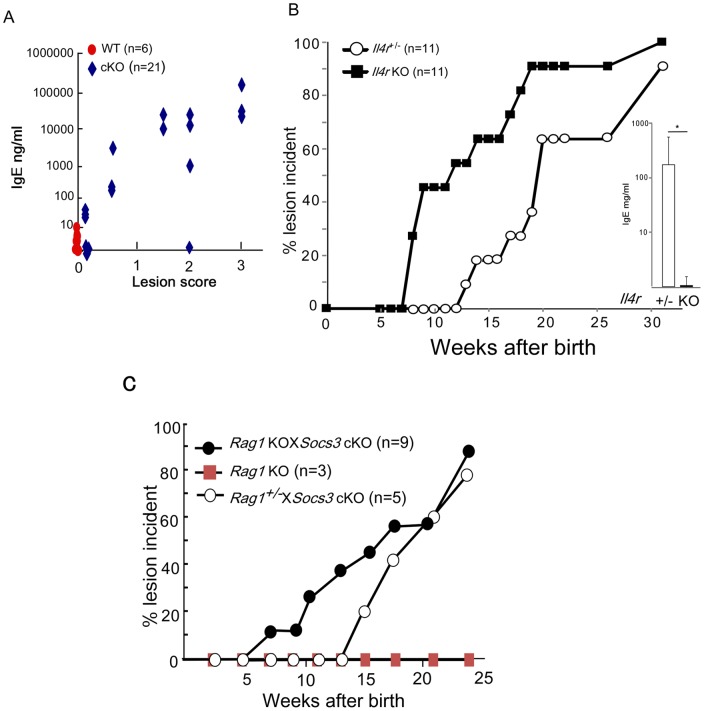
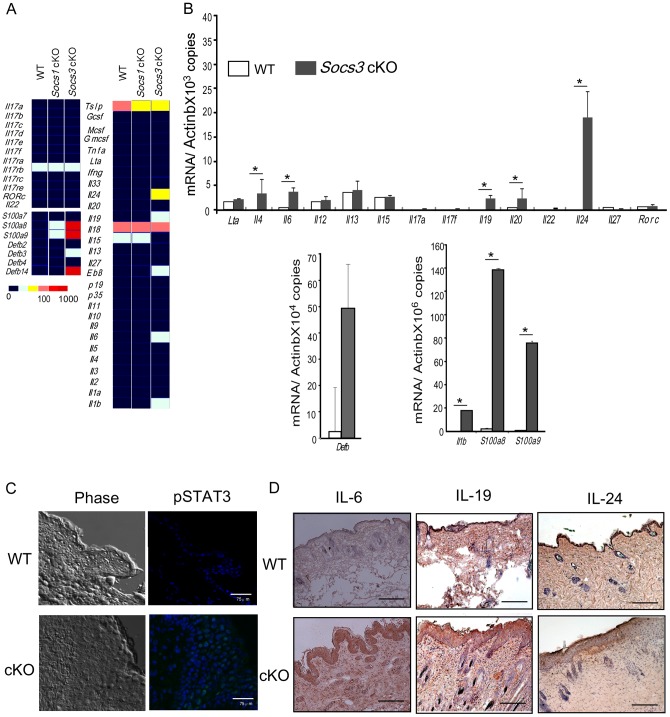
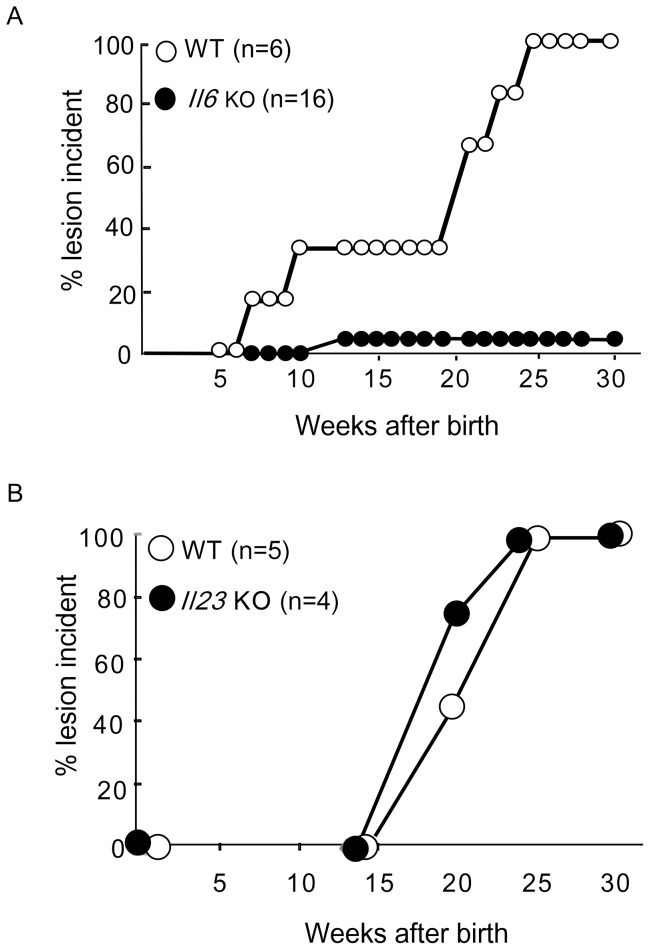
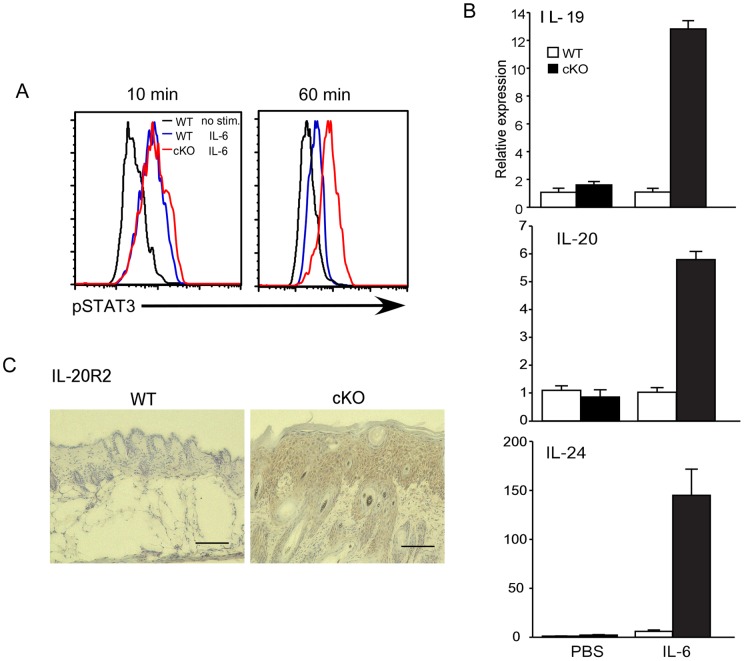
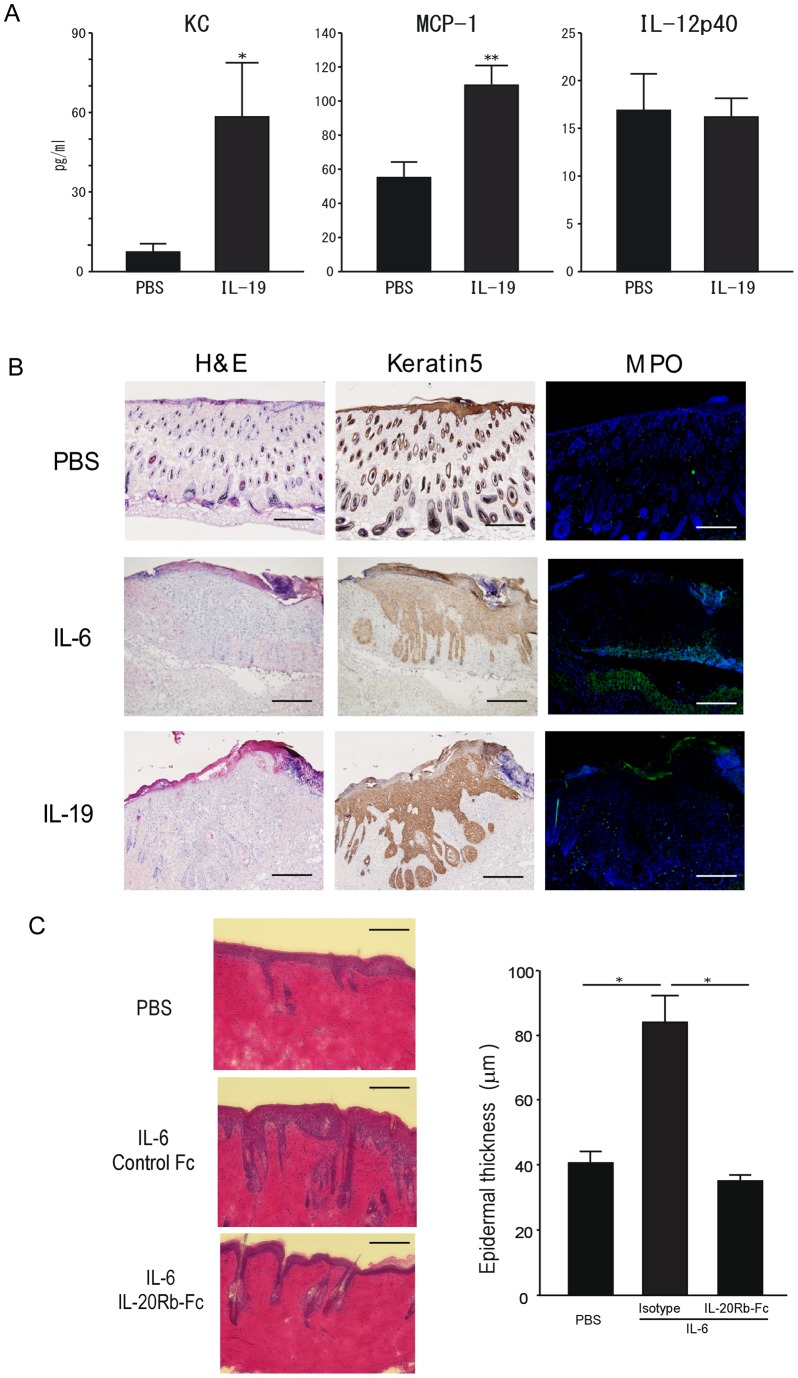
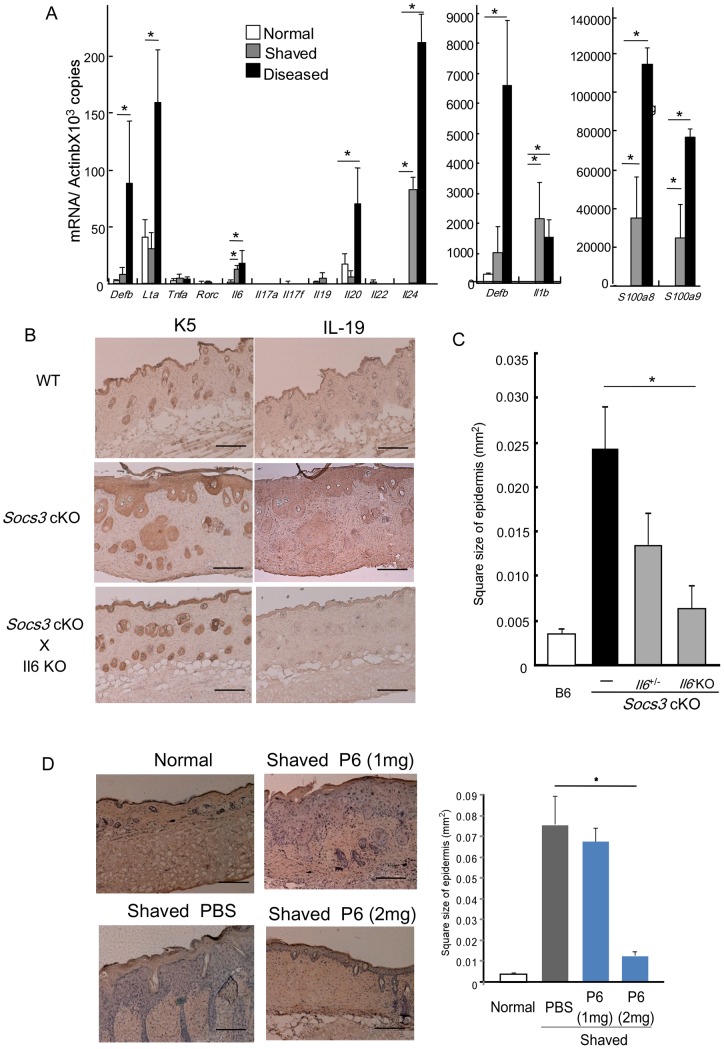
Homeostatic regulation of epidermal keratinocytes is controlled by the local cytokine milieu. However, a role for suppressor of cytokine signaling (SOCS), a negative feedback regulator of cytokine networks, in skin homeostasis remains unclear. Keratinocyte specific deletion of Socs3 (Socs3 cKO) caused severe skin inflammation with hyper-production of IgE, epidermal hyperplasia, and S100A8/9 expression, although Socs1 deletion caused no inflammation. The inflamed skin showed constitutive STAT3 activation and up-regulation of IL-6 and IL-20 receptor (IL-20R) related cytokines, IL-19, IL-20 and IL-24. Disease development was rescued by deletion of the Il6 gene, but not by the deletion of Il23, Il4r, or Rag1 genes. The expression of IL-6 in Socs3 cKO keratinocytes increased expression of IL-20R-related cytokines that further facilitated STAT3 hyperactivation, epidermal hyperplasia and neutrophilia. These results demonstrate that skin homeostasis is strictly regulated by the IL-6-STAT3-SOCS3 axis. Moreover, the SOCS3-mediated negative feedback loop in keratinocytes has a critical mechanistic role in the prevention of skin inflammation caused by hyperactivation of STAT3.


Conflict of interest statement

Competing Interests: Ayako Uto-Konomi, Naoko Ozaki and Shinobu Suzuki are employed by Nippon Boehringer Ingelheim Co., Ltd., and Daniel Cua is employed by Schering-Plough Biopharma. There are no patents, products in development or marketed products to declare. This does not alter the authors' adherence to all the PLoS ONE policies on sharing data and materials. Other authors have declared that no competing interests exist.

Figures

Figure 1
Figure 1. Socs3 cKO spontaneously developed epidermal hyperplasia and skin inflammation.
A) Upper and bottom panels show histopathological analysis of K5-Cre (WT) (left), Socs1 cKO (center) and Socs3 cKO (right) mice skin with hematoxylin and eosin staining. Magnification of upper and lower panels are x40 and x100, respectively. Scale bar in each section indicates 750 υm. B) Percentage of mice showing skin lesion incidences in wild type (WT) (open circle), Socs1 cKO (closed purple circle) and Socs3 cKO (closed-black circle) mice. Disease incidence was monitored weekly up to 50 weeks after birth. Percentage of mice showing incidence of disease is shown on the Y axis at each time point. The number of mice used in each group is indicated in the figure. C) Localization of keratinocytes (K5), Langerhans cells (Langerin), and CD11c+ dendritic cells (CD11c) in epidermis and dermis of the diseased Socs3 cKO skin was assessed by immunohistlogical staining (x40) (left panel). Wild type (WT) mice skin was stained as a control. CD4 and CD8 positive T cells were also identified in epidermis and dermis of the diseased Socs3 cKO skin (right panel). Scale bar in each section indicates 750 υm. D) Neutrophil number was confirmed by counting MPO positive cells in epidermis and dermis of the diseased Socs3 cKO skin by immunohistlogical staining (x400) (upper left panel). PAR-2, TB staining, FceR and MCP-8 positive cells in epidermis and dermis of the diseased Socs3 cKO skin are shown (upper right, lower left, and lower right panel, respectively). Scale bar in each section indicates 75 υm. Number of neutrophils, mast cells and basophils in epidermis and dermis are shown in the right bar graphs. *P<0.01. Data are the mean from three independent experiments. Error bars are SD.
Figure 2
Figure 2. T cell responses are not required for initiation of the skin disease in Socs3cKOmice.
A) Serum level of IgE was measured in wild type (WT) and Socs3 cKO mice and is shown on the Y axis. X axis indicates skin disease severity (Lesion score). Red symbols indicate WT mice (n = 6) and blue symbols indicate Socs3 cKO with or without skin lesions (n = 21). B) Lesion incidence was examined in Socs3 cKO with Il4r +/− (shown as Il4r +/− in the figure, open circle, n = 11) and Il4r null Socs3 cKO (shown as Il4 KO in the figure, closed circle, n = 11). Serum IgE in individual Socs3 cKO with Il4r+/ (+/−) and Socs3 cKO with Il4r KO mice (KO) was measured at 30 weeks of age and the mean +/− SD is shown (right). C) Role of T-B cells in the development of the skin lesions in Socs3 cKO mice. Lesion incidence was examined in Rag1 KO (red-square, n = 3), Socs3 cKO with Rag1 KO (Rag1 KOXSocs3 cKO, closed circles, n = 9), and Socs3 cKO with Rag1+/− (Rag1 +/−XSocs3 cKO, open circles, n = 5) mice. Each mouse strain was monitored until 24 weeks after birth (X axis). The percentage of mice with lesions is shown on the Y axis at each time point after birth.
Figure 3
Figure 3. Cytokine expression in the diseased skin.
A) Expression profiles. RNA was prepared from skin of K5-Cre (WT), Socs1 cKO, and the diseased Socs3 cKO mice, and analyzed using a TAQMAN™ real-time quantitative PCR system. Copy numbers are depicted by the color indicators shown on the lower left. B) Quantitative RT-PCR analysis of the cytokine and Rorc panel (upper), Defb (lower left) and S100a8 and S100a9 (lower right) expression. Skin from K5-Cre (WT, open column) and Socs3 cKO (closed column) mice was analyzed by SYBR green real-time qPCR. Data are normalized to β-actin mRNA copy number and the mean and SEM (n = 5) are indicated. Statistical significance was determined using the Student's t-test. * p<0.05. C) Skin sections from K5-Cre control (WT) and the diseased Socs3 cKO mice (cKO) were stained with Alexa 488 labeled anti-pSTAT3. Left panels represent phase contrast of skin section, and right panels represent pSTAT3 (green) in the skin section (x400). Scale bar in each section indicates 75 υm. D) Protein expression of IL-6, IL-19, and IL-24 in the frozen skin sections from K5-Cre (WT) and the diseased Socs3 cKO mice were analyzed by immunohistochemical staining (x40). Scale bar in each section indicates 750 υm.
Figure 4
Figure 4. Lesion incidences in Socs3 cKO mice and in combined Il6−/−- or Il23−/−-Socs3 cKO mice.
A) Lesion incidences were examined in K5-Cre mice (WT, open circle, n = 6) and Il6 −/− Socs3 cKO (Il6 KO, closed circle, n = 16) mice. Each mouse strain was monitored up to 30 weeks after birth. The percentage of the mice showing disease incidence is shown on the Y axis in all examined mice at each time point. B) Lesion incidences were examined in K5-Cre mice (WT, open circle, n = 5) and Il23 −/− Socs3 cKO (Il23 KO, closed circle, n = 4) mice. Each mouse strain was monitored for up to 30 weeks after birth. The percentage of the mice showing disease incidence is shown on the Y axis in all examined mice at each time point.
Figure 5
Figure 5. The effect of IL-6 on primary keratinocytes derived from Socs3 cKO mice.
A) Mouse primary keratinocytes were stimulated with 10 ng/ml of IL-6 for 10 or 60 min and pSTAT3 was analyzed by flow cytometry. Black lines show the PBS control, blue lines show the keratinocytes from normal C57BL/6 mice, and red lines show the keratinocytes from Socs3 cKO mice. Data are representative of 3 separate experiments. B) mRNA expression of IL-20R related cytokines in the keratinoyctes. Mouse primary keratinocytes were stimulated with or without IL-6 for 24 hrs and the expression of IL-19, IL-20 and IL-24 mRNA was investigated by quantitative RT-PCR. Open bars show the keratinocytes from C57BL/6 mice (WT), and closed bars show those of Socs3 cKO mice. Data are relative expression to PBS-treated C57BL/6 keratinocytes. Data are mean ± SEM, n = 3. C) Increased expression of IL-20R2 protein in the diseased skin of Socs3 cKO mice. Protein levels of IL-20R2 in the frozen skin sections from K5-Cre (WT) and the diseased Socs3 cKO mice were analyzed by immunohistochemical staining (x200). Scale bar in each section indicates 150 υm.
Figure 6
Figure 6. Effect of IL-19 on skin inflammation in the Socs3 cKO mice.
A) Amounts of KC, MCP-1 and IL12p40 in the air pouches after IL-19 injection into C57BL/6 mice. IL-19 or PBS was injected into mouse air pouches, and chemokine concentration in the pouch lavage was measured after 5 hrs. Data are mean ± SEM, n = 5–6. B) IL-6 and IL-19 induced skin inflammation in the Socs3 cKO mice. Socs3 cKO mice were injected with PBS (upper rows), 10 ng of IL-6 (middle rows) or 10 ng of IL-19 (bottom rows) was injected intradermally and skin sections were obtained two weeks later. Left panels show the H&E staining, middle panels show K5 immunostaining, and right panels show MPO+ neutrophils (x40). Scale bar in each section indicates 750 υm. C) Socs3 cKO mice were injected with PBS (upper rows) or 20 ng of IL-6 (middle and bottom rows) intradermally with 5 υg of control Fc or IL-20Rβ fusion Fc (IL-20Rβ-Fc). After two weeks, skin sections were stained with H&E and epidermal thickness was measured at the injection site (x200). Scale bar in each section indicates 150 υm. Bar graph (right panel) indicates the mean and SEM (n = 3) of epidermal thickness (υm).
Figure 7
Figure 7. Physical stimulation initiates epidermal hyperplasia.
A) mRNA was prepared from the skin of healthy K5-Cre (Normal), the shaved Socs3 cKO mice (Shaved) and the diseased Socs3 cKO mice (Diseased), and analyzed for the expression of the indicated genes by SYBR green real-time qPCR analysis. B) Immunohistochemical staining of keratinocytes (K5, left panels) and IL-19 positive cells (IL-19, left panels) in epidermis and dermis of K5-Cre (WT), Socs3 cKO mice and Socs3 cKO mice crossed with Il6 KO mice (Socs3 cKO X Il6 KO) (x40). Scale bar in each section indicates 750 υm. C) The role of IL-6 on the development of epidermal hyperplasia in Socs3 cKO mice. B6, Socs3 cKO mice, Socs3 cKO mice crossed with Il6 +/− or Il6 KO mice were studied. The square area of epidermis (0.25 mm2) in the section was measured at day 5 after shaving and is indicated on the Y-axis. Data are mean of the square size and error bars indicate SEM (n = 3). D) Effect of PLGA-P6 on physical stimulation-induced epidermal hyperplasia in Socs3 cKO mice. Left; The dorsal skin area of Socs3 cKO was shaved with depilatory cream and PLGA-P6 (1 mg or 2 mg) or PBS was injected intradermally into the shaved area. The shaved area (Shaved) was then compared to the non-treated area (Normal). At day 5 after shaving, skin sections were examined by H&E staining to assess the appearance of hyperplasia. The images are representative of three independent experiments (x40). Scale bar in each section indicates 750 υm. Right; the square size of the epidermis (0.25 mm2) in the sections shown in the left image was measured at day 5 after shaving and is indicated on the Y-axis. Data are mean of the square size and error bars indicate SEM (n = 3).

Similar articles

Cited by

References

    1. Kubo M, Hanada T, Yoshimura A. Suppressors of cytokine signaling and immunity. Nat Immunol. 2003;4:1169–1176. - PubMed
    1. Yoshimura A, Naka T, Kubo M. SOCS proteins, cytokine signalling and immune regulation. Nat Rev Immunol. 2007;7:454–465. - PubMed
    1. Zhu BM, Ishida Y, Robinson GW, Pacher-Zavisin M, Yoshimura A, et al. SOCS3 negatively regulates the gp130-STAT3 pathway in mouse skin wound healing. J Invest Dermatol. 2008;128:1821–1829. - PubMed
    1. Margadant C, Charafeddine RA, Sonnenberg A. Unique and redundant functions of integrins in the epidermis. FASEB J. 2010;24:4133–4152. - PubMed
    1. Wullaert A, Bonnet MC, Pasparakis M. NF-kappaB in the regulation of epithelial homeostasis and inflammation. Cell Res. 2011;21:146–158. - PMC - PubMed

Publication types

MeSH terms