

The cervical microbiome over 7 years and a comparison of methodologies for its characterization
- PMID: 22792313
- PMCID: PMC3392218
- DOI: 10.1371/journal.pone.0040425
The cervical microbiome over 7 years and a comparison of methodologies for its characterization
Abstract
Background: The rapidly expanding field of microbiome studies offers investigators a large choice of methods for each step in the process of determining the microorganisms in a sample. The human cervicovaginal microbiome affects female reproductive health, susceptibility to and natural history of many sexually transmitted infections, including human papillomavirus (HPV). At present, long-term behavior of the cervical microbiome in early sexual life is poorly understood.
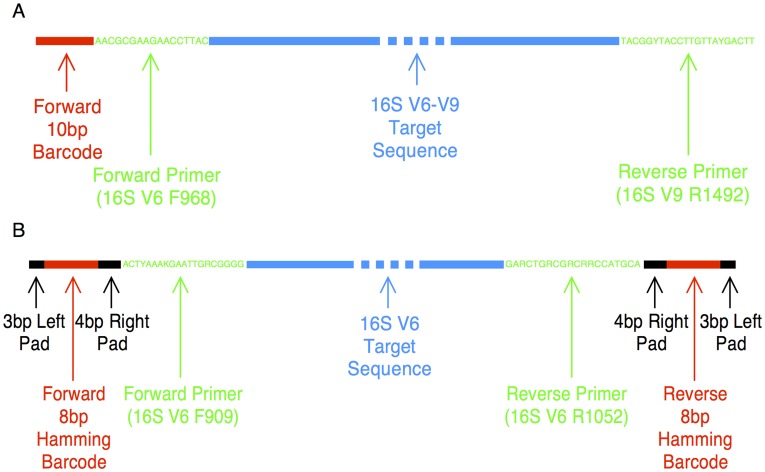
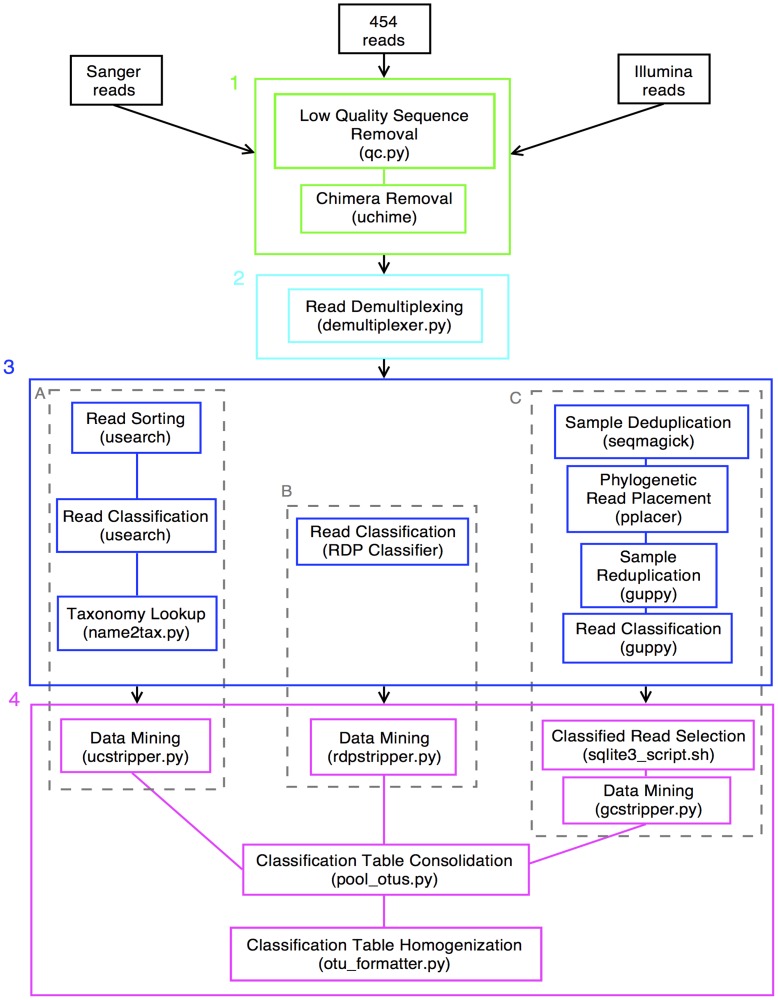
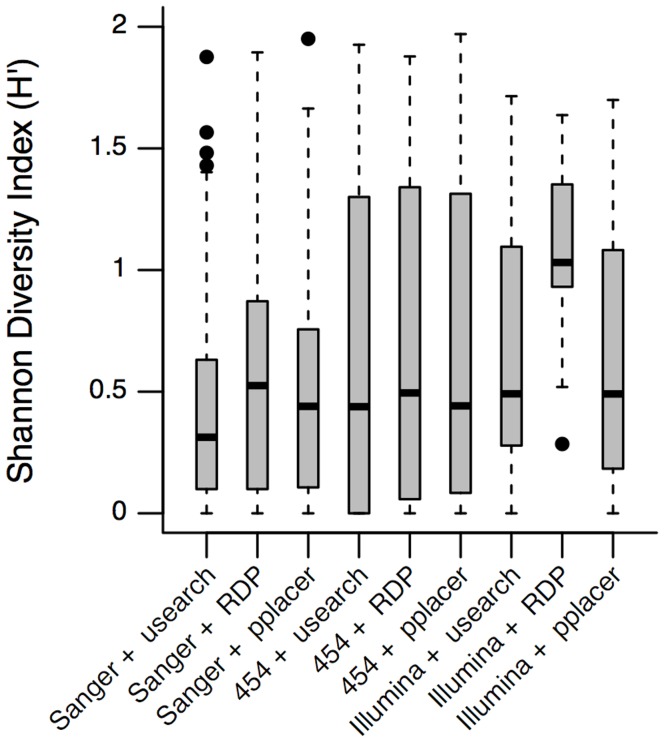
Methods: The V6 and V6-V9 regions of the 16S ribosomal RNA gene were amplified from DNA isolated from exfoliated cervical cells. Specimens from 10 women participating in the Natural History Study of HPV in Guanacaste, Costa Rica were sampled successively over a period of 5-7 years. We sequenced amplicons using 3 different platforms (Sanger, Roche 454, and Illumina HiSeq 2000) and analyzed sequences using pipelines based on 3 different classification algorithms (usearch, RDP Classifier, and pplacer).
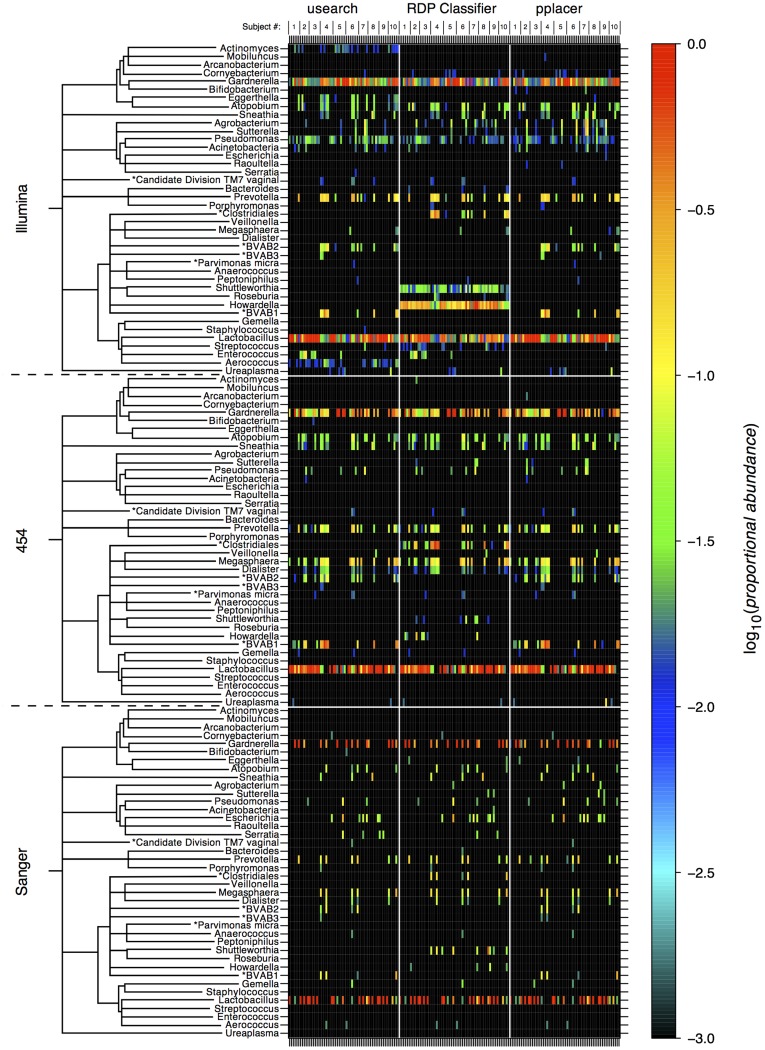
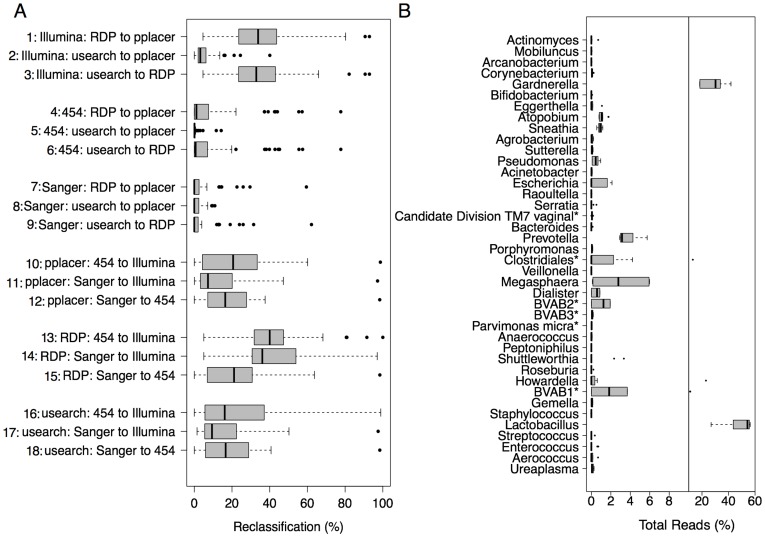
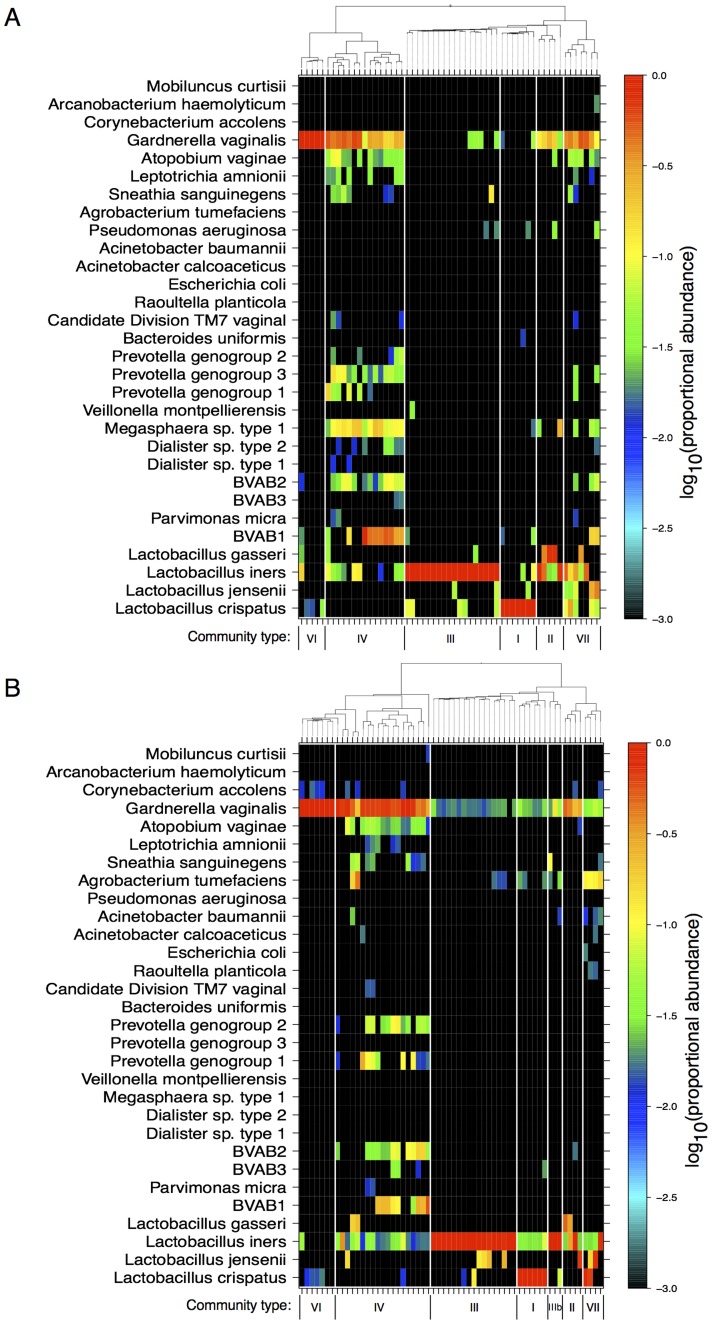
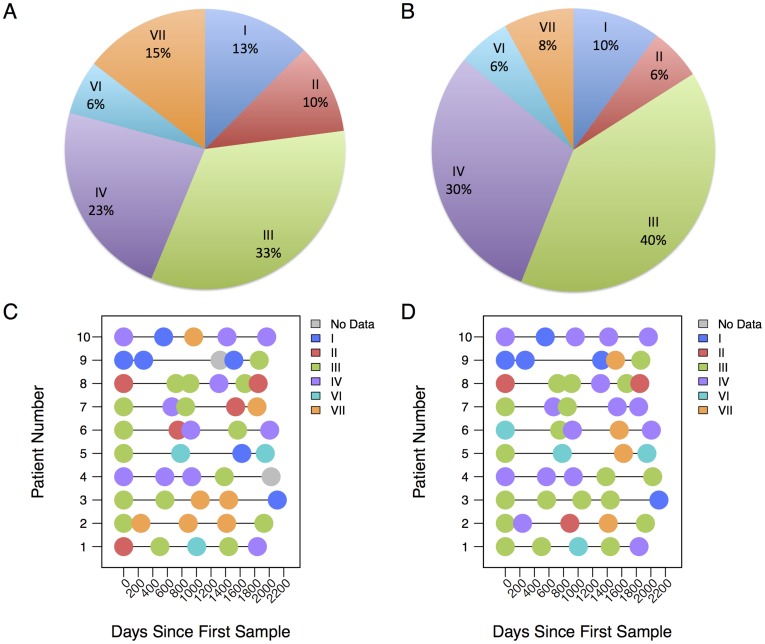
Results: Usearch and pplacer provided consistent microbiome classifications for all sequencing methods, whereas RDP Classifier deviated significantly when characterizing Illumina reads. Comparing across sequencing platforms indicated 7%-41% of the reads were reclassified, while comparing across software pipelines reclassified up to 32% of the reads. Variability in classification was shown not to be due to a difference in read lengths. Six cervical microbiome community types were observed and are characterized by a predominance of either G. vaginalis or Lactobacillus spp. Over the 5-7 year period, subjects displayed fluctuation between community types. A PERMANOVA analysis on pairwise Kantorovich-Rubinstein distances between the microbiota of all samples yielded an F-test ratio of 2.86 (p<0.01), indicating a significant difference comparing within and between subjects' microbiota.
Conclusions: Amplification and sequencing methods affected the characterization of the microbiome more than classification algorithms. Pplacer and usearch performed consistently with all sequencing methods. The analyses identified 6 community types consistent with those previously reported. The long-term behavior of the cervical microbiome indicated that fluctuations were subject dependent.
Conflict of interest statement
Figures
Similar articles
-
Hot topic: 16S rRNA gene sequencing reveals the microbiome of the virgin and pregnant bovine uterus.J Dairy Sci. 2017 Jun;100(6):4953-4960. doi: 10.3168/jds.2017-12592. Epub 2017 Apr 21. J Dairy Sci. 2017. PMID: 28434745 Free PMC article.
-
Relationship between the Cervical Microbiome, HIV Status, and Precancerous Lesions.mBio. 2019 Feb 19;10(1):e02785-18. doi: 10.1128/mBio.02785-18. mBio. 2019. PMID: 30782659 Free PMC article.
-
Species classifier choice is a key consideration when analysing low-complexity food microbiome data.Microbiome. 2018 Mar 20;6(1):50. doi: 10.1186/s40168-018-0437-0. Microbiome. 2018. PMID: 29554948 Free PMC article.
-
Role of next-generation sequencing in understanding the interactions between human papillomavirus and the cervicovaginal microbiome.Gynecol Obstet Invest. 2013;76(4):195-202. doi: 10.1159/000351309. Epub 2013 May 22. Gynecol Obstet Invest. 2013. PMID: 23711875 Review.
-
Experimental and analytical tools for studying the human microbiome.Nat Rev Genet. 2011 Dec 16;13(1):47-58. doi: 10.1038/nrg3129. Nat Rev Genet. 2011. PMID: 22179717 Free PMC article. Review.
Cited by
-
Diversity of macaque microbiota compared to the human counterparts.Sci Rep. 2018 Oct 22;8(1):15573. doi: 10.1038/s41598-018-33950-6. Sci Rep. 2018. PMID: 30349024 Free PMC article.
-
Stability of temperate coral Astrangia poculata microbiome is reflected across different sequencing methodologies.AIMS Microbiol. 2019 Mar 1;5(1):62-76. doi: 10.3934/microbiol.2019.1.62. eCollection 2019. AIMS Microbiol. 2019. PMID: 31384703 Free PMC article.
-
Microbiomic differences in tumor and paired-normal tissue in head and neck squamous cell carcinomas.Genome Med. 2017 Feb 7;9(1):14. doi: 10.1186/s13073-017-0405-5. Genome Med. 2017. PMID: 28173873 Free PMC article.
-
A Protocol for the Multi-Omic Integration of Cervical Microbiota and Urine Metabolomics to Understand Human Papillomavirus (HPV)-Driven Dysbiosis.Biomedicines. 2020 Apr 8;8(4):81. doi: 10.3390/biomedicines8040081. Biomedicines. 2020. PMID: 32276347 Free PMC article.
-
Alterations of the vaginal microbiome in healthy pregnant women positive for group B Streptococcus colonization during the third trimester.BMC Microbiol. 2022 Dec 21;22(1):313. doi: 10.1186/s12866-022-02730-8. BMC Microbiol. 2022. PMID: 36544085 Free PMC article.
References
-
- Koumans EH, Sternberg M, Bruce C, McQuillan G, Kendrick J, et al. The prevalence of bacterial vaginosis in the United States, 2001–2004; associations with symptoms, sexual behaviors, and reproductive health. Sex Transm Dis. 2007;34:864–869. - PubMed
-
- Witkin SS, Ledger WJ. Complexities of the Uniquely Human Vagina. Science Translational Medicine. 2012;4:132fs111. - PubMed
-
- Castle PE, Hillier SL, Rabe LK, Hildesheim A, Herrero R, et al. An association of cervical inflammation with high-grade cervical neoplasia in women infected with oncogenic human papillomavirus (HPV). Cancer Epidemiol Biomarkers Prev. 2001;10:1021–1027. - PubMed
Publication types
MeSH terms
Substances
Grants and funding
LinkOut - more resources
Full Text Sources
Other Literature Sources
Research Materials
Miscellaneous
