

Annexin A1 and A2: roles in retrograde trafficking of Shiga toxin
- PMID: 22792315
- PMCID: PMC3391278
- DOI: 10.1371/journal.pone.0040429
Annexin A1 and A2: roles in retrograde trafficking of Shiga toxin
Abstract
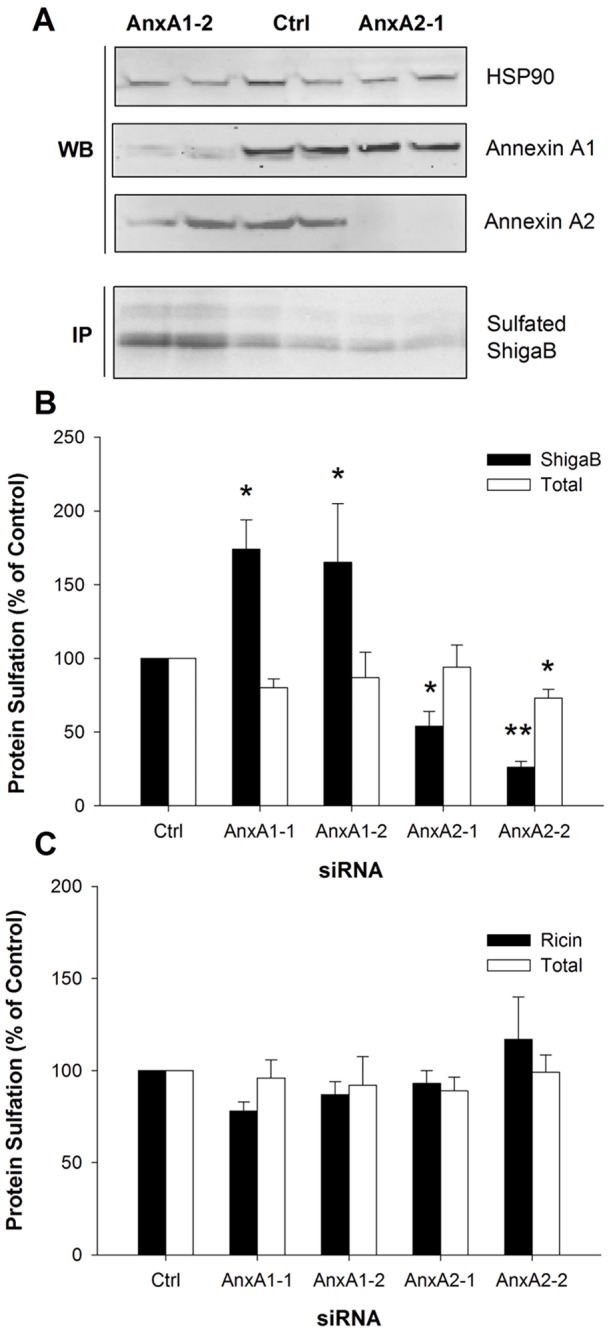
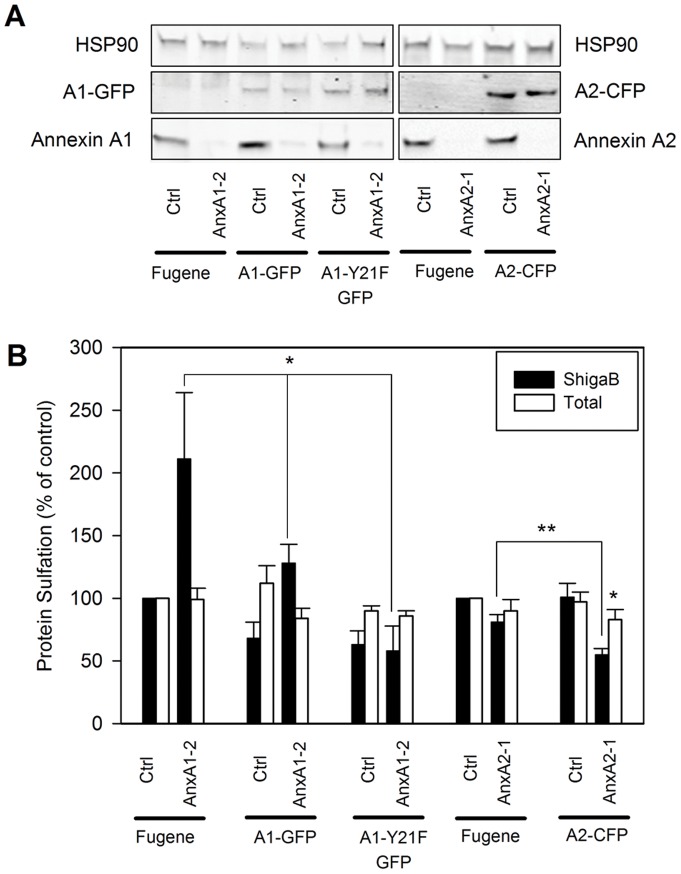
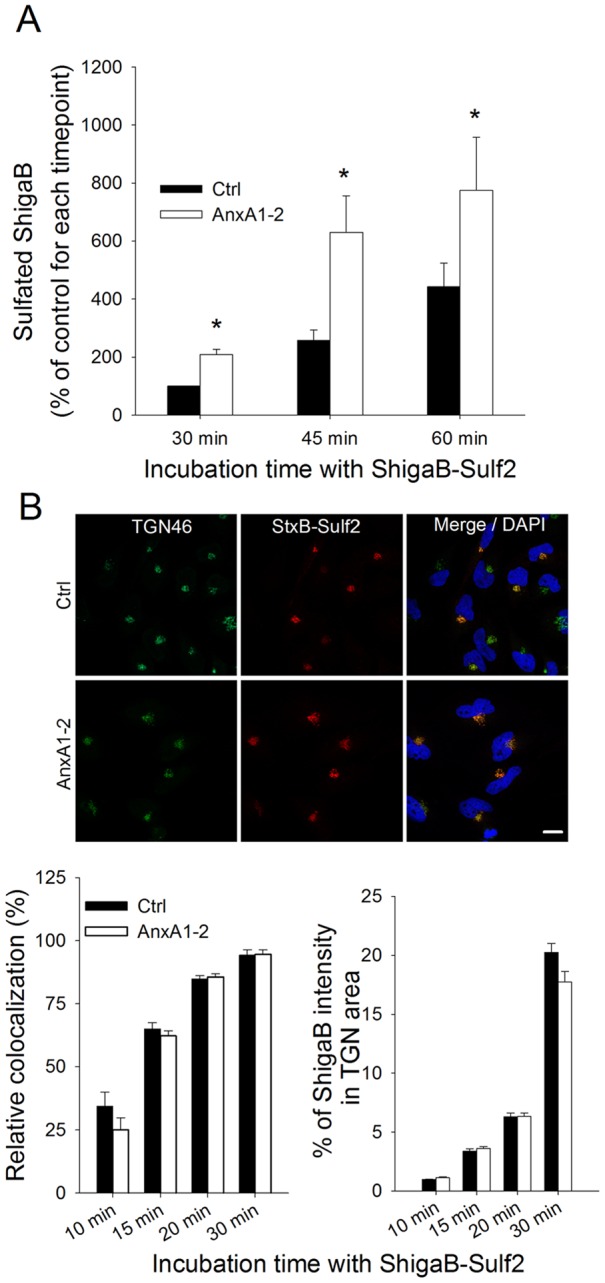
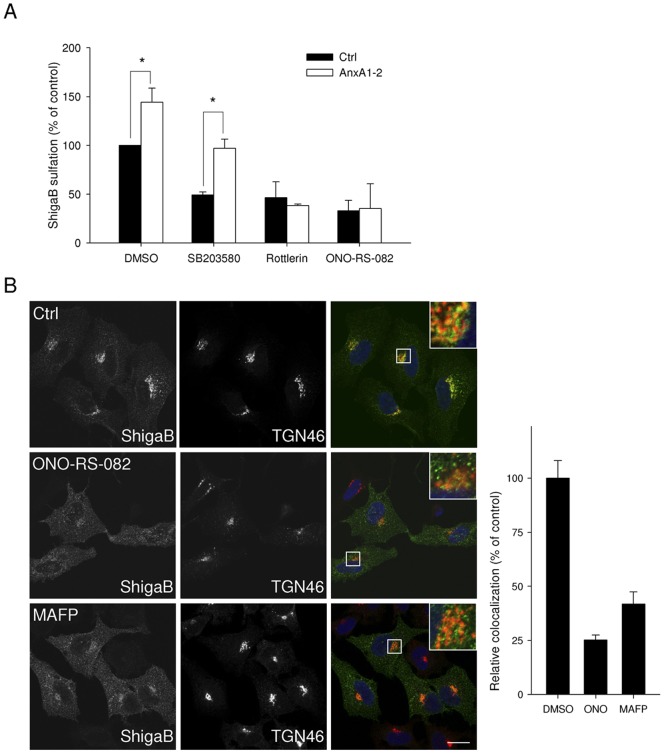
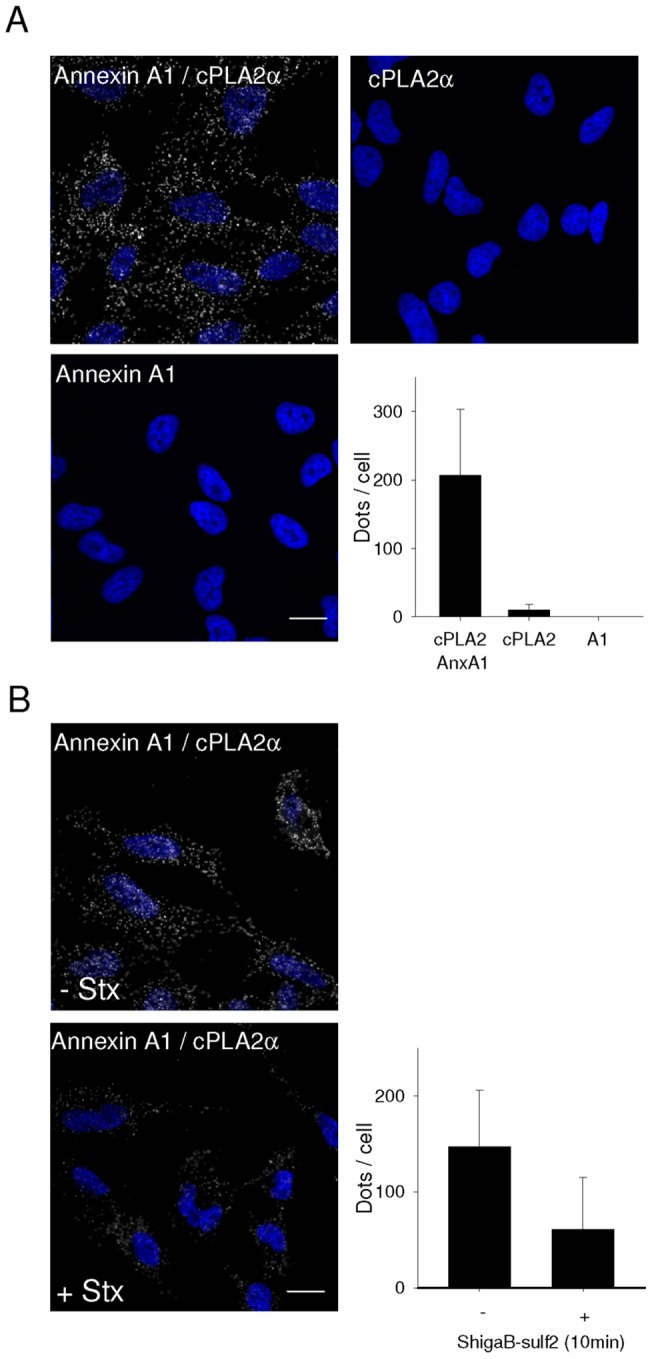
Annexins constitute a family of calcium and membrane binding proteins. As annexin A1 and A2 have previously been linked to various membrane trafficking events, we initiated this study to investigate the role of these annexins in the uptake and intracellular transport of the bacterial Shiga toxin (Stx) and the plant toxin ricin. Once endocytosed, both toxins are retrogradely transported from endosomes to the Golgi apparatus and the endoplasmic reticulum before being targeted to the cytosol where they inhibit protein synthesis. This study was performed to obtain new information both about toxin transport and the function of annexin A1 and annexin A2. Our data show that depletion of annexin A1 or A2 alters the retrograde transport of Stx but not ricin, without affecting toxin binding or internalization. Knockdown of annexin A1 increases Golgi transport of Stx, whereas knockdown of annexin A2 slightly decreases the same transport step. Interestingly, annexin A1 was found in proximity to cytoplasmic phospholipase A2 (cPLA(2)), and the basal as well as the increased Golgi transport of Stx upon annexin A1 knockdown is dependent on cPLA(2) activity. In conclusion, annexin A1 and A2 have different roles in Stx transport to the trans-Golgi network. The most prominent role is played by annexin A1 which normally works as a negative regulator of retrograde transport from the endosomes to the Golgi network, most likely by complex formation and inhibition of cPLA(2).
Conflict of interest statement
Figures
Similar articles
-
The Mitogen-activated protein kinase p38 links Shiga Toxin-dependent signaling and trafficking.Mol Biol Cell. 2008 Jan;19(1):95-104. doi: 10.1091/mbc.e07-06-0565. Epub 2007 Oct 24. Mol Biol Cell. 2008. PMID: 17959827 Free PMC article.
-
Sorting nexin 8 regulates endosome-to-Golgi transport.Biochem Biophys Res Commun. 2009 Dec 4;390(1):109-14. doi: 10.1016/j.bbrc.2009.09.076. Epub 2009 Sep 24. Biochem Biophys Res Commun. 2009. PMID: 19782049
-
Interplay between toxin transport and flotillin localization.PLoS One. 2010 Jan 22;5(1):e8844. doi: 10.1371/journal.pone.0008844. PLoS One. 2010. PMID: 20107503 Free PMC article.
-
Pathways followed by ricin and Shiga toxin into cells.Histochem Cell Biol. 2002 Feb;117(2):131-41. doi: 10.1007/s00418-001-0346-2. Epub 2001 Nov 20. Histochem Cell Biol. 2002. PMID: 11935289 Review.
-
Transport of protein toxins into cells: pathways used by ricin, cholera toxin and Shiga toxin.FEBS Lett. 2002 Oct 2;529(1):49-53. doi: 10.1016/s0014-5793(02)03182-4. FEBS Lett. 2002. PMID: 12354612 Review.
Cited by
-
Cross-linking of glycosphingolipids at the plasma membrane: consequences for intracellular signaling and traffic.Cell Mol Life Sci. 2016 Mar;73(6):1301-16. doi: 10.1007/s00018-015-2049-1. Epub 2015 Sep 25. Cell Mol Life Sci. 2016. PMID: 26407609 Free PMC article.
-
Heterotetrameric annexin A2/S100A10 (A2t) is essential for oncogenic human papillomavirus trafficking and capsid disassembly, and protects virions from lysosomal degradation.Sci Rep. 2018 Aug 3;8(1):11642. doi: 10.1038/s41598-018-30051-2. Sci Rep. 2018. PMID: 30076379 Free PMC article.
-
Annexin A1 complex mediates oxytocin vesicle transport.J Neuroendocrinol. 2013 Dec;25(12):1241-1254. doi: 10.1111/jne.12112. J Neuroendocrinol. 2013. PMID: 24118254 Free PMC article.
-
Annexin-Membrane Interactions Across Eukaryotic Domains of Life-A Comparative Approach.Int J Mol Sci. 2025 Jul 7;26(13):6517. doi: 10.3390/ijms26136517. Int J Mol Sci. 2025. PMID: 40650293 Free PMC article. Review.
-
Retrograde transport of protein toxins through the Golgi apparatus.Histochem Cell Biol. 2013 Sep;140(3):317-26. doi: 10.1007/s00418-013-1111-z. Epub 2013 Jun 14. Histochem Cell Biol. 2013. PMID: 23765164 Review.
References
-
- Sandvig K, Torgersen ML, Engedal N, Skotland T, Iversen TG. Protein toxins from plants and bacteria: probes for intracellular transport and tools in medicine. FEBS Lett. 2010;584:2626–2634. - PubMed
-
- Sandvig K, van Deurs B. Delivery into cells: lessons learned from plant and bacterial toxins. Gene Ther. 2005;12:865–872. - PubMed
-
- Lauvrak SU, Torgersen ML, Sandvig K. Efficient endosome-to-Golgi transport of Shiga toxin is dependent on dynamin and clathrin. J Cell Sci. 2004;117:2321–2331. - PubMed
-
- Popoff V, Mardones GA, Tenza D, Rojas R, Lamaze C, et al. The retromer complex and clathrin define an early endosomal retrograde exit site. J Cell Sci. 2007;120:2022–2031. - PubMed
Publication types
MeSH terms
Substances
LinkOut - more resources
Full Text Sources
Molecular Biology Databases
Research Materials
Miscellaneous
