. 2012;7(7):e40457.
doi: 10.1371/journal.pone.0040457. Epub 2012 Jul 11.

Identification of VHY/Dusp15 as a regulator of oligodendrocyte differentiation through a systematic genomics approach

Affiliations

Identification of VHY/Dusp15 as a regulator of oligodendrocyte differentiation through a systematic genomics approach

Fanny Schmidt et al. PLoS One. 2012.

Abstract

Multiple sclerosis (MS) is a neuroinflammatory disease characterized by a progressive loss of myelin and a failure of oligodendrocyte (OL)-mediated remyelination, particularly in the progressive phases of the disease. An improved understanding of the signaling mechanisms that control differentiation of OL precursors may lead to the identification of new therapeutic targets for remyelination in MS. About 100 mammalian Protein Tyrosine Phosphatases (PTPs) are known, many of which are involved in signaling both in health and disease. We have undertaken a systematic genomic approach to evaluate PTP gene activity in multiple sclerosis autopsies and in related in vivo and in vitro models of the disease. This effort led to the identification of Dusp15/VHY, a PTP previously believed to be expressed only in testis, as being transcriptionally regulated during OL differentiation and in MS lesions. Subsequent RNA interference studies revealed that Dusp15/VHY is a key regulator of OL differentiation. Finally, we identified PDGFR-beta and SNX6 as novel and specific Dusp15 substrates, providing an indication as to how this PTP might exert control over OL differentiation.


Conflict of interest statement

Competing Interests: RvH, FS, CA, SP, RPG, and SC are affiliated to the Merck Serono company. GS is currently affiliated to the OM Pharma company. MvdE and GS were affiliated to Merck Serono at the time the data were produced. This does not alter the authors’ adherence to all the PLoS ONE policies on sharing data and materials. The study does not involve any patent or product in development.

Figures

Figure 1
Figure 1. Schematic overview of the experimental approach.
Figure 2
Figure 2. Differential gene expression of PTP family members in MS white and gray matter lesions.
Data were expressed as a ratio of % expression vs HKGs between two samples (fold change) and represented in a volcano plot diagram (y: Pvalue; x: fold change). An intensive modulation is characterized by spread values close to the x axis (magnification in square). NAWM, Normal-appearing White Matter; NAGM, Normal-appearing Grey Matter; WML, White Matter Lesion; GML, Gray Matter Lesion; CGM, Control gray Matter; CWM, Control White Matter. Major changes occur in lesioned areas and are more intensive in white matter.
Figure 3
Figure 3. Comparative q-PCR-based differential gene expression and selection of PTPs of interest.
The number of PTPs modulated are indicated for each sample type and classified by fold induction range. A gene is considered as significantly modulated when Pval<0.05. Statistical analysis was performed using one tail student’s t-tests. A Venn diagram was used to represent the 16 PTPs modulated within the three sample types.
Figure 4
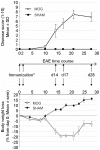
Figure 4. Disease course of mice undergoing EAE after immunization with rat MOG35-55.
*Mice were immunized s.c. with rat MOG 35−55. Pertussis toxin was administered i.p. at day 0 and day 2. 12 animals per group were included in this study. Neurological impairment was monitored using a ten-point standardized rating scale and expressed as Mean ± Standard Deviation. Spinal cord and cerebellum were taken at day14 (D14), day17 (D17) and day28 (D28) in MOG-induced (n = 4) and SHAM mice (n = 4). The body weight was monitored over the disease time course and the body weight loss ± SEM was reported. Disease onset occurred at day 10 and reached a maximum at day 22.
Figure 5
Figure 5. PTPs the most strongly modulated during EAE in mice spinal cord and cerebellum.
Number of PTP genes significantly modulated during the EAE time course in the spinal cord and in the cerebellum has been monitored and represented in two graphics. The number of PTP genes modulated increases dramatically over time. At day 28, the number of PTP genes modulated decreases until a basal level in cerebellum but remains high in the spinal cord. The highest fold changes in gene expression versus Sham animals have been reported in the table. Most of these PTPs have already been described in inflammatpry processes. Statistical analysis were performed using student t-test.
Figure 6
Figure 6. Expression of OL markers and PTP genes over time in fetal mouse mixed cortical cultures.
A. mRNA expression of myelin markers CNP, MBP and PLP and the OPC marker cspg4 measured by qPCR. Results are expressed as fold change ± SEM corresponding to the ratio between % of gene expression vs HKGs at day in vitro (DIV) 8, 12 or 15 and % of gene expression vs HKGs at DIV5. Myelin markers expression increases during culture maturation, reflecting OPCs spontaneous differentiation over time. B. The modulation of the expression of the PTP gene family was monitored at DIV5, 8, 12 and 15 and expressed as fold increase vs DIV5. 39 PTPs were found to be modulated at least 2 fold in mouse mixed cortical culture. PTPs included in the final restrictive set are highlighted on the graphic.
Figure 7
Figure 7. Effect of targeted silencing of 10 PTPs of interest on Oli-neu differentiation.
A. mRNA expression analysis of three myelin markers MBP (myelin basic protein), CNP (2’, 3’-cyclic nucleotide 3’-phosphodiesterase), PLP (Proteolipid protein) in si-RNA-transfected olineu after 72 h. % of expression were calculated using the delta Ct method and expressed in fold change versus negative control as Mean ± SEM of three independent experiments performed in triplicate. Knock-down % (KD%) was calculated using the formula 100−(100 x Expression vs HKGs in sample/Expression vs HKGs in control) and was expressed as Mean ± SEM of the same three independent experiments. Statistical analysis was performed using one tail student t-tests. siRNAs targeting Dusp15/VHY induce myelin markers expression. B. Morphological analysis performed by using the Cellomics method at 72 h after transfection with the si-RNA. Processes area per cell defines the mean area regrouping processes surrounding the OL cell body. Each data point was obtained by analysis of at least 100 cells per well automatically and normalized by the number of cells. Results were normalized to negative controls and expressed as Mean ± SEM of at least three different experiments performed in quadruplicate. C. Images of Oli-neu non transfected (right) and transfected with ErbB2 si-RNA (center) or Dusp15/VHY si-RNA (left) immunostained against A2B5 with a Cy3-coupled (red) secondary antibody. Images were acquired using an inverted fluorescence microscope then the black and white mode was inverted using image analysis software to allow better processes visualization. Dusp15/VHY silencing induces Oli-neu morphological differentiation. D. In-Cell ELISA was performed on Oli-neu immunostained against MBP and revealed using the ABTS (2,2′-azino-bis-(3-ethylbenzothiazolin-6-sulfonic acid) colorimetric transformation by horseradish peroxidase coupled to a secondary antibody. Results were normalized to negative controls and expressed as Mean ± SEM of at least three different experiments performed in quadruplicate. E. Western blot analysis of MBP and CNP. Protein expression levels were compared to the internal control β-tubuline. Dusp15/VHY gene knockdown induces an increase in MBP and CNP protein levels.
Figure 8
Figure 8. Correlation chart between MBP expression and dusp15 expression over a time course of differentiation in olineu.
Values expressed as fold induction versus undifferentiated controls (starting cultures) and correspond to the Mean ± SD of two different experiments (n = 2). Dusp15/VHY expression increases with time and correlates with MBP expression during the first steps of Oli-neu differentiation then Dusp15 expression reaches a maximum at 15 h prior to the MBP expression peak occurring at 24 h.
Figure 9
Figure 9. Correlation chart between MBP expression and dusp15 expression over a time course of differentiation in mouse primary cortical cultures.
Values expressed as fold induction versus DIV5 cultures and correspond to the Mean ± SD of two different experiments (n = 3). Dusp15/VHY expression increases with time and correlates with MBP expression until DIV12 then reaches a maximum whereas MBP expression still increases until DIV15.
Figure 10
Figure 10. Phosphatase activity of GST-tagged full length Dusp15/VHY.
A. Dusp15 phosphatase activity was assessed using the DiFMUP (6,8-difluoro-4-methyumbelliferyl phosphate) assay at the experimentally optimal enzyme concentration of 4 ng/mL. B. Optimal pH activity (pH 6) was determined by testing a pH range from pH 3 to 8. C. and D. Activity of Dusp15/VHY on phospho-peptides substrates corresponding respectively to pY119 and pY771 dephosphorylation sites of SNX6 (NED(pY119)AGYIIPPAP) and PDGFR-β (IESSN(pY771)MAPYD). VHY/Dusp15 was used at 4 ng/mL at pH6 and activity was detected using the Malachite Green phosphate detection assay. OD, Optical Density at 620 nm. Dissociation constant (Km) was calculated as the substrate concentration needed to reach Vmax/2 and expressed as Mean ± SEM of three different experiments.
Figure 11
Figure 11. Identification of VHY potential substrates using phospho-peptides arrays.
Each graphic correspond to the results expressed as optical density in arbitrary unites (a.u.) arising from two different arrays representing 720 different phospho-peptides. An arbitrary threshold allowed for the selection of the three phospho-peptides hits of each array namely (1) PDGFR-β (Platelet-derived Growth Factor Receptor beta); MK13 (MAPKinase 13/p38MAPKdelta); ATF2 (Activating Transcription Factor 2); SNX6 (Sorting Nexin 6); IF (Intrinsic factor); ErbB3 (v-erb-b2 erythroblastic leukemia viral oncogene homolog 3). Arrays were ran at pH6 with an enzyme concentration of 2 ng/mL.

Similar articles

Cited by

References

    1. Chang A, Nishiyama A, Peterson J, Prineas J, Trapp BD. NG2-positive oligodendrocyte progenitor cells in adult human brain and multiple sclerosis lesions. J Neurosci. 2000;20:6404–6412. - PMC - PubMed
    1. Chang A, Tourtellotte WW, Rudick R, Trapp BD. Premyelinating oligodendrocytes in chronic lesions of multiple sclerosis. N Engl J Med. 2002;346:165–173. - PubMed
    1. Taveggia C, Feltri ML, Wrabetz L. Signals to promote myelin formation and repair. Nat Rev Neurol. 2010;6:276–287. - PMC - PubMed
    1. Emery B. Regulation of oligodendrocyte differentiation and myelination. Science. 2010;330:779–782. - PubMed
    1. Jessen KR, Mirsky R. Negative regulation of myelination: relevance for development, injury, and demyelinating disease. Glia. 2008;56:1552–1565. - PubMed

Publication types

MeSH terms