

A novel serum metabolomics-based diagnostic approach for colorectal cancer
- PMID: 22792336
- PMCID: PMC3394708
- DOI: 10.1371/journal.pone.0040459
A novel serum metabolomics-based diagnostic approach for colorectal cancer
Abstract
Background: To improve the quality of life of colorectal cancer patients, it is important to establish new screening methods for early diagnosis of colorectal cancer.
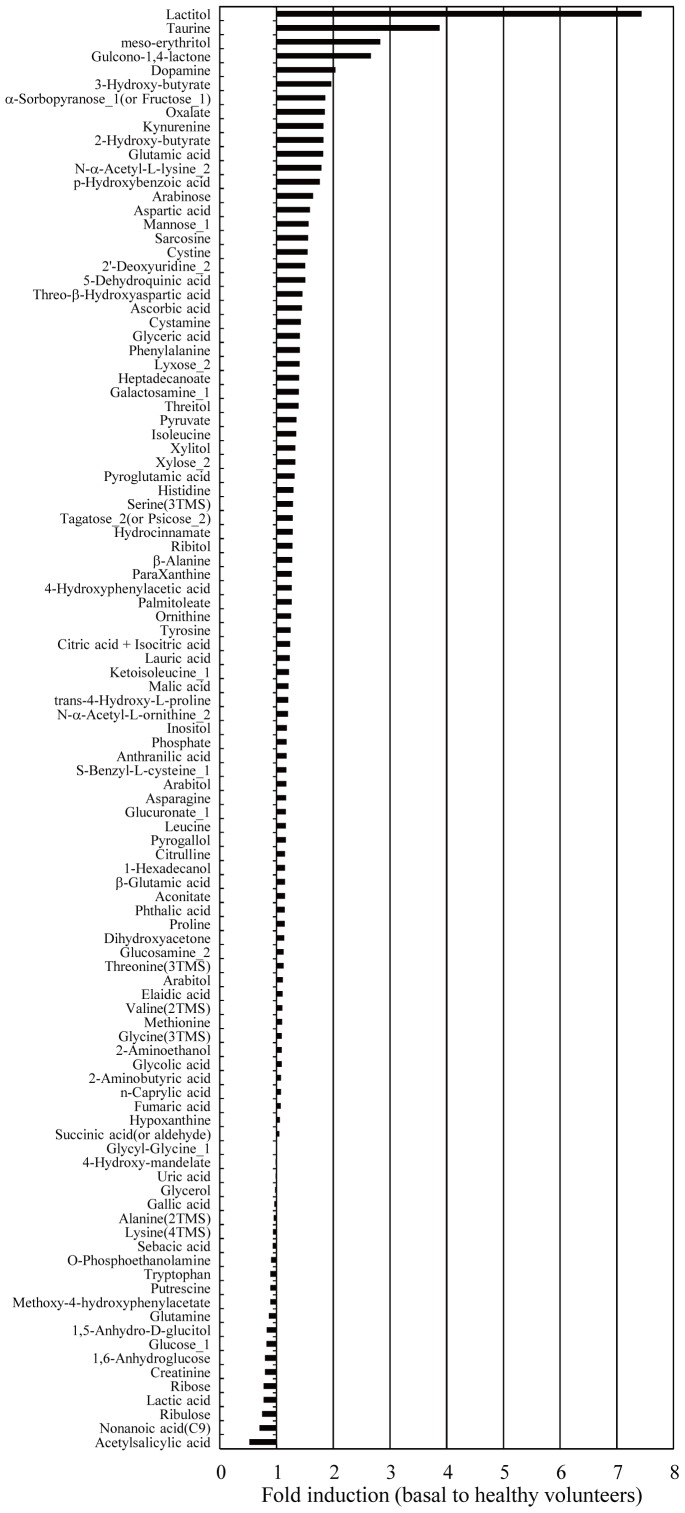
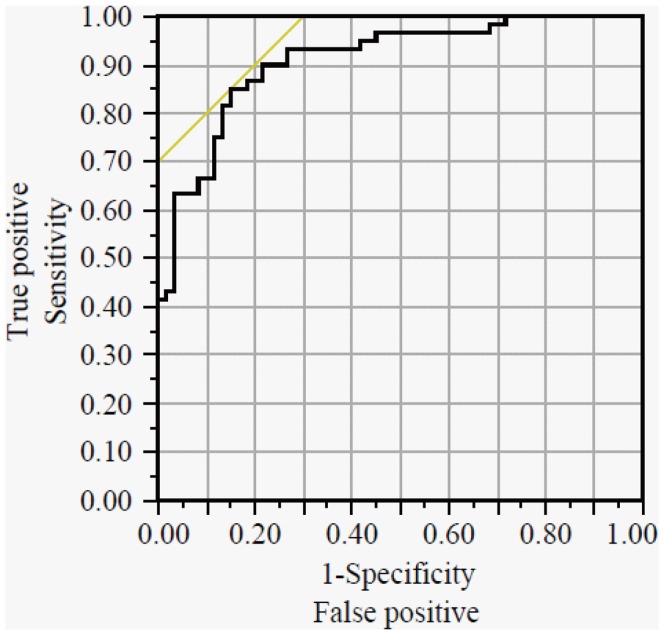
Methodology/principal findings: We performed serum metabolome analysis using gas-chromatography/mass-spectrometry (GC/MS). First, the accuracy of our GC/MS-based serum metabolomic analytical method was evaluated by calculating the RSD% values of serum levels of various metabolites. Second, the intra-day (morning, daytime, and night) and inter-day (among 3 days) variances of serum metabolite levels were examined. Then, serum metabolite levels were compared between colorectal cancer patients (N = 60; N = 12 for each stage from 0 to 4) and age- and sex-matched healthy volunteers (N = 60) as a training set. The metabolites whose levels displayed significant changes were subjected to multiple logistic regression analysis using the stepwise variable selection method, and a colorectal cancer prediction model was established. The prediction model was composed of 2-hydroxybutyrate, aspartic acid, kynurenine, and cystamine, and its AUC, sensitivity, specificity, and accuracy were 0.9097, 85.0%, 85.0%, and 85.0%, respectively, according to the training set data. In contrast, the sensitivity, specificity, and accuracy of CEA were 35.0%, 96.7%, and 65.8%, respectively, and those of CA19-9 were 16.7%, 100%, and 58.3%, respectively. The validity of the prediction model was confirmed using colorectal cancer patients (N = 59) and healthy volunteers (N = 63) as a validation set. At the validation set, the sensitivity, specificity, and accuracy of the prediction model were 83.1%, 81.0%, and 82.0%, respectively, and these values were almost the same as those obtained with the training set. In addition, the model displayed high sensitivity for detecting stage 0-2 colorectal cancer (82.8%).
Conclusions/significance: Our prediction model established via GC/MS-based serum metabolomic analysis is valuable for early detection of colorectal cancer and has the potential to become a novel screening test for colorectal cancer.
Conflict of interest statement
Figures
Similar articles
-
Investigations in the possibility of early detection of colorectal cancer by gas chromatography/triple-quadrupole mass spectrometry.Oncotarget. 2017 Mar 7;8(10):17115-17126. doi: 10.18632/oncotarget.15081. Oncotarget. 2017. PMID: 28179577 Free PMC article.
-
Specificity of metabolic colorectal cancer biomarkers in serum through effect size.Metabolomics. 2020 Aug 13;16(8):88. doi: 10.1007/s11306-020-01707-w. Metabolomics. 2020. PMID: 32789702
-
Serum microRNA signatures and metabolomics have high diagnostic value in colorectal cancer using two novel methods.Cancer Sci. 2018 Apr;109(4):1185-1194. doi: 10.1111/cas.13514. Epub 2018 Feb 26. Cancer Sci. 2018. PMID: 29363233 Free PMC article.
-
A validated metabolomic signature for colorectal cancer: exploration of the clinical value of metabolomics.Br J Cancer. 2016 Sep 27;115(7):848-57. doi: 10.1038/bjc.2016.243. Epub 2016 Aug 25. Br J Cancer. 2016. PMID: 27560555 Free PMC article.
-
Diagnostic performance of serum metabolites biomarker associated with colorectal adenoma: a systematic review.PeerJ. 2024 Sep 20;12:e18043. doi: 10.7717/peerj.18043. eCollection 2024. PeerJ. 2024. PMID: 39314843 Free PMC article.
Cited by
-
A Comprehensive Mass Spectrometry-Based Workflow for Clinical Metabolomics Cohort Studies.Metabolites. 2022 Nov 24;12(12):1168. doi: 10.3390/metabo12121168. Metabolites. 2022. PMID: 36557207 Free PMC article.
-
Targeted UPLC-MS Metabolic Analysis of Human Faeces Reveals Novel Low-Invasive Candidate Markers for Colorectal Cancer.Cancers (Basel). 2018 Sep 1;10(9):300. doi: 10.3390/cancers10090300. Cancers (Basel). 2018. PMID: 30200467 Free PMC article.
-
Development of a colorectal cancer diagnostic model and dietary risk assessment through gut microbiome analysis.Exp Mol Med. 2019 Oct 3;51(10):1-15. doi: 10.1038/s12276-019-0313-4. Exp Mol Med. 2019. PMID: 31582724 Free PMC article.
-
Development and validation of a highly sensitive urine-based test to identify patients with colonic adenomatous polyps.Clin Transl Gastroenterol. 2014 Mar 20;5(3):e54. doi: 10.1038/ctg.2014.2. Clin Transl Gastroenterol. 2014. PMID: 24646506 Free PMC article.
-
Altered metabolite levels and correlations in patients with colorectal cancer and polyps detected using seemingly unrelated regression analysis.Metabolomics. 2017 Nov;13(11):125. doi: 10.1007/s11306-017-1265-0. Epub 2017 Sep 15. Metabolomics. 2017. PMID: 30814918 Free PMC article.
References
-
- Siegel R, Naishadham D, Jemal A. Cancer statistics 2012. CA Cancer J Clin. 2012;62:10–29. - PubMed
-
- Matsuda T, Marugame T, Kamo K, Katanoda K, Ajiki W, et al. Cancer incidence and incidence rates in Japan in 2004: based on data from 14 population based cancer registries in the Monitoring of Cancer Incidence in Japan (MCIJ) project. Jpn J Clin Oncol. 2010;40:1192–1200. - PubMed
-
- Petricoin EF, Ardekani AM, Hitt BA, Levine PJ, Fusaro VA, et al. Use of proteomic patterns in serum to identify ovarian cancer. Lancet. 2002;359:572–527. - PubMed
-
- Hirayama A, Kami K, Sugimoto M, Sugawara M, Toki N, et al. Quantitative metabolome profiling of colon and stomach cancer microenvironment by capillary electrophoresis time-of-flight mass spectrometry. Cancer Res. 2009;69:4918–4925. - PubMed
Publication types
MeSH terms
Substances
LinkOut - more resources
Full Text Sources
Other Literature Sources
Medical
Miscellaneous
