. 2012;7(7):e40501.
doi: 10.1371/journal.pone.0040501. Epub 2012 Jul 9.

Loss of DJ-1 does not affect mitochondrial respiration but increases ROS production and mitochondrial permeability transition pore opening

Affiliations

Loss of DJ-1 does not affect mitochondrial respiration but increases ROS production and mitochondrial permeability transition pore opening

Emilie Giaime et al. PLoS One. 2012.

Abstract

Background: Loss of function mutations in the DJ-1 gene have been linked to recessively inherited forms of Parkinsonism. Mitochondrial dysfunction and increased oxidative stress are thought to be key events in the pathogenesis of Parkinson's disease. Although it has been reported that DJ-1 serves as scavenger for reactive oxidative species (ROS) by oxidation on its cysteine residues, how loss of DJ-1 affects mitochondrial function is less clear.

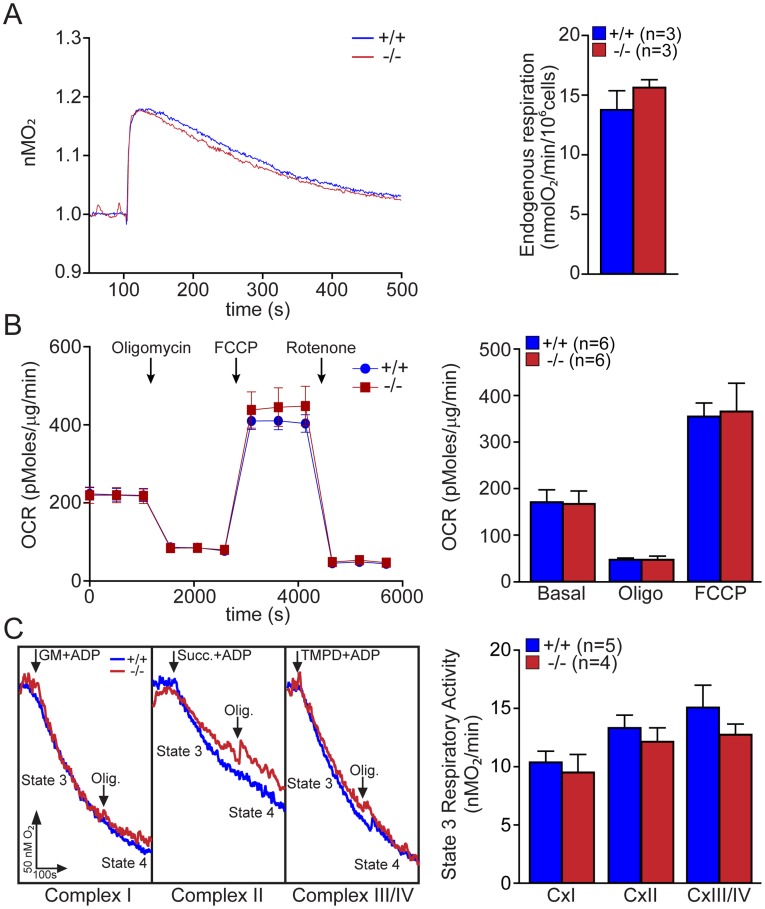
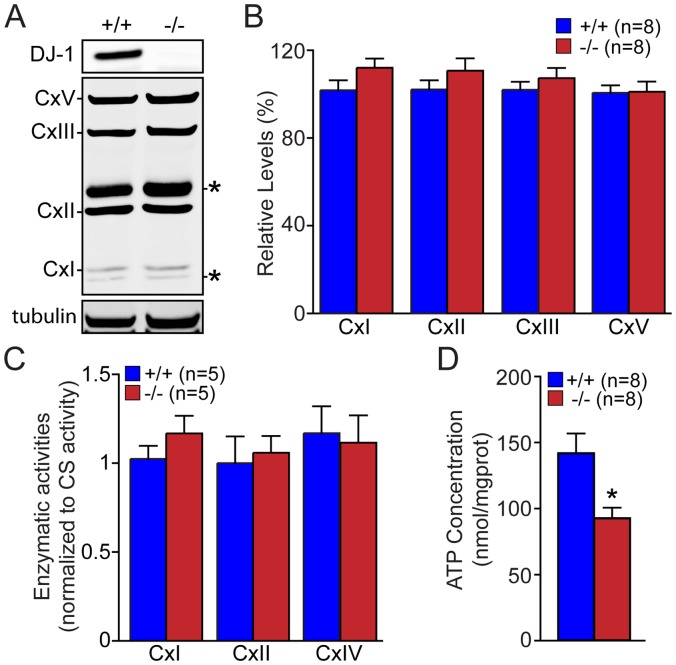
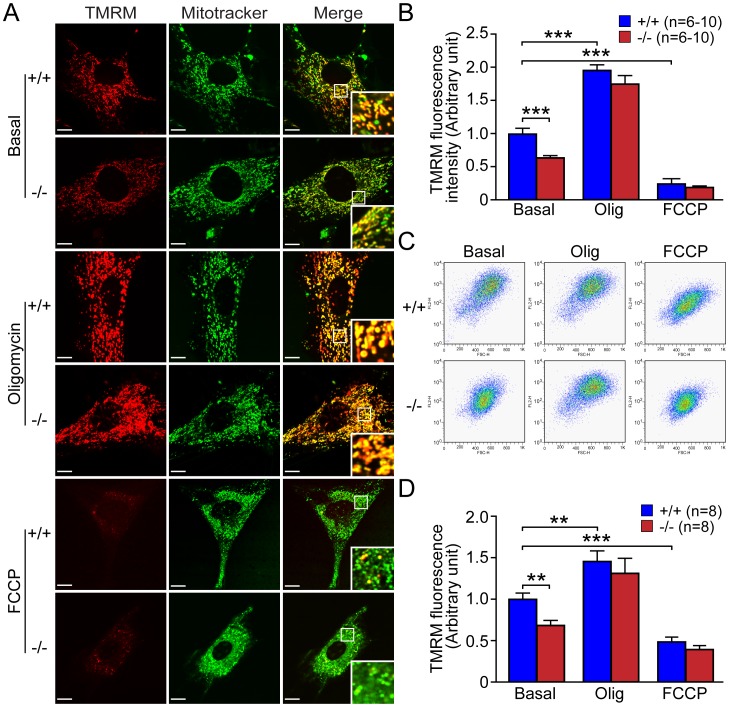
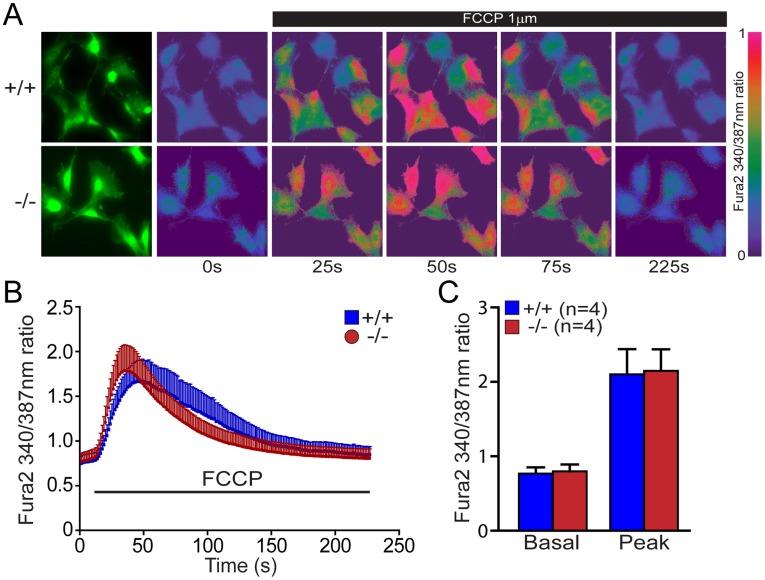
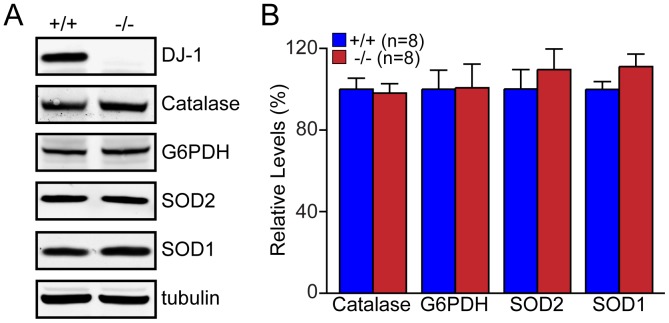
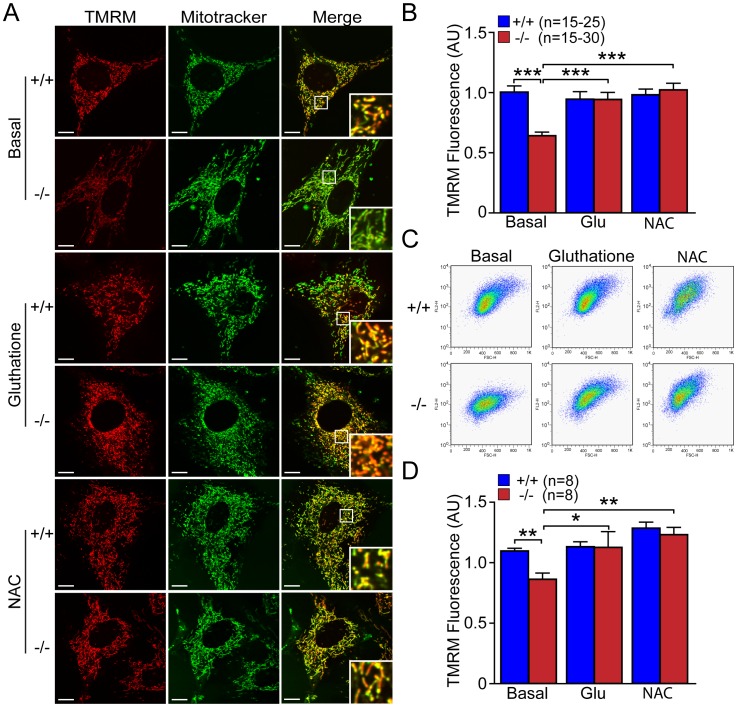
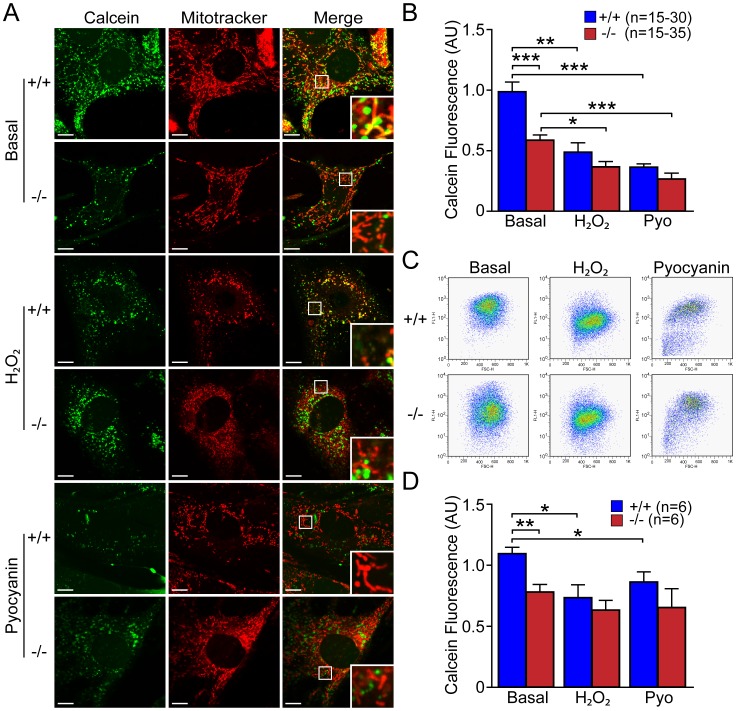
Methodology/principal findings: Using primary mouse embryonic fibroblasts (MEFs) or brains from DJ-1-/- mice, we found that loss of DJ-1 does not affect mitochondrial respiration. Specifically, endogenous respiratory activity as well as basal and maximal respiration are normal in intact DJ-1-/- MEFs, and substrate-specific state 3 and state 4 mitochondrial respiration are also unaffected in permeabilized DJ-1-/- MEFs and in isolated mitochondria from the cerebral cortex of DJ-1-/- mice at 3 months or 2 years of age. Expression levels and activities of all individual complexes composing the electron transport system are unchanged, but ATP production is reduced in DJ-1-/- MEFs. Mitochondrial transmembrane potential is decreased in the absence of DJ-1. Furthermore, mitochondrial permeability transition pore opening is increased, whereas mitochondrial calcium levels are unchanged in DJ-1-/- cells. Consistent with earlier reports, production of reactive oxygen species (ROS) is increased, though levels of antioxidative enzymes are unaltered. Interestingly, the decreased mitochondrial transmembrane potential and the increased mitochondrial permeability transition pore opening in DJ-1-/- MEFs can be restored by antioxidant treatment, whereas oxidative stress inducers have the opposite effects on mitochondrial transmembrane potential and mitochondrial permeability transition pore opening.

Conclusions/significance: Our study shows that loss of DJ-1 does not affect mitochondrial respiration or mitochondrial calcium levels but increases ROS production, leading to elevated mitochondrial permeability transition pore opening and reduced mitochondrial transmembrane potential.


Conflict of interest statement

Competing Interests: The authors have declared that no competing interests exist.

Figures

Figure 1
Figure 1. Normal mitochondrial respiration in intact mitochondria of DJ-1−/− MEFs.
(A) Endogenous respiratory activity in DJ-1−/− and +/+ MEFs. Representative oxygraphs of DJ-1−/− and +/+ MEFs energized with glucose (10 mM) are shown on the left. The bar graph on the right shows oxygen consumption, which represents the endogenous respiratory activity in DJ-1−/− and +/+ MEFs. The data were obtained from three independent experiments using primary MEFs obtained from 3 individual embryos per genotype. (B) Oxygen consumption rate (OCR) profile in DJ-1−/− and +/+ MEFs. OCR profile expressed as pMolesO2/min in control and DJ-1−/− cells are shown on the left. Arrows indicate the time of addition of oligomycin (Oligo, 1 µM), FCCP (4 µM) and rotenone (100 nM). The bar graph on the right shows OCRs normalized to protein concentration after subtraction of rotenone insensitive OCR (nonmitochondrial respiration), under basal condition, after addition of oligomycin (Oligo, 1 µM, proton leak) or FCCP (4 µM, maximal respiration). The data were obtained from three independent experiments using primary MEFs obtained from 6 individual embryos. (C) Energized respiration in DJ-1−/− and +/+ MEFs. Representative traces of respiration rates in the mitochondria in DJ-1−/− and +/+ MEFs are shown on the left. Arrows indicate the application of substrates (complex I: 10 mM glutamate/malate (GM), complex II: succinate (Succ, 10 mM), complex III/IV: 1 mM TMPD/1 mM ascorbate (TMPD)) in the presence of ADP (1 mM) and oligomycin (oligo). The bar graphs on the right show state 3 respiratory activity for complex I, II and III/IV in DJ-1−/− and +/+ MEFs permeabilized with digitonin. The number shown in the panel indicates the number of embryos used to derive primary MEFs per genotype, and the data were obtained from three independent experiments. All data are expressed as the mean ± S.E.
Figure 2
Figure 2. Normal mitochondrial respiration in isolated mitochondria from the cortex of DJ-1−/− mice.
(A) Energized respiration in mitochondria isolated from the cerebral cortex of DJ-1−/− and +/+ mice at 3 months of age. Representative traces of respiration rates in mitochondria isolated from the cortex of DJ-1−/− and littermate control mice are shown on the left. Arrows indicate the time of the application of substrates (complex I: 10 mM glutamate/malate (GM), complex II: succinate (Succ, 10 mM), complex III/IV: 1 mM TMPD/1 mM ascorbate (TMPD)) in the presence of ADP (1 mM). The bar graphs on the right show state 3 and state 4 respiratory activities for complex I, II and III/IV in isolated mitochondria from the cortex of DJ-1−/− and +/+ mice at the age of 3 months. (B) Energized respiration in mitochondria isolated from the cortex of 24–26 months old DJ-1−/− and +/+ mice. Representative traces of respiration rates in mitochondria isolated from the cortex of 24–26 months old DJ-1−/− and control mice are shown on the left. Arrows indicate the time of the application of substrates (complex I: 10 mM glutamate/malate (GM), complex II: succinate (Succ, 10 mM), complex III/IV: 1 mM TMPD/1 mM ascorbate (TMPD)) in the presence of ADP (1 mM). The bar graphs on the right show state 3 and state 4 respiratory activities for complex I, II and III/IV in isolated mitochondria from the cortex of DJ-1−/− and control mice at 24–26 months of age. The number shown in the panel indicates the number of mice used in the study. All data are expressed as the mean ± S.E.
Figure 3
Figure 3. Decreased ATP concentration in DJ-1−/− MEFs.
(A, B) Western analysis of each subunit in the oxidative phosphorylation (OXPHOS) complex in DJ-1−/− and +/+ MEFs. (A) Representative western blot showing relative expression of each subunit. Tubulin was used as loading control. Non-specific bands are marked by asterisk. (B) The bar graph shows the quantification and normalization of the expression level of each subunit using tubulin as loading control. (C) Enzymatic activities of complexes I, II and IV of the mitochondrial electron transport system, as measured by spectrophotometric assays and after normalization to citrate synthase activity (CS). (D) The bar graph shows decreased ATP concentrations in DJ-1−/− MEFs compared to control cells. The number shown in the panel indicates the number of embryos used to derive primary MEFs per genotype, and the data were obtained from three independent experiments. All data are expressed as mean ± SEM. *p<0.05.
Figure 4
Figure 4. Reduced mitochondrial membrane potential (ΔΨm) in DJ-1−/− MEFs.
(A, B) Confocal microscopic analysis. (A) Representative confocal microscopic images of DJ-1−/− and +/+ MEFs after staining with TMRM (50 nM, red) and Mitotracker Green (200 nM) in the presence or absence of oligomycin (Olig, 1 µM) or FCCP (10 µM). The intensity of TMRM reflects the level of ΔΨm, whereas the intensity of Mitotracker Green is not affected by transmembrane potential. Insets in panels indicate higher power views of the boxed area. Scale bar: 10 µm. (B) The bar graph shows quantification of TMRM signal in DJ-1−/− and +/+ MEFs in the presence or absence of oligomycin or FCCP. The TMRM signal is reduced in DJ-1−/− cells relative to wild-type cells, whereas the TMRM signal is increased or decreased in both DJ-1−/− and +/+ cells following oligomycin or FCCP treatment, respectively. The number shown in the panel indicates the number of cells quantified per genotype in the study. (C, D) FACS analysis. (C) Representative flow cytometric dot plots show the intensity of TMRM signal in DJ-1−/− and +/+ MEFs following incubation with TMRM (50 nM) in the presence or absence of oligomycin (1 µM) or FCCP (10 µM). (D) The bar graph shows quantification of TMRM signal measured by FACS analysis in DJ-1−/− and +/+ MEFs. The number shown in the panel indicates the number of embryos used to derive primary MEFs per genotype, and the data were obtained from five independent experiments. All data are expressed as mean ± SEM. **p<0.01, ***p<0.001.
Figure 5
Figure 5. Increased opening of mitochondrial permeability transition pore in DJ-1−/− cells.
(A, B) Confocal microscopy analysis. (A) Representative confocal microscopic images of DJ-1−/− and +/+ MEFs after incubation with calcein-AM (1 µM, green) and Mitotracker Red (150 nM) in the presence or absence of Co2+ (1 mM), which quenches calcein fluorescence (green) outside of mitochondria. Mitotracker Red confirms the localization of calcein fluorescence in mitochondria. Insets indicate higher power views of the boxed area in the panel. The calcein fluorescence in mitochondria is lower in DJ-1−/− cells in the presence of Co2+. In the absence of Co2+, calcein fluorescent signals are very intense and are present in the entire cell, and there are no genotypic differences. Scale bar: 10 µm. (B) The bar graph shows quantification of calcein fluorescence in DJ-1−/− and +/+ cells in the presence or absence of Co2+. The number shown in the panel indicates the number of cells quantified per genotype in the study. (C, D) FACS analysis. (C) Representative flow cytometric dot plots show the intensity of calcein signal in DJ-1−/− and +/+ MEFs following incubation with calcein-AM (1 µM) in the presence or absence of Co2+ (1 mM). (D) The bar graph of calcein signal measured by FACS analysis shows reduced calcein signal in DJ-1−/− MEFs in the presence of Co2+. The number shown in the panel indicates the number of embryos used to derive primary MEFs per genotype, and the data were obtained from five independent experiments. All data are expressed as mean ± SEM. *p<0.05, ***p<0.001.
Figure 6
Figure 6. Normal levels of mitochondrial calcium in DJ-1−/− cells.
(A) Representative Fura-2 images of Ca2+ responses following FCCP treatment in DJ-1−/− and +/+ MEFs. Fura-2 ratios at 340/387 are shown at time points indicated. The green fluorescence images show the shape of the DJ-1−/− and +/+ MEFs. The pseudocolor calibration scale for 340/387 ratios is shown on the right. FCCP (1 µM) was added at t = 25 s. (B) Time course of cytosolic [Ca2+] rise following FCCP treatment in DJ-1−/− and +/+ MEFs. (C) The basal and the peak value of cytosolic calcium rise following FCCP are the same in DJ-1−/− and +/+ MEFs. The number shown in the panel indicates the number of embryos used to derive primary MEFs, and the data were obtained from three independent experiments. All data are expressed as mean ± SEM.
Figure 7
Figure 7. Increased reactive oxygen species (ROS) production in DJ-1−/− MEFs.
(A, B) Confocal microscopy analysis of ROS concentration. (A) Representative confocal live cell images of DJ-1−/− and +/+ MEFs after incubation with Mitotracker Green (200 nM) and Amplex Red (2.5 µM), DHEt (2.5 µM) or MitoSOX Red (2.5 µM). Scale bar: 10 µm. (B) The bar graph shows the quantification and the increase of Amplex Red, DHEt or MitoSOX Red fluorescence in DJ-1−/− cells compared to control cells. The number shown in the panel indicates the number of cells quantified per genotype in the study. (C) Kinetics analysis of ROS production. The time course of the fluorescence changes in DJ-1−/− and +/+ MEFs labeled with Amplex Red (upper), DHEt (middle), or Mitotracker CM-H2XROS (lower) is shown. The bar graph at the bottom shows quantitative analysis of fluorescence changes, indicating significant increases of fluorescence signals of Amplex Red, DHEt and Mitotracker CM-H2XROS in DJ-1−/− MEFs. The number shown in the panel indicates the number of embryos used to derive primary MEFs per genotype, and the data were obtained from four independent experiments. (D) Kinetics of H2O2 production in isolated mitochondria measured by following Amplex Red fluorescence over time showing an increase of its production in DJ-1−/− MEFs. The number shown in the panel indicates the number of embryos used to derive primary MEFs per genotype, and the data were obtained from three independent experiments. All data are expressed as the mean ± S.E. *p<0.05, ***p<0.001.
Figure 8
Figure 8. Normal levels of antioxidant proteins in DJ-1−/− MEFs.
(A) Representative western blot showing expression levels of Catalase, G6PDH, SOD1 and SOD2. Tubulin was used as loading control. (B) The bar graph shows the quantification of the level of each protein normalized to tubulin. The number shown in the panel indicates the number of embryos used to derive primary MEFs per genotype, and the data were obtained from three independent experiments. All data are expressed as mean ± SEM.
Figure 9
Figure 9. Antioxidant glutathione and NAC restore the reduced ΔΨm in DJ-1−/− MEFs.
(A, B) Confocal microscopic analysis. (A) Representative confocal live cell images of DJ-1−/− and +/+ MEFs stained with TMRM (50 nM, red) and Mitotracker Green (200 nM) after incubation with or without glutathione (Glu, 10 mM, 24 hr) or NAC (20 mM, 24 hr). Insets show higher power views of the boxed area in the panel. Scale bar: 10 µm. (B) The bar graph shows quantification of TMRM signal in DJ-1−/− and +/+ MEFs after incubation with or without glutathione (Glu, 10 mM, 24 hr) or NAC (20 mM, 24 hr). The TMRM signal is reduced in DJ-1−/− cells under basal conditions, whereas the TMRM signal is increased in DJ-1−/− after incubation with antioxidants. The number shown in the panel indicates the number of cells quantified per genotype in the graph. (C, D) FACS analysis. (C) Representative flow cytometric dot plots show the intensity of TMRM signal in DJ-1−/− and +/+ MEFs following incubation with TMRM (50 nM) after incubation with or without glutathione (Glu, 10 mM, 24 hr) or NAC (20 mM, 24 hr). (D) The bar graph shows quantification of TMRM signal in DJ-1−/− and +/+ MEFs and the rescue of the decrease of the TMRM fluorescence in DJ-1−/− cells after incubation with antioxidant molecules. The number shown in the panel indicates the number of embryos used to derive primary MEFs per genotype, and the data were obtained from five independent experiments. All data are expressed as mean ± SEM. *p<0.05, **p<0.01, ***p<0.001.
Figure 10
Figure 10. Increases of oxidative stress induce reduction of ΔΨm in DJ-1+/+ MEFs.
(A, B) Confocal microscopic analysis. (A) Representative confocal live cell images of DJ-1−/− and +/+ MEFs stained with TMRM (50 nM, red) and Mitotracker Green (200 nM) after incubation with or without H2O2 (500 µM, 3 hr) or pyocyanin (100 µM, 24 hr). Insets show higher power views of the boxed area in the panel. Scale bar: 10 µm. (B) The bar graph shows quantification of TMRM signal in DJ-1−/− and +/+ MEFs after incubation with or without H2O2 (500 µM, 3 hr) or pyocyanin (100 µM, 24 hr). The TMRM signal is markedly reduced in DJ-1+/+ cells after induction of oxidative stress. The number shown in the panel indicates the number of cells quantified per genotype in the graph. (C, D) FACS analysis. (C) Representative flow cytometry dot plots show the intensity of TMRM signal in DJ-1−/− and +/+ MEFs following incubation with TMRM (50 nM) after incubation with or without H2O2 (500 µM, 3 hr) or pyocyanin (100 µM, 24 hr). (D) The bar graph shows quantification of TMRM signal in DJ-1−/− and +/+ MEFs. The TMRM fluorescence in DJ-1+/+ cells is decreased after incubation with oxidative stress inducers. The number shown in the panel indicates the number of embryos used to derive primary MEFs per genotype, and the data were obtained from three independent experiments. All data are expressed as mean ± SEM. *p<0.05, **p<0.01, ***p<0.001.
Figure 11
Figure 11. Antioxidants glutathione and NAC restore mPTP opening in DJ-1−/− MEFs.
(A, B) Confocal microscopic analysis. (A) Representative confocal live cell images of DJ-1−/− and +/+ MEFs stained with calcein-AM (1 µM, green) and Mitotracker Red (150 nM) in the presence of Co2+ (1 mM) after incubation with or without glutathione (Glu, 10 mM, 24 hr) or NAC (20 mM, 24 hr). Insets show higher power views of the boxed area in the panel. Scale bar: 10 µm. (B) The bar graph shows quantification of calcein signal in DJ-1−/− and +/+ MEFs after incubation with or without glutathione (Glu, 10 mM, 24 hr) or NAC (20 mM, 24 hr). The calcein signal is reduced in DJ-1−/− cells under basal conditions, whereas this signal is increased in DJ-1−/− after incubation with antioxidants. The number shown in the panel indicates the number of cells quantified per genotype in the study. (C, D) FACS analysis. (C) Representative flow cytometric dot plots show the intensity of calcein signal in DJ-1−/− and +/+ MEFs following incubation with calcein-AM (1 µM) in the presence of Co2+ (1 mM) after incubation with or without glutathione (Glu, 10 mM, 24 hr) or NAC (20 mM, 24 hr). (D) The bar graph shows quantification of calcein signal in DJ-1−/− and +/+ MEFs and the reversal of the decrease of calcein fluorescence in DJ-1−/− cells after incubation with antioxidant molecules. The number shown in the panel indicates the number of embryos used to derive primary MEFs per genotype, and the data were obtained from three independent experiments. All data are expressed as mean ± SEM. *p<0.05, **p<0.01.
Figure 12
Figure 12. Increases of oxidative stress induce an increase in mPTP opening in
DJ-1 +/+ MEFs. (A, B) Confocal microscopic analysis. (A) Representative confocal live cell images of DJ-1−/− and +/+ MEFs stained with calcein-AM (1 µM, green) and Mitotracker Red (150 nM) in the presence of Co2+ (1 mM) after incubation with or without H2O2 (500 µM, 3 hr) or pyocyanin (100 µM, 24 hr). Insets show higher power views of the boxed area in the panel. Scale bar: 10 µm. (B) The bar graph shows quantification of calcein signal in DJ-1−/− and +/+ MEFs after incubation with or without H2O2 (500 µM, 3 hr) or pyocyanin (100 µM, 24 hr). Following treatment, the calcein signal is markedly reduced in DJ-1+/+ cells, and is also reduced in DJ-1−/− cells. The number shown in the panel indicates the number of cells quantified per genotype in the graph. (C, D) FACS analysis. (C) Representative flow cytometry dot plots show the intensity of calcein signal in DJ-1−/− and +/+ MEFs following incubation with calcein-AM (1 µM, green) in the presence of Co2+ (1 mM) after incubation with or without H2O2 (500 µM, 3 hr) or pyocyanin (100 µM, 24 hr). (D) The bar graph shows quantification of calcein signal in DJ-1−/− and +/+ MEFs. The calcein fluorescence in DJ-1+/+ cells is decreased after incubation with oxidative stress inducers. The number shown in the panel indicates the number of embryos used to derive primary MEFs per genotype, and the data were obtained from three independent experiments. All data are expressed as mean ± SEM. *p<0.05, **p<0.01, ***p<0.001.

Similar articles

Cited by

References

    1. Kitada T, Asakawa S, Hattori N, Matsumine H, Yamamura Y, et al. Mutations in th parkin gene cause autosomal recessive juvenile parkinsonism. Nature. 1998;392:605–608. - PubMed
    1. Bonifati V, Rizzu P, van Baren MJ, Schaap O, Breedveld GJ, et al. Mutations in the DJ-1 gene associated with autosomal recessive early-onset parkinsonism. Science. 2003;299:256–259. - PubMed
    1. Valente EM, Abou-Sleiman PM, Caputo V, Muqit MM, Harvey K, et al. Hereditary early-onset Parkinson’s disease caused by mutations in PINK1. Science. 2004;304:1158–1160. - PubMed
    1. Shen J, Cookson MR. Mitochondria and dopamine: new insights into recessive parkinsonism. Neuron. 2004;43:301–304. - PubMed
    1. Cookson MR. DJ-1, PINK1, and their effects on mitochondrial pathways. Mov Disord. 2010;25:S44–48. - PMC - PubMed

Publication types

MeSH terms

LinkOut - more resources