. 2012;7(7):e40630.
doi: 10.1371/journal.pone.0040630. Epub 2012 Jul 6.

Sensitivity profile for orientation selectivity in the visual cortex of goggle-reared mice

Affiliations

Sensitivity profile for orientation selectivity in the visual cortex of goggle-reared mice

Takamasa Yoshida et al. PLoS One. 2012.

Abstract

It has been widely accepted that ocular dominance in the responses of visual cortical neurons can change depending on visual experience in a postnatal period. However, experience-dependent plasticity for orientation selectivity, which is another important response property of visual cortical neurons, is not yet fully understood. To address this issue, using intrinsic signal imaging and two-photon calcium imaging we attempted to observe the alteration of orientation selectivity in the visual cortex of juvenile and adult mice reared with head-mounted goggles, through which animals can experience only the vertical orientation. After one week of goggle rearing, the density of neurons optimally responding to the exposed orientation increased, while that responding to unexposed orientations decreased. These changes can be interpreted as a reallocation of preferred orientations among visually responsive neurons. Our obtained sensitivity profile for orientation selectivity showed a marked peak at 5 weeks and sustained elevation at 12 weeks and later. These features indicate the existence of a critical period between 4 and 7 weeks and residual orientation plasticity in adult mice. The presence of a dip in the sensitivity profile at 10 weeks suggests that different mechanisms are involved in orientation plasticity in childhood and adulthood.


Conflict of interest statement

Competing Interests: The authors have declared that no competing interests exist.

Figures

Figure 1
Figure 1. Cortical activation patterns and orientation distributions.
(A) Single-orientation maps of an NR mouse and a mouse GR from P21 to P28, which were reconstructed from intrinsic signal optical imaging conducted at P29 and P28, respectively. The darkness indicates the strength of intrinsic signals evoked by oriented grating stimuli. The dotted rectangles show the region of interest. R: rostral, L: lateral. (B) Orientation distributions obtained from the single-orientation maps shown in (A). The ordinate indicates the relative size of activation areas eliciting stimulus-related responses stronger than 2SD for each stimulus orientation. (C) Group-averaged orientation distributions for NR (n = 45) and GR (n = 44) groups of juvenile mice. Error bars indicate SE (standard error). All scale bars indicate 1 mm.
Figure 2
Figure 2. Typical results of two-photon imaging for juvenile NR and GR mice.
(A) Image of Ca2+ signals in a slice of the VI of an NR mouse. Fluorescence signals from OGB-1 (green) and SR101 (orange) identify neurons and astrocytes, respectively. Dark spots and strips indicate blood vessels. The scale bar indicates 100 µm. (B) Traces of Ca2+ responses of four neurons to stimulus orientations of grating stimuli, where stimulus orientations are indicated by the inclinations of the black bars placed below. These four neurons were located at positions indicated by the numbered arrows in (A). Gray columns represent 5 s stimulation periods. Vertical and horizontal bars respectively indicate 5% (formula image) and 5 s. (C) Color-coded images of vigorously responsive neurons in single slices of an NR mouse (left) and a mouse GR from P23 to P31 (right), which were reconstructed from two-photon Ca2+ imaging conducted at P42 and P31, respectively. The left image was reconstructed from the Ca2+ signals in the slice shown in (A). The color of the dots indicates the preferred orientation, whereas gray dots indicate responsive but unoriented neurons. The color code is shown below the left image. (D) Group-averaged orientation distributions for NR (n = 3) and GR (n = 3) mice. Error bars indicate SE. The scale bar indicates 100 µm.
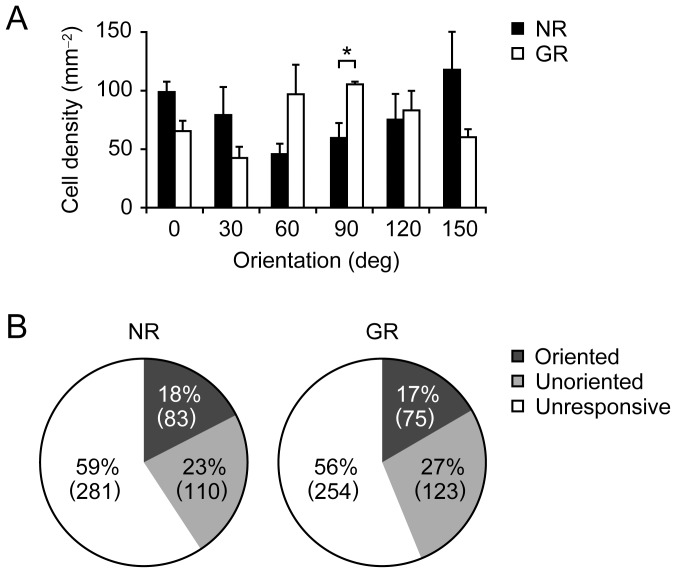
Figure 3
Figure 3. Neuron densities and abundance ratios of oriented and unoriented neurons.
(A) Histograms of neuron density for NR and GR mice. The difference in the neuron density between NR and GR mice was statistically significant for the vertical orientation (p<0.05, Student t-test). Error bars indicate SE. (B) Ratios of the numbers of oriented, unoriented and unresponsive neurons to the total number of neurons identified by OGB-1 signals for the NR group (left) and GR group (right). The absolute numbers of respective types of neurons are shown in parentheses. The abundance ratio of oriented neurons as well as that of unoriented neurons did not differ between the two groups.
Figure 4
Figure 4. Orientation bias indices (OBIs) for NR and GR mice and sensitivity profile for orientation plasticity.
(A) Averaged OBIs obtained from intrinsic signal imaging of NR and GR groups for juvenile and adult mice. (B) Averaged OBIs obtained from two-photon imaging of juvenile NR and GR groups. (C) Age dependence of OBIs averaged among animals of the same age for NR and GR mice. The dashed gray line indicates OBI = 0.5, corresponding to the absence of any representation bias towards the vertical or horizontal orientation. Faint dots indicate OBIs for individual mice. Error bars indicate SE. Significant differences in OBIs for GR and NR mice are shown as *p<0.05, **p<0.01 and ***p<0.001. (D) Sensitivity profile for orientation plasticity induced by the one-week of exposure to vertical orientation from 3w to 15w. The critical period for orientation plasticity is suggested to lie between 4w and 7w, during which the sensitivity index (SI) is prominently large. Also, orientation plasticity is found to be preserved to some extent even after 12w.
Figure 5
Figure 5. Orientation-restricting goggles and experimental setup for intrinsic signal optical imaging.
(A) Photograph of goggles (left) and picture of a goggle-mounted mouse (right). The scale bar indicates 5 mm. (B) The monitor screen presenting visual stimuli was placed 25 cm apart from either eye of a mouse. The angle between the center of the screen and the animal's midline was set at 45°. Optical imaging was performed transcranially in a rectangular region in the hemisphere contralateral to the stimulated eye, which included the primary visual cortex. (C) Images of blood vessels in the skull and cortical surface (left), and stimulus-evoked intrinsic signals whose strength is indicated by their darkness (right). A detailed analysis was performed using the signals evoked inside the dashed rectangle. The scale bar indicates 1 mm.

Similar articles

Cited by

References

    1. Wiesel TN, Hubel DH. Single-cell responses in striate cortex of kittens deprived of vision in one eye. J Neurophysiol. 1963;26:1003–1017. - PubMed
    1. Hubel DH, Wiesel TN. The period of susceptibility to the physiological effects of unilateral eye closure in kittens. J Physiol. 1970;206:419–436. - PMC - PubMed
    1. Hubel DH, Wiesel TN, LeVay S. Plasticity of ocular dominance columns in monkey striate cortex. Philos Trans R Soc Lond B Biol Sci. 1977;278:377–409. - PubMed
    1. Dräger UC. Observations on monocular deprivation in mice. J Neurophysiol. 1978;41:28–42. - PubMed
    1. Maffei L, Berardi N, Domenici L, Parisi V, Pizzorusso T. Nerve growth factor (NGF) prevents the shift in ocular dominance distribution of visual cortical neurons in monocularly deprived rats. J Neurosci. 1992;12:4651–4662. - PMC - PubMed

Publication types