. 2012;7(7):e40717.
doi: 10.1371/journal.pone.0040717. Epub 2012 Jul 11.

Resistance to paclitaxel in a cisplatin-resistant ovarian cancer cell line is mediated by P-glycoprotein

Affiliations

Resistance to paclitaxel in a cisplatin-resistant ovarian cancer cell line is mediated by P-glycoprotein

Britta Stordal et al. PLoS One. 2012.

Abstract

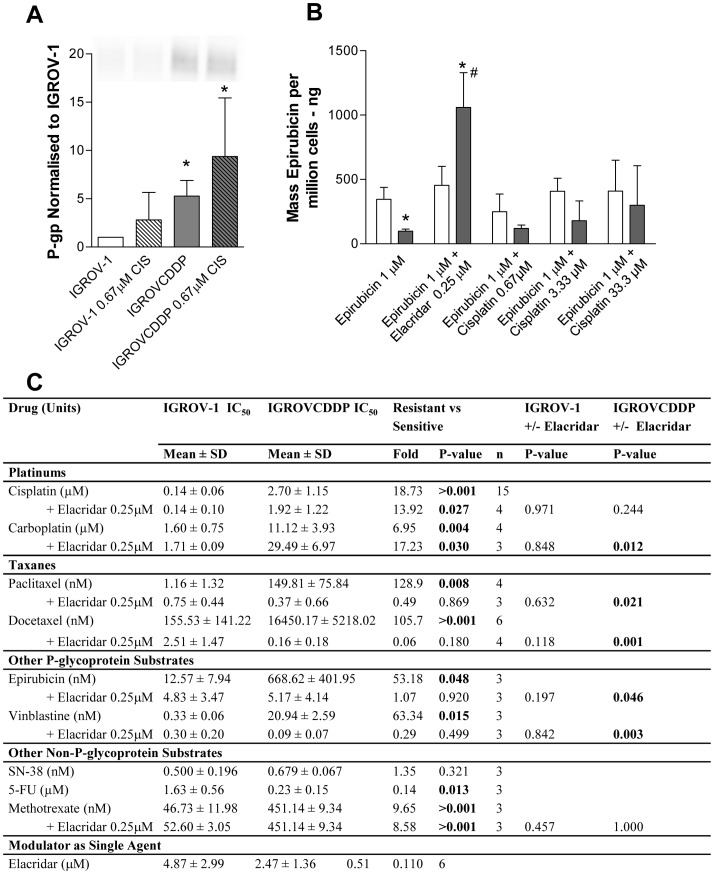
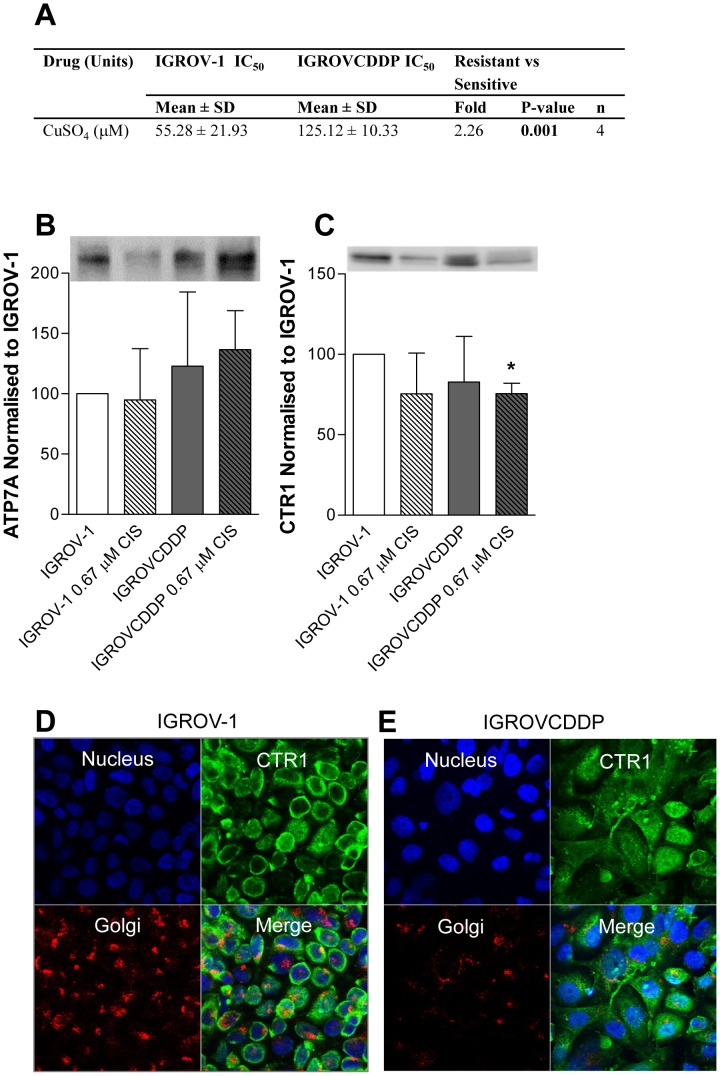
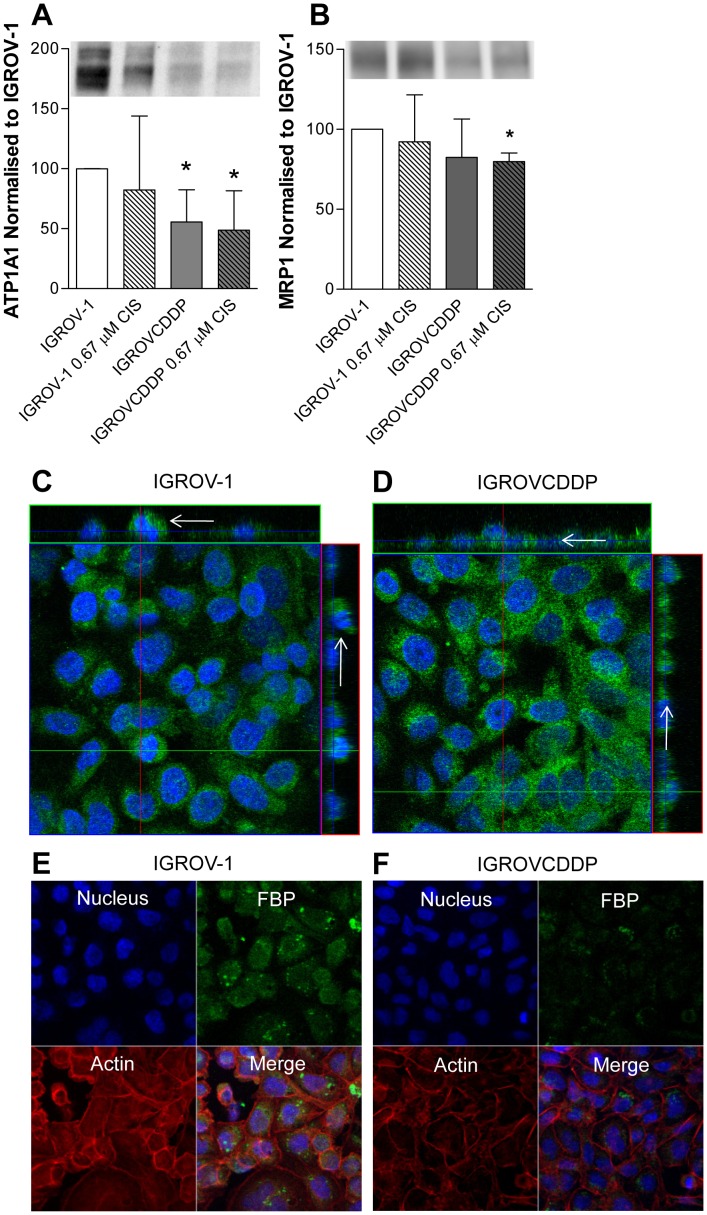
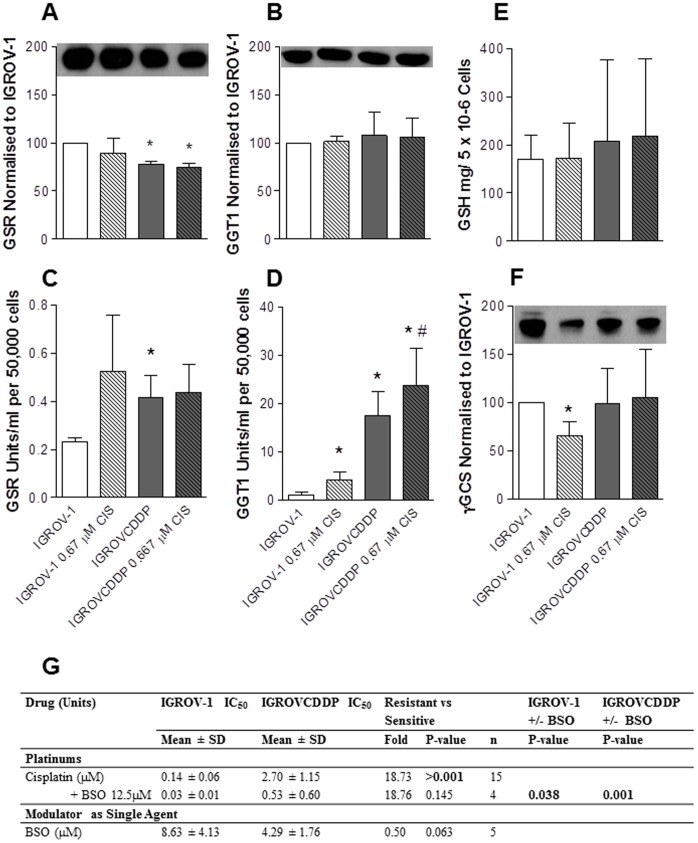
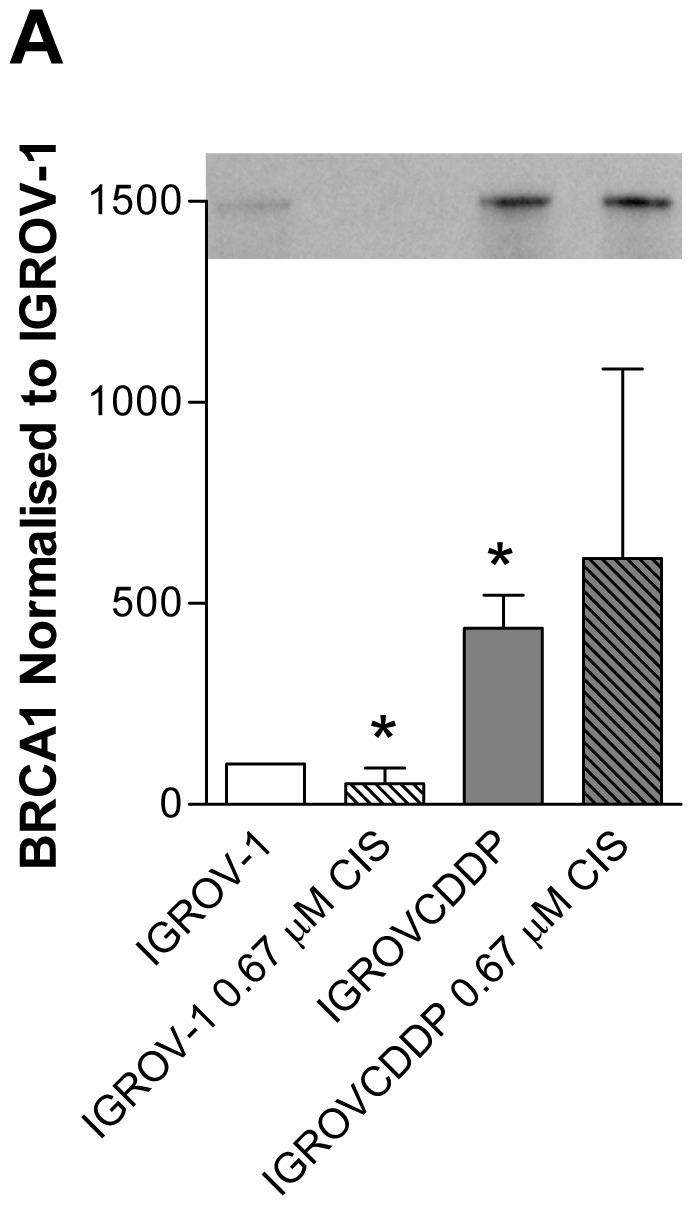
The IGROVCDDP cisplatin-resistant ovarian cancer cell line is also resistant to paclitaxel and models the resistance phenotype of relapsed ovarian cancer patients after first-line platinum/taxane chemotherapy. A TaqMan low-density array (TLDA) was used to characterise the expression of 380 genes associated with chemotherapy resistance in IGROVCDDP cells. Paclitaxel resistance in IGROVCDDP is mediated by gene and protein overexpression of P-glycoprotein and the protein is functionally active. Cisplatin resistance was not reversed by elacridar, confirming that cisplatin is not a P-glycoprotein substrate. Cisplatin resistance in IGROVCDDP is multifactorial and is mediated in part by the glutathione pathway and decreased accumulation of drug. Total cellular glutathione was not increased. However, the enzyme activity of GSR and GGT1 were up-regulated. The cellular localisation of copper transporter CTR1 changed from membrane associated in IGROV-1 to cytoplasmic in IGROVCDDP. This may mediate the previously reported accumulation defect. There was decreased expression of the sodium potassium pump (ATP1A), MRP1 and FBP which all have been previously associated with platinum accumulation defects in platinum-resistant cell lines. Cellular localisation of MRP1 was also altered in IGROVCDDP shifting basolaterally, compared to IGROV-1. BRCA1 was also up-regulated at the gene and protein level. The overexpression of P-glycoprotein in a resistant model developed with cisplatin is unusual. This demonstrates that P-glycoprotein can be up-regulated as a generalised stress response rather than as a specific response to a substrate. Mechanisms characterised in IGROVCDDP cells may be applicable to relapsed ovarian cancer patients treated with frontline platinum/taxane chemotherapy.


Conflict of interest statement

Competing Interests: The authors have declared that no competing interests exist.

Figures

Figure 1
Figure 1. P-gp in IGROV-1 and IGROVCDDP cells.
A) Western blot of P-glycoprotein, IGROV-1 (open bars) and IGROVCDDP (grey bars) with and without treatment with 0.67 µM cisplatin for 72 hours (striped bars). Representative image shown. Graph shows quantitation of n = 6 biological repeats normalised to β-actin. * Indicates significant difference from IGROV-1 p<0.05 student’s t-test. B) Accumulation of epirubicin determined by LC-MS. IGROV-1 (open bars) and IGROVCDDP (shaded bars). Cells were treated with 1 µM epirubicin for 2 hours, 0.25 µM elacridar, 0.67 µM, 3.33 µM or 33.3 µM cisplatin were investigated as modulators of epirubicin accumulation. Graph shows quantitation of n = 3 biological repeats normalised to cell number. * Indicates a significant difference between IGROV-1 and IGROV-CDDP, # Indicates a significant difference on the addition of a modulator (p<0.05 students t-test). C) Cytotoxicity of IGROV-1 and IGROVCDDP to P-glycoprotein and non P-glycoprotein substrates.
Figure 2
Figure 2. Copper Transporters in IGROV-1 and IGROVCDDP cells.
A) Cytotoxicity of IGROV-1 and IGROVCDDP to CuSO4. B) ATP7A western blot. Open bars are IGROV-1, shaded bars are IGROVCDDP and striped bars indicate treatment with 0.67 µM cisplatin for 72 hours. Representative image shown. Graph shows quantitation of n = 4 biological repeats normalised to β-actin. C) CTR1 western blot. Representative image shown. Graph shows quantitation of n = 3 biological repeats normalised to β-actin. * Indicates significant difference from IGROV-1 p<0.05 student’s t-test. CTR1 confocal microscopy in D) IGROV-1 and E) IGROVCDDP cells. XY planes are shown for DAPI (blue), Golgi (red) and CTR1 (green), a merged image is also shown.
Figure 3
Figure 3. Biomarkers of platinum accumulation defect in IGROV-1 and IGROVCDDP cells.
Open bars are IGROV-1, shaded bars are IGROVCDDP and striped bars indicate treatment with 0.67 µM cisplatin for 72 hours. A) ATP1A1 western blot. Representative image shown. Graph shows quantitation of n = 4 biological repeats normalised to β-actin. B) MRP1 western blot. Representative image shown. Graph shows quantitation of n = 3 biological repeats normalised to β-actin. * Indicates significant difference from IGROV-1 p<0.05 student’s t-test. MRP1 confocal microscopy in C) IGROV-1 and D) IGROVCDDP cells. Orthogonal images are shown for a merged image of DAPI (blue) and MRP1 (green), arrows on the side bars indicate the apical (IGROV-1) and basolateral location of MRP1 (IGROVCDDP). FBP confocal microscopy in E) IGROV-1 and F) IGROVCDDP cells. XY planes are shown for DAPI (blue), actin (red) and FBP (green), a merged image is also shown.
Figure 4
Figure 4. Glutathione pathway in IGROV-1 and IGROVCDDP cells.
Open bars are IGROV-1, shaded bars are IGROVCDDP and striped bars indicate treatment with 0.67 µM cisplatin. A) Total intracellular glutathione. Graph shows n = 3 biological repeats normalised to cell number. B) γGCS western blot. Representative image shown. Graph shows quantitation of n = 4 biological repeats normalised to β-actin. C) GSR western blot. Representative image shown. Graph shows quantitation of n = 3 biological repeats normalised to β-actin. D) GSR enzyme assay. Graph shows n = 4 biological repeats normalised to cell number. E) GGT1 western blot. Representative image shown Graph shows quantitation of n = 3 biological repeats normalised to β-actin. E) GGT1 enzyme assay. Graph shows n = 4 biological repeats normalised to cell number. * Indicates significant difference from IGROV-1 p<0.05 student’s t-test. # Indicates significant difference from IGROVCDDP on the addition of cisplatin. G) Modulation of cisplatin cytotoxicity of IGROV-1 and IGROVCDDP with BSO.
Figure 5
Figure 5. BRCA1 in IGROV-1 and IGROVCDDP cells.
Open bars are IGROV-1, shaded bars are IGROVCDDP and striped bars indicate treatment with 0.67 µM cisplatin for 72 hours. A) BRCA1 western blot. Representative image shown. Graph shows quantitation of n = 4 biological repeats normalised to β-actin. * Indicates significant difference from IGROV-1 p<0.05 student’s t-test.

Similar articles

Cited by

References

    1. Hennessy BT, Coleman RL, Markman M. Ovarian cancer. Lancet. 2009;374:1371–1382. - PubMed
    1. Stordal B, Pavlakis N, Davey R. A systematic review of platinum and taxane resistance from bench to clinic: an inverse relationship. Cancer Treatment Reviews. 2007;33:688–703. - PubMed
    1. Ma J, Maliepaard M, Kolker HJ, Verweij J, Schellens JH. Abrogated energy-dependent uptake of cisplatin in a cisplatin-resistant subline of the human ovarian cancer cell line IGROV-1. Cancer Chemotherapy & Pharmacology. 1998;41:186–192. - PubMed
    1. Ma J, Maliepaard M, Nooter K, Boersma AW, Verweij J, et al. Synergistic cytotoxicity of cisplatin and topotecan or SN-38 in a panel of eight solid-tumor cell lines in vitro. Cancer Chemotherapy & Pharmacology. 1998;41:307–316. - PubMed
    1. Martin A, Clynes M. Comparison of 5 microplate colorimetric assays for in vitro cytotoxicity testing and cell proliferation assays. Cytotechnology. 1993;11:49–58. - PubMed

Publication types

MeSH terms