. 2012;7(7):e40733.
doi: 10.1371/journal.pone.0040733. Epub 2012 Jul 11.

Pulmonary infection with influenza A virus induces site-specific germinal center and T follicular helper cell responses

Affiliations

Pulmonary infection with influenza A virus induces site-specific germinal center and T follicular helper cell responses

Alexander W Boyden et al. PLoS One. 2012.

Abstract

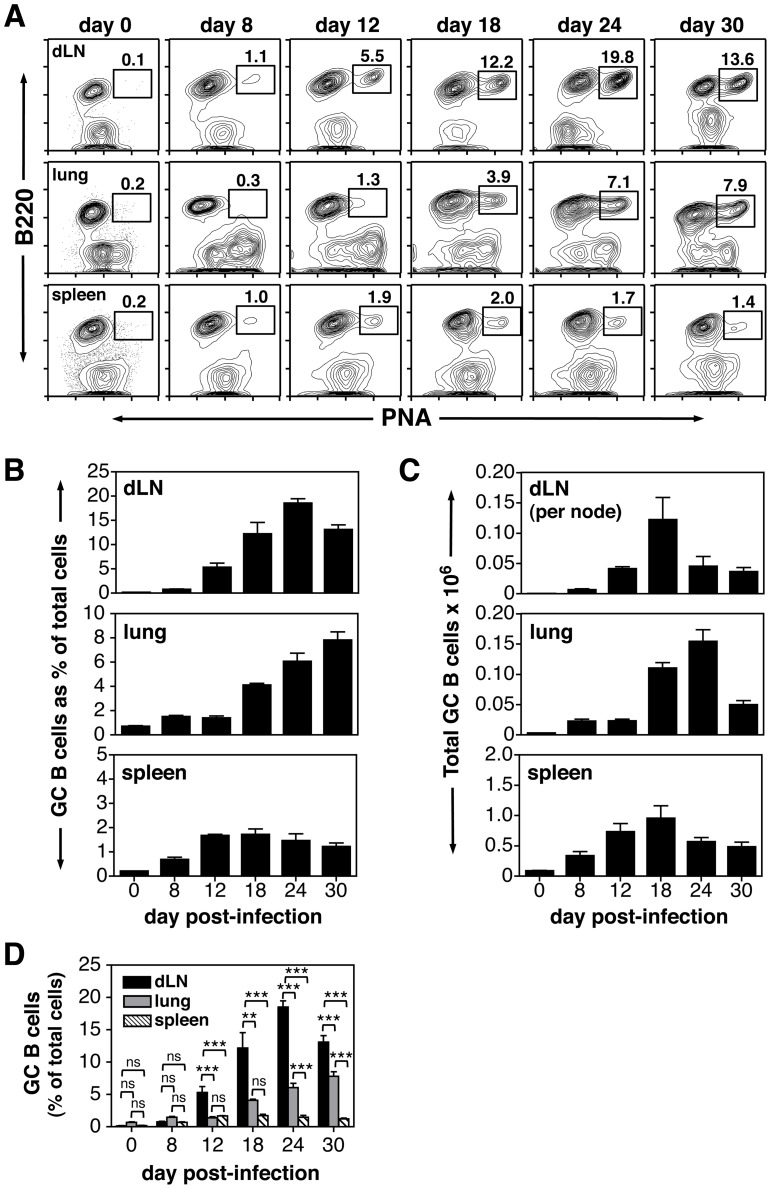
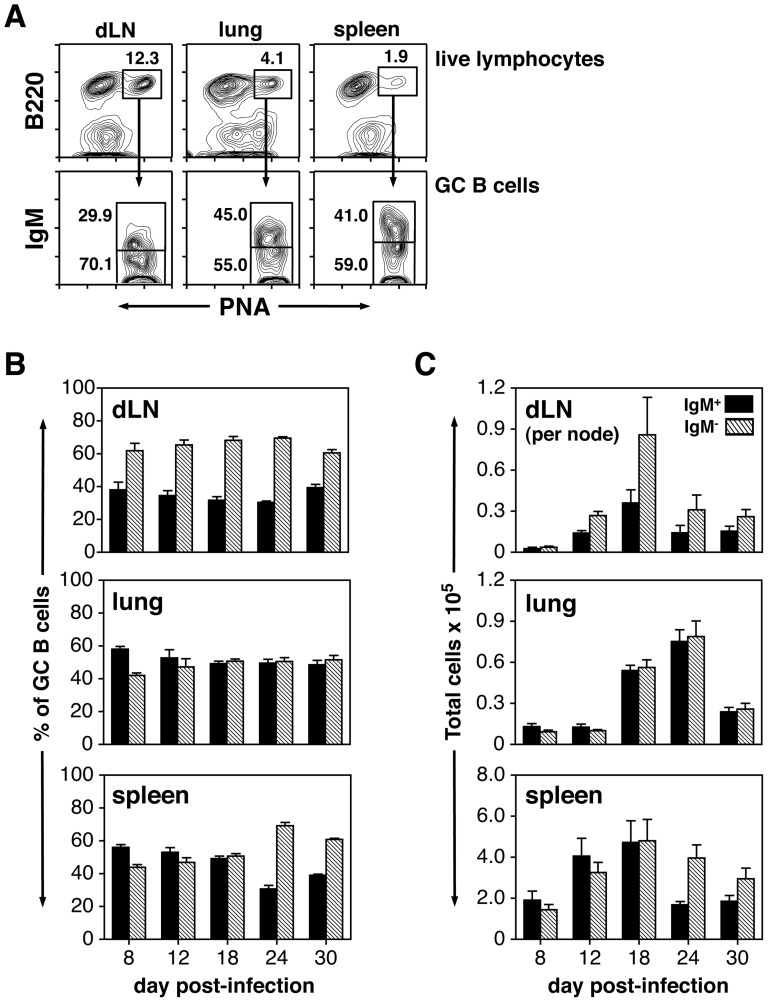
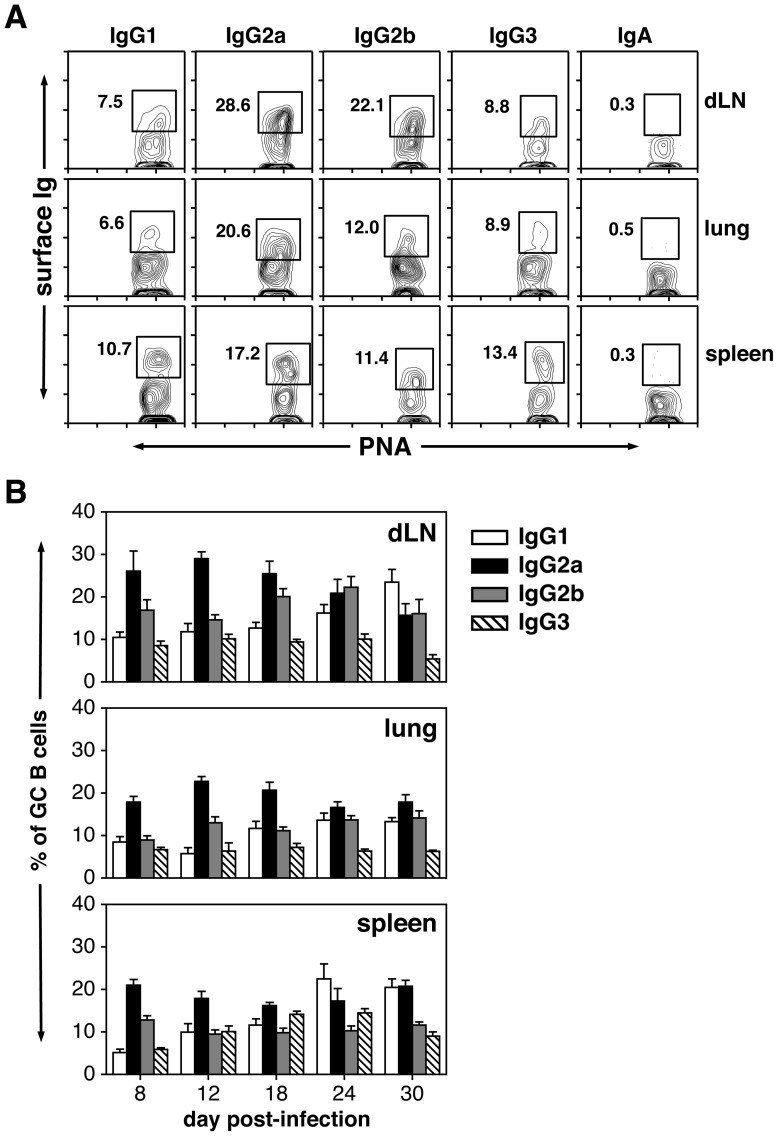
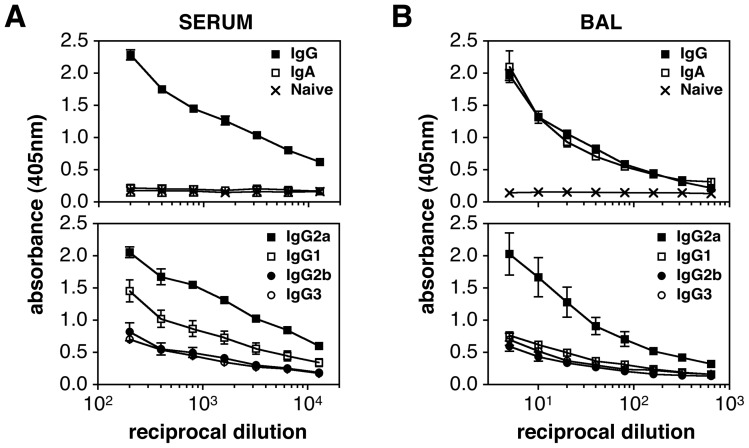
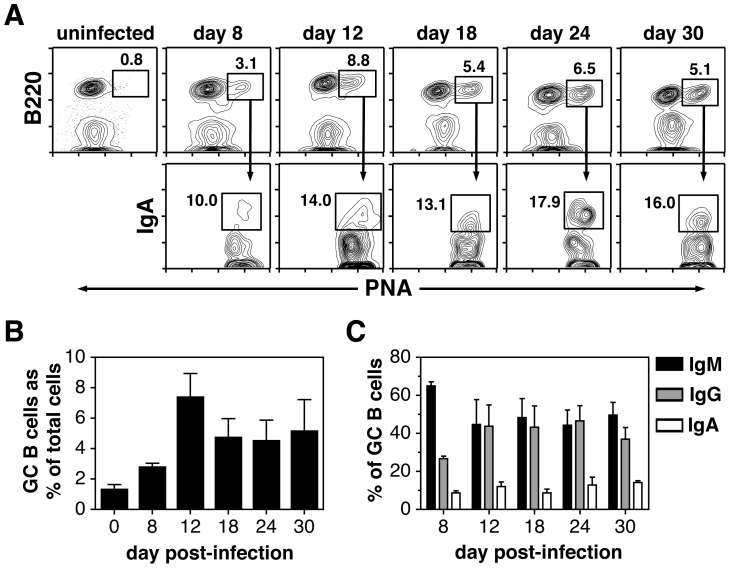
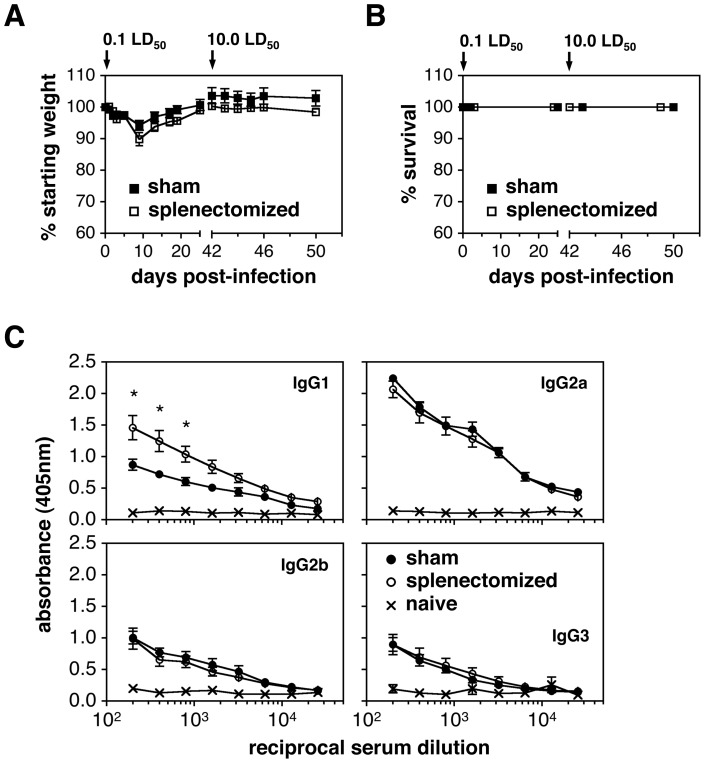
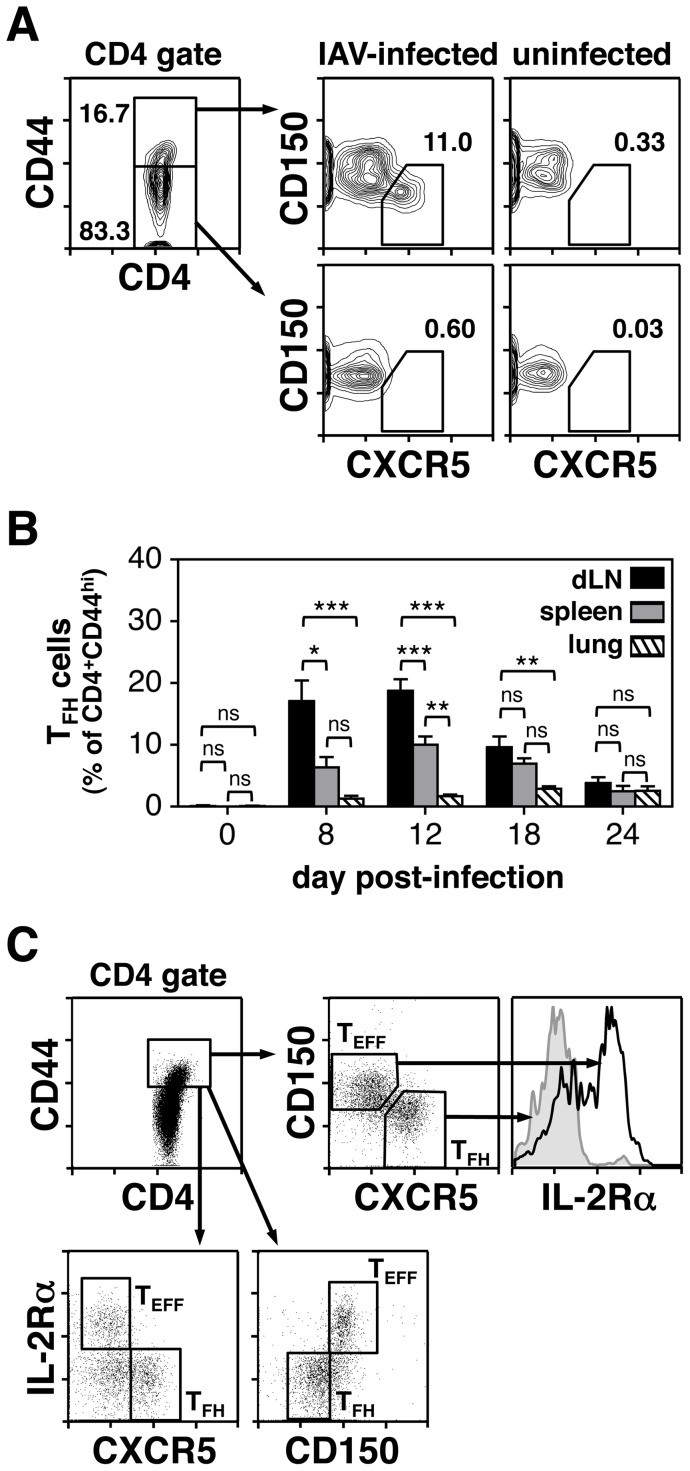
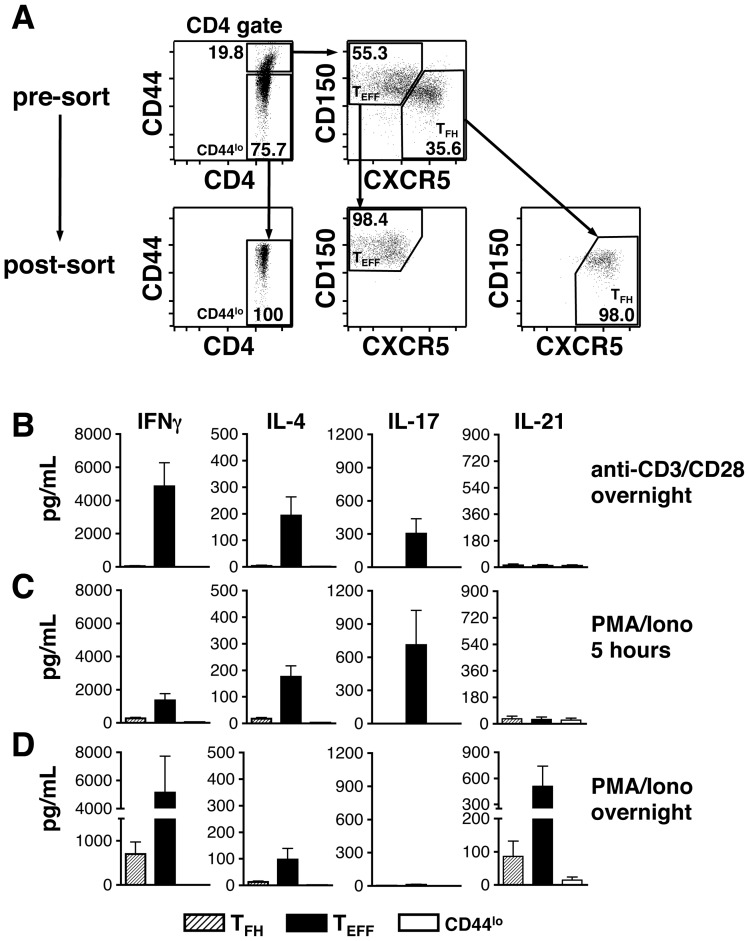
Protection from influenza A virus (IAV) challenge requires switched, high affinity Abs derived from long-lived memory B cells and plasma cells. These B cell subsets are generated in germinal centers (GCs), hallmark structures of T helper cell-driven B cell immunity. A full understanding of the GC reaction after respiratory IAV infection is lacking, as is the characterization of T follicular helper (T(FH)) cells that support GCs. Here, GC B cell and T(FH) cell responses were studied in mice following pulmonary challenge with IAV. Marked GC reactions were induced in draining lymph nodes (dLNs), lung, spleen and nasal-associated lymphoid tissue (NALT), although the magnitude and kinetics of the response was site-specific. Examination of switching within GCs demonstrated IgG2(+) cells to compose the largest fraction in dLNs, lung and spleen. IgA(+) GC B cells were infrequent in these sites, but composed a significant subset of the switched GC population in NALT. Further experiments demonstrated splenectomized mice to withstand a lethal recall challenge, suggesting the spleen to be unnecessary for long-term protection in spite of strong GC responses in this organ. Final studies showed that T(FH) cell numbers were highest in dLNs and spleen, and peaked in all sites prior to the height of the GC reaction. T(FH) cells purified from dLNs generated IL-21 and IFNγ upon activation, although CD4(+)CXCR5(-) T effector cells produced higher levels of all cytokines. Collectively, these findings reveal respiratory IAV infection to induce strong T helper cell-driven B cell responses in various organs, with each site displaying unique attributes.


Conflict of interest statement

Competing Interests: The authors have declared that no competing interests exist.

Figures

Figure 1
Figure 1. IAV infection induces GC reactions in dLNs, lung and spleen.
Animals were infected i.n. with a 0.1LD50 dose of IAV on day 0. dLNs, lung, and spleen were harvested on days 8–30 post-infection and stained with PNA and anti-B220 mAb. Tissues from naïve uninfected mice were also analyzed and represent day 0. A) GC B cell populations (gated B220+PNAhi cells) from dLNs, lung and spleen are shown at all time points. The value above each gate represents the individual percentage of GC B cells from that sample. B) Bar graphs represent the percent of B220+PNAhi GC B cells within the viable lymphocyte-gated population. C) Bar graphs represent the number of total recovered GC B cells per organ. dLN data are shown as total cells per lymph node. D) Bar graphs represent the percent of B220+PNAhi GC B cells within the viable lymphocyte-gated population. Each bar represents mean ± SEM. n = 5–6 mice per group and time point. ns  =  not significant; **p<0.01; ***p<0.001; determined with the ANOVA test.
Figure 2
Figure 2. IAV-induced GC B cell responses exhibit site-specific switching characteristics.
Animals were infected i.n. with a 0.1LD50 dose of IAV on day 0. dLNs, lung, and spleen were harvested on days 8–30 post-infection and stained with PNA, anti-B220 mAb and anti-IgM mAb. A) Representative plots show the gating strategy used to define non-switched IgM+ and switched IgM GC B cells in dLNs, lung and spleen at day 18 post-infection. B) Bar graphs represent the percent of non-switched IgM+ (closed bars) and switched IgM (hatched bars) B cells within the B220+PNAhi GC population. C) Bar graphs represent the total number of non-switched IgM+ (closed bars) and switched IgM (hatched bars) GC B cells per organ. dLN data are shown as total cells per lymph node. Each bar represents mean ± SEM. n = 5–6 mice per group and time point.
Figure 3
Figure 3. Distribution of IgG subclass-expressing B cells within the GC.
Animals were infected i.n. with a 0.1LD50 dose of IAV on day 0. dLNs, lung, and spleen were harvested on days 8–30 post-infection and stained with PNA, anti-B220 mAb and either goat anti-IgG1, IgG2a, IgG2b, IgG3 or IgA specific Abs. A) Representative plots (from B220+PNAhi parent gates) show the gating strategy used to define IgG1+, IgG2a+, IgG2b+, IgG3+ and IgA+ GC B cells in dLNs, lung and spleen at day 18 post-infection. B) Bar graphs represent the percent of IgG+ subsets within the B220+PNAhi GC population. Each bar represents mean ± SEM. n = 5–6 mice per group and time point.
Figure 4
Figure 4. IAV-specific Ab responses in serum and BAL fluid.
Animals were infected i.n. with a 0.1LD50 dose of IAV on day 0. Serum and BAL samples were harvested from mice on day 24 post-infection or from naïve uninfected animals. Serum and BAL Ab responses were measured using an IAV-specific whole virus ELISA. A) The top panel shows total IAV-specific IgG and IgA responses in serum. IAV-specific IgA levels were near background levels. IAV-specific IgG and IgA Abs were undetectable in sera from uninfected animals. The bottom panel represents IAV-specific IgG1, IgG2a, IgG2b, and IgG3 Ab levels is serum. B) The top panel shows total IAV-specific IgG and IgA responses in BAL samples. IAV-specific IgG and IgA Abs were undetectable in BAL fluid from uninfected animals. The bottom panel represents IAV-specific IgG1, IgG2a, IgG2b, and IgG3 Ab levels in BAL fluid. Each value represents mean ± SEM. The results in panels A and B are representative of 2 separate ELISA tests performed with separate groups of mice. n = 3 mice per group.
Figure 5
Figure 5. IgA expressing GC B cells are present in NALT.
Animals were infected i.n. with a 0.1LD50 dose of IAV on day 0. NALT was dissected on days 8–30 post-infection and stained with PNA, anti-B220 mAb and either anti-IgM mAb, a cocktail of goat anti-mouse IgG1, IgG2a, IgG2b, IgG3 specific Abs, or goat anti-mouse IgA specific Ab. Tissues from naïve uninfected mice were also analyzed (day 0). A) Representative plots show the gating strategy used to define IgA+ B cells within the B220+PNAhi GC compartment at all time points. The value next to each gate represents the individual percentage of GC B cells or IgA+ GC B cells from that sample. B) Bar graphs represent the percent of B220+PNAhi GC B cells within the viable lymphocyte-gated population. C) Bar graphs represent the number of IgM+, total IgG+ and IgA+ GC B cells. Each bar represents mean ± SEM. n = 3 experiments, with each experiment (and time point) containing pooled NALT tissue from 5 mice.
Figure 6
Figure 6. Splenectomized mice withstand a secondary 10.0LD50 IAV infection.
Sham or splenectomized animals were given a sublethal 0.1LD50 dose of IAV i.n. on day 0 and a subsequent 10.0LD50 dose of IAV i.n. on day 42. Morbidity and mortality were monitored through day 50. Serum samples were harvested on day 28 following primary sublethal infection. A) Line graphs represent percent of starting body weight (morbidity) after primary and secondary infection. B) Line graphs represent survival (mortality) after primary and secondary infection. C) IgG1, IgG2a, IgG2b and IgG3 Ab responses were measured in day 28 post-infection sera using an IAV-specific whole virus ELISA. Sera from naïve mice were also tested. Each value represents mean ± SEM. n = 4 for sham splenectomized mice. n = 5 for splenectomized mice. *p<0.05; represents the statistical difference between sham and splenectomized mouse sera at the indicated dilutions as determined by the unpaired Student's t test.
Figure 7
Figure 7. TFH cell populations are induced upon IAV infection.
Animals were infected i.n. with a 0.1LD50 dose of IAV on day 0. dLNs, lung, and spleen were harvested on days 8–24 post-infection and stained with anti-CD4, anti-CD44, anti-CXCR5 and anti-CD150 mAbs. Tissues from uninfected animals were also analyzed and are shown as day 0. A) Representative plots show the gating strategy used to define CD4+CD44hi CXCR5+CD150lo TFH cells. The value next to each gate represents the individual percentage from that sample. B) Bar graphs represent the percent of CXCR5+CD150lo TFH cells within the CD4+CD44hi population from dLNs, spleen, and lung. Each bar represents mean ± SEM. n = 5–6 mice for infected mice. n = 3 for uninfected mice. ns = not significant; *p<0.05; **p<0.01; ***p<0.001; determined with the ANOVA test. C) Animals were infected i.n. with a 0.1LD50 dose of IAV on day 0. dLNs were harvested on day 12 post-infection and stained with anti-CD4, anti-CD44, anti-CXCR5, anti-CD150 and anti-IL-2Rα (CD25) mAbs. Representative plots demonstrate the presence of IL-2Rαhi TEFF cells within the CD4+CD44hiCXCR5CD150hi population. IL-2Rαhi T cells are nearly absent in the CD4+CD44hiCXCR5+CD150lo TFH gate.
Figure 8
Figure 8. Cytokine production by IAV-induced TEFF and TFH cell populations.
Animals were infected i.n. with a 0.1LD50 dose of IAV on day 0. dLNs were harvested on day 12 post-infection and stained with anti-CD4, anti-CD44, anti-CXCR5 and anti-CD150 mAbs. The CD4+CD44hiCXCR5CD150hi (TEFF), CD4+CD44hi CXCR5+CD150lo (TFH) and CD4+CD44lo (CD44lo) populations were sort-purified and stimulated in vitro with anti-CD3 and anti-CD28 mAbs (18 hours) or with PMA and ionomycin (5 hours or 18 hours). Culture supernatants were then harvested and tested for IFNγ, IL-4, IL-17A, and IL-21 protein levels using cytokine bead array kits. A) Representative plots show the pre-sort and post-sort CD44lo, TEFF and TFH subsets. B) Cytokine production after overnight culture with plate bound anti-CD3 and anti-CD28 mAbs. C) Cytokine production after 5 hour culture with PMA and ionomycin. D) Cytokine production after overnight culture with PMA and ionomycin. Each bar represents mean ± SEM. n = 6 mice. Note that y-axes are identical vertically rather than horizontally in panels B–D.

Similar articles

Cited by

References

    1. Legge KL, Braciale TJ. Accelerated migration of respiratory dendritic cells to the regional lymph nodes is limited to the early phase of pulmonary infection. Immunity. 2003;18:265–277. - PubMed
    1. Belz GT, Smith CM, Kleinert L, Reading P, Brooks A, et al. Distinct migrating and nonmigrating dendritic cell populations are involved in MHC class I-restricted antigen presentation after lung infection with virus. Proc Natl Acad Sci U S A. 2004;101:8670–8675. - PMC - PubMed
    1. GeurtsvanKessel CH, Willart MA, van Rijt LS, Muskens F, Kool M, et al. Clearance of influenza virus from the lung depends on migratory langerin+CD11b- but not plasmacytoid dendritic cells. J Exp Med. 2008;205:1621–1634. - PMC - PubMed
    1. Flynn KJ, Belz GT, Altman JD, Ahmed R, Woodland DL, et al. Virus-specific CD8+ T cells in primary and secondary influenza pneumonia. Immunity. 1998;8:683–691. - PubMed
    1. Lawrence CW, Braciale TJ. Activation, differentiation, and migration of naive virus-specific CD8+ T cells during pulmonary influenza virus infection. J Immunol. 2004;173:1209–1218. - PubMed

Publication types

MeSH terms