

Dietary phenolic acids act as effective antioxidants in membrane models and in cultured cells, exhibiting proapoptotic effects in leukaemia cells
- PMID: 22792417
- PMCID: PMC3390142
- DOI: 10.1155/2012/839298
Dietary phenolic acids act as effective antioxidants in membrane models and in cultured cells, exhibiting proapoptotic effects in leukaemia cells
Abstract
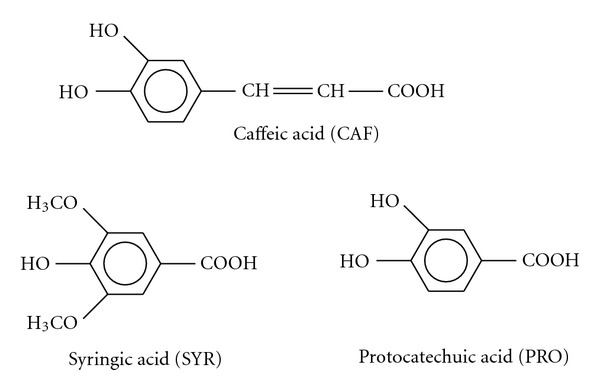
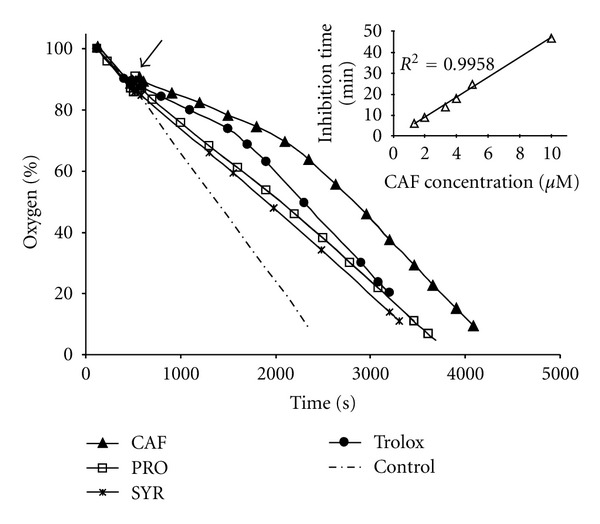
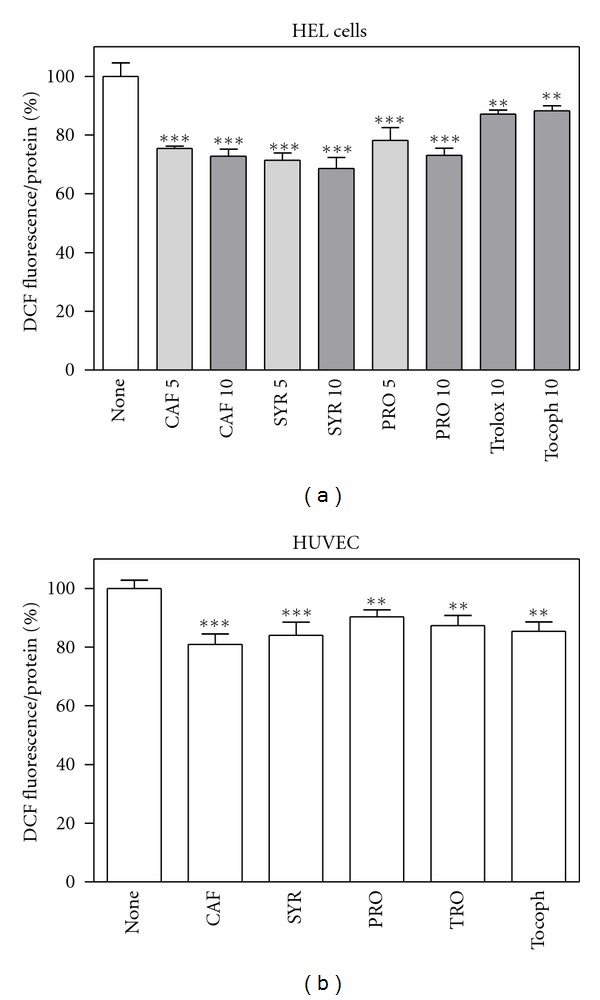
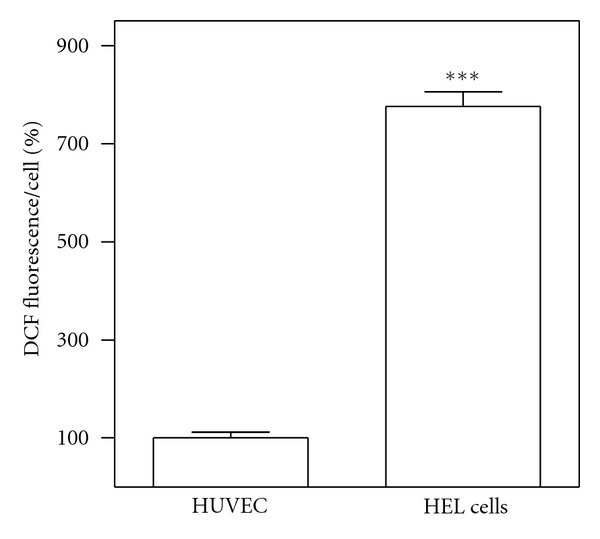
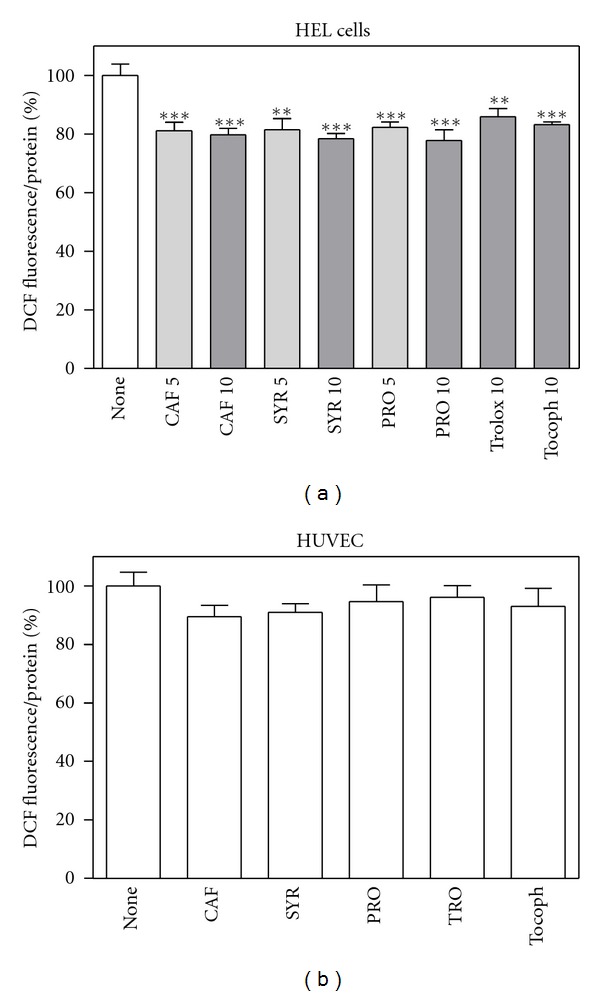
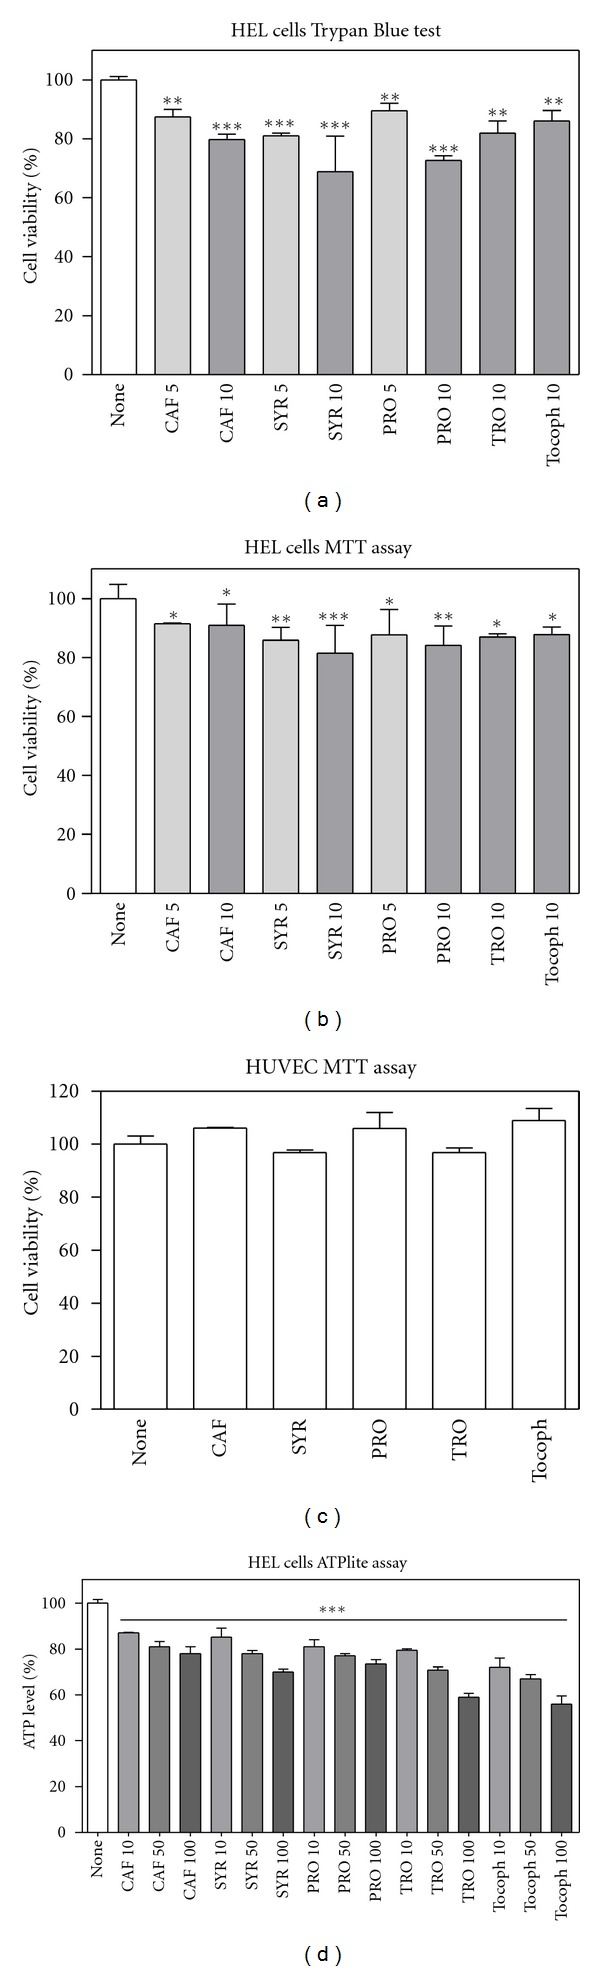
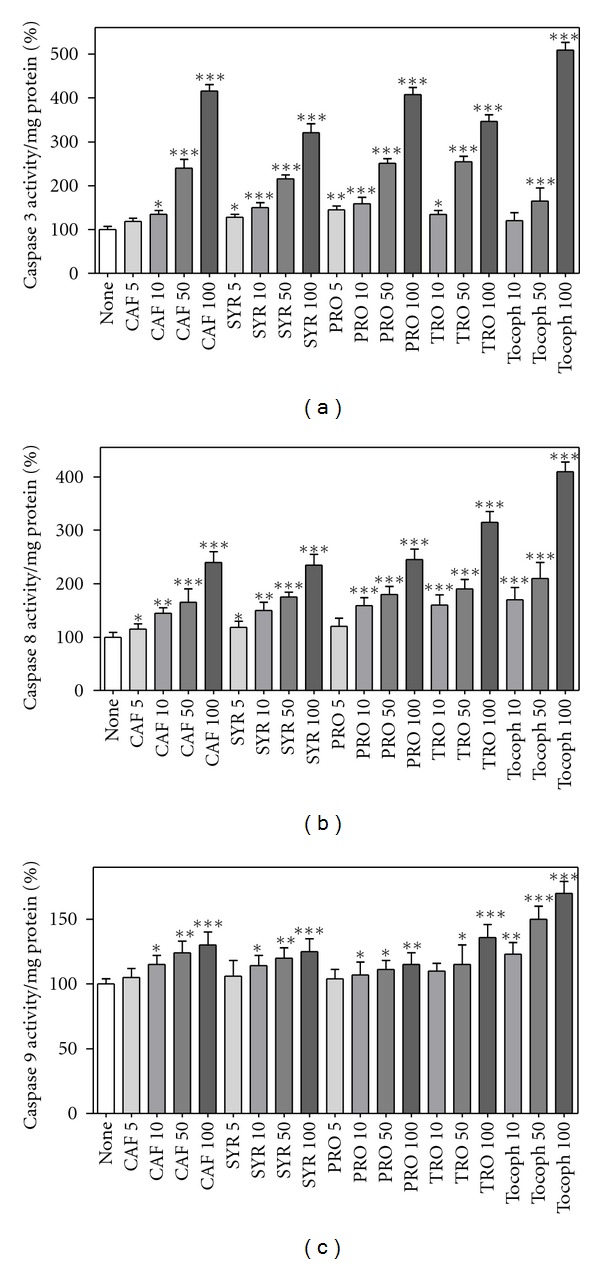
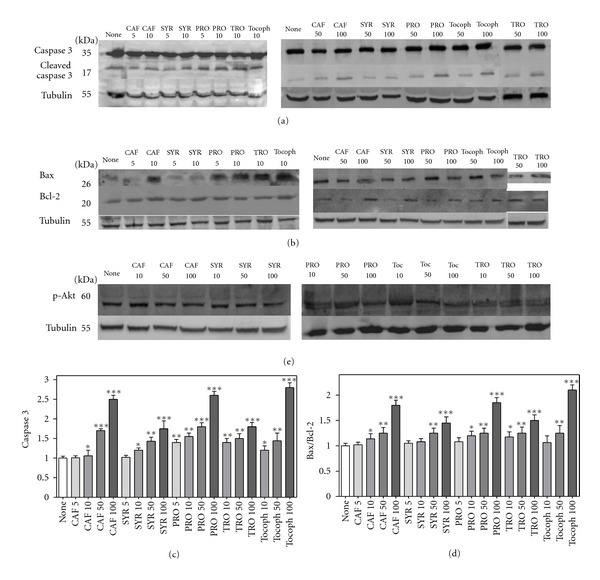
Caffeic, syringic, and protocatechuic acids are phenolic acids derived directly from food intake or come from the gut metabolism of polyphenols. In this study, the antioxidant activity of these compounds was at first evaluated in membrane models, where caffeic acid behaved as a very effective chain-breaking antioxidant, whereas syringic and protocatechuic acids were only retardants of lipid peroxidation. However, all three compounds acted as good scavengers of reactive species in cultured cells subjected to exogenous oxidative stress produced by low level of H(2)O(2). Many tumour cells are characterised by increased ROS levels compared with their noncancerous counterparts. Therefore, we investigated whether phenolic acids, at low concentrations, comparable to those present in human plasma, were able to decrease basal reactive species. Results show that phenolic acids reduced ROS in a leukaemia cell line (HEL), whereas no effect was observed in normal cells, such as HUVEC. The compounds exhibited no toxicity to normal cells while they decreased proliferation in leukaemia cells, inducing apoptosis. In the debate on optimal ROS-manipulating strategies in cancer therapy, our work in leukaemia cells supports the antioxidant ROS-depleting approach.
Figures
Similar articles
-
Melatonin attenuates homocysteine-induced injury in human umbilical vein endothelial cells.Fundam Clin Pharmacol. 2018 Jun;32(3):261-269. doi: 10.1111/fcp.12355. Epub 2018 Mar 24. Fundam Clin Pharmacol. 2018. PMID: 29436019
-
Protective effects of extracts from Ephedra foeminea Forssk fruits against oxidative injury in human endothelial cells.J Ethnopharmacol. 2020 Oct 5;260:112976. doi: 10.1016/j.jep.2020.112976. Epub 2020 May 16. J Ethnopharmacol. 2020. PMID: 32428657
-
Neuroprotective Effects of Phenolic and Carboxylic Acids on Oxidative Stress-Induced Toxicity in Human Neuroblastoma SH-SY5Y Cells.Neurochem Res. 2018 Mar;43(3):619-636. doi: 10.1007/s11064-017-2463-x. Epub 2018 Feb 7. Neurochem Res. 2018. PMID: 29417471
-
Polyphenols in Food: Cancer Prevention and Apoptosis Induction.Curr Med Chem. 2018;25(36):4740-4757. doi: 10.2174/0929867324666171006144208. Curr Med Chem. 2018. PMID: 28990504 Review.
-
An overview on the role of dietary phenolics for the treatment of cancers.Nutr J. 2016 Dec 1;15(1):99. doi: 10.1186/s12937-016-0217-2. Nutr J. 2016. PMID: 27903278 Free PMC article. Review.
Cited by
-
Investigations of anticholinestrase and antioxidant potentials of methanolic extract, subsequent fractions, crude saponins and flavonoids isolated from Isodon rugosus.Biol Res. 2014 Dec 26;47(1):76. doi: 10.1186/0717-6287-47-76. Biol Res. 2014. PMID: 25723481 Free PMC article.
-
Biologically Active Compounds of Plants: Structure-Related Antioxidant, Microbiological and Cytotoxic Activity of Selected Carboxylic Acids.Materials (Basel). 2020 Oct 8;13(19):4454. doi: 10.3390/ma13194454. Materials (Basel). 2020. PMID: 33049979 Free PMC article. Review.
-
Esculetin Neutralises Cytotoxicity of t-BHP but Not of H2O2 on Human Leukaemia NB4 Cells.Biomed Res Int. 2017;2017:9491045. doi: 10.1155/2017/9491045. Epub 2017 Mar 7. Biomed Res Int. 2017. PMID: 28367450 Free PMC article.
-
The Cancer-Protective Potential of Protocatechuic Acid: A Narrative Review.Molecules. 2024 Mar 23;29(7):1439. doi: 10.3390/molecules29071439. Molecules. 2024. PMID: 38611719 Free PMC article. Review.
-
The Impact of Coffee and Its Selected Bioactive Compounds on the Development and Progression of Colorectal Cancer In Vivo and In Vitro.Molecules. 2018 Dec 13;23(12):3309. doi: 10.3390/molecules23123309. Molecules. 2018. PMID: 30551667 Free PMC article. Review.
References
-
- Quideau S, Deffieux D, Douat-Casassus C, Pouységu L. Plant polyphenols: chemical properties, biological activities, and synthesis. Angewandte Chemie. 2011;50(3):586–621. - PubMed
-
- Lafay S, Gil-Izquierdo A. Bioavailability of phenolic acids. Phytochemistry Reviews. 2008;7(2):301–311.
-
- Manach C, Scalbert A, Morand C, Rémésy C, Jiménez L. Polyphenols: food sources and bioavailability. The American Journal of Clinical Nutrition. 2004;79(5):727–747. - PubMed
-
- Manach C, Williamson G, Morand C, Scalbert A, Rémésy C. Bioavailability and bioefficacy of polyphenols in humans. I. Review of 97 bioavailability studies. The American Journal of Clinical Nutrition. 2005;81(1, supplement):230S–242S. - PubMed
-
- D’Archivio M, Filesi C, Di Benedetto R, Gargiulo R, Giovannini C, Masella R. Polyphenols, dietary sources and bioavailability. Annali dell’Istituto Superiore di Sanita. 2007;43(4):348–361. - PubMed
Publication types
MeSH terms
Substances
LinkOut - more resources
Full Text Sources
Medical
