

Development of brainstem-evoked responses in congenital auditory deprivation
- PMID: 22792488
- PMCID: PMC3389724
- DOI: 10.1155/2012/182767
Development of brainstem-evoked responses in congenital auditory deprivation
Erratum in
- Neural Plast. 2012;2012:168297
Abstract
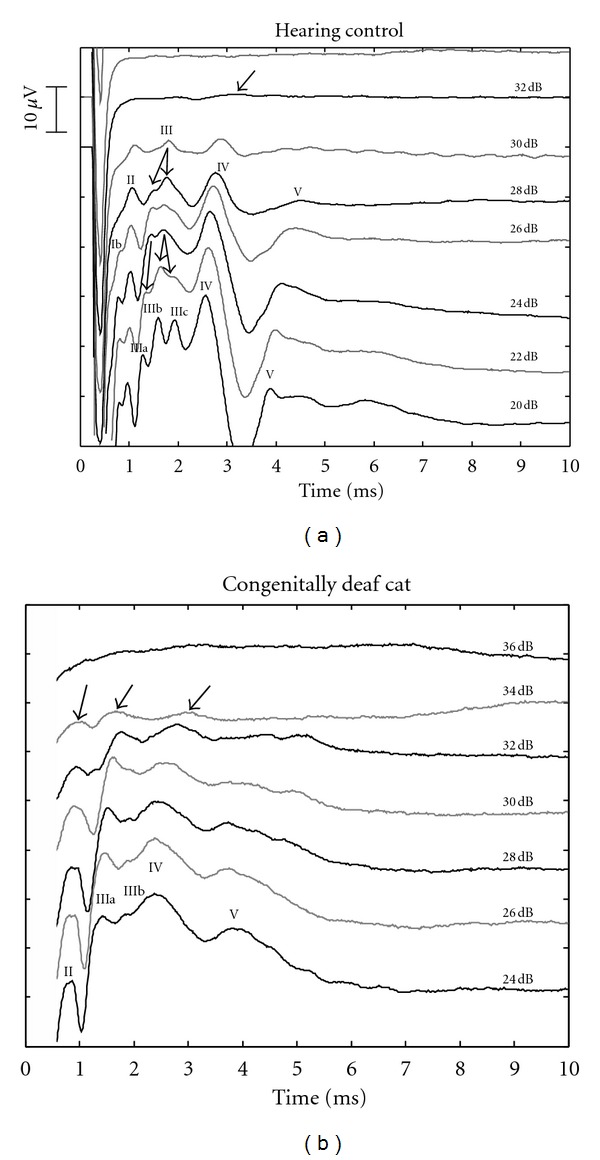
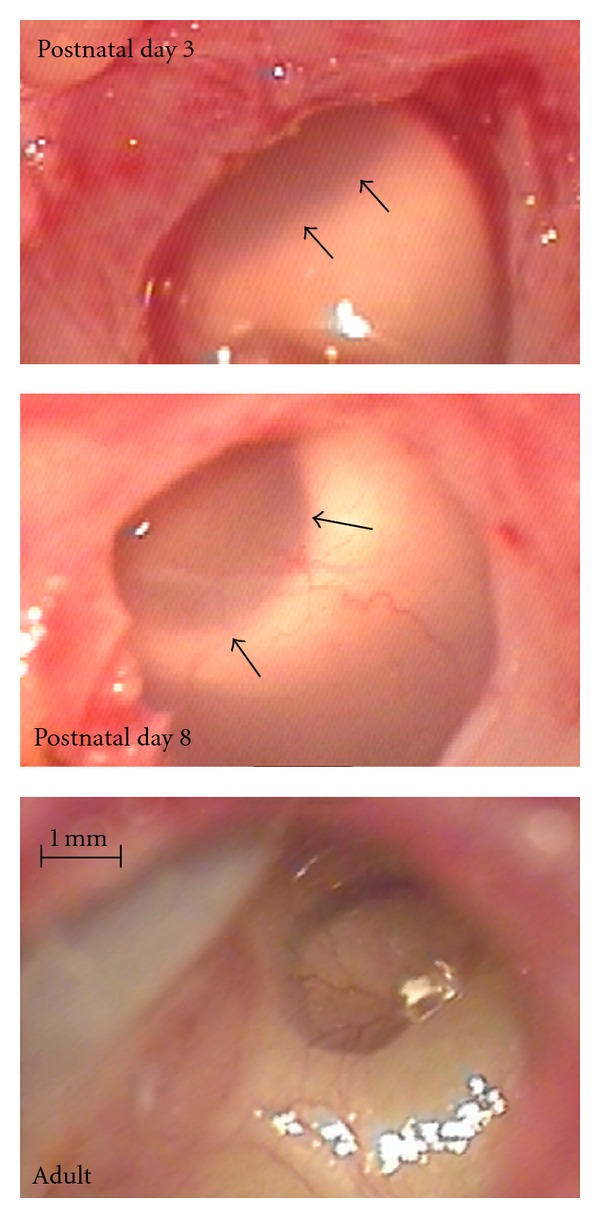
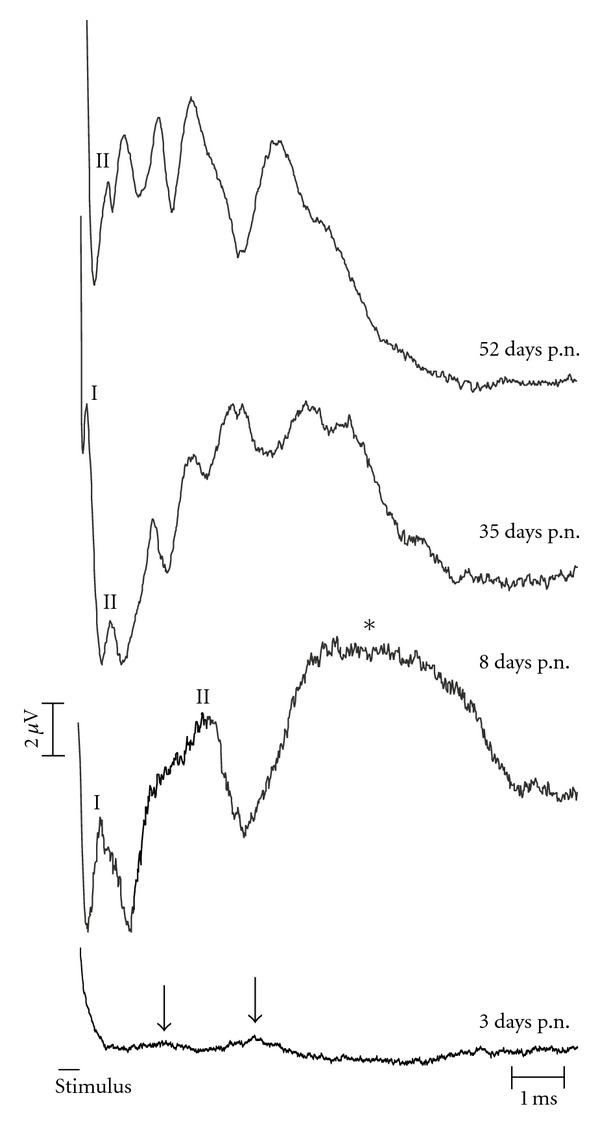
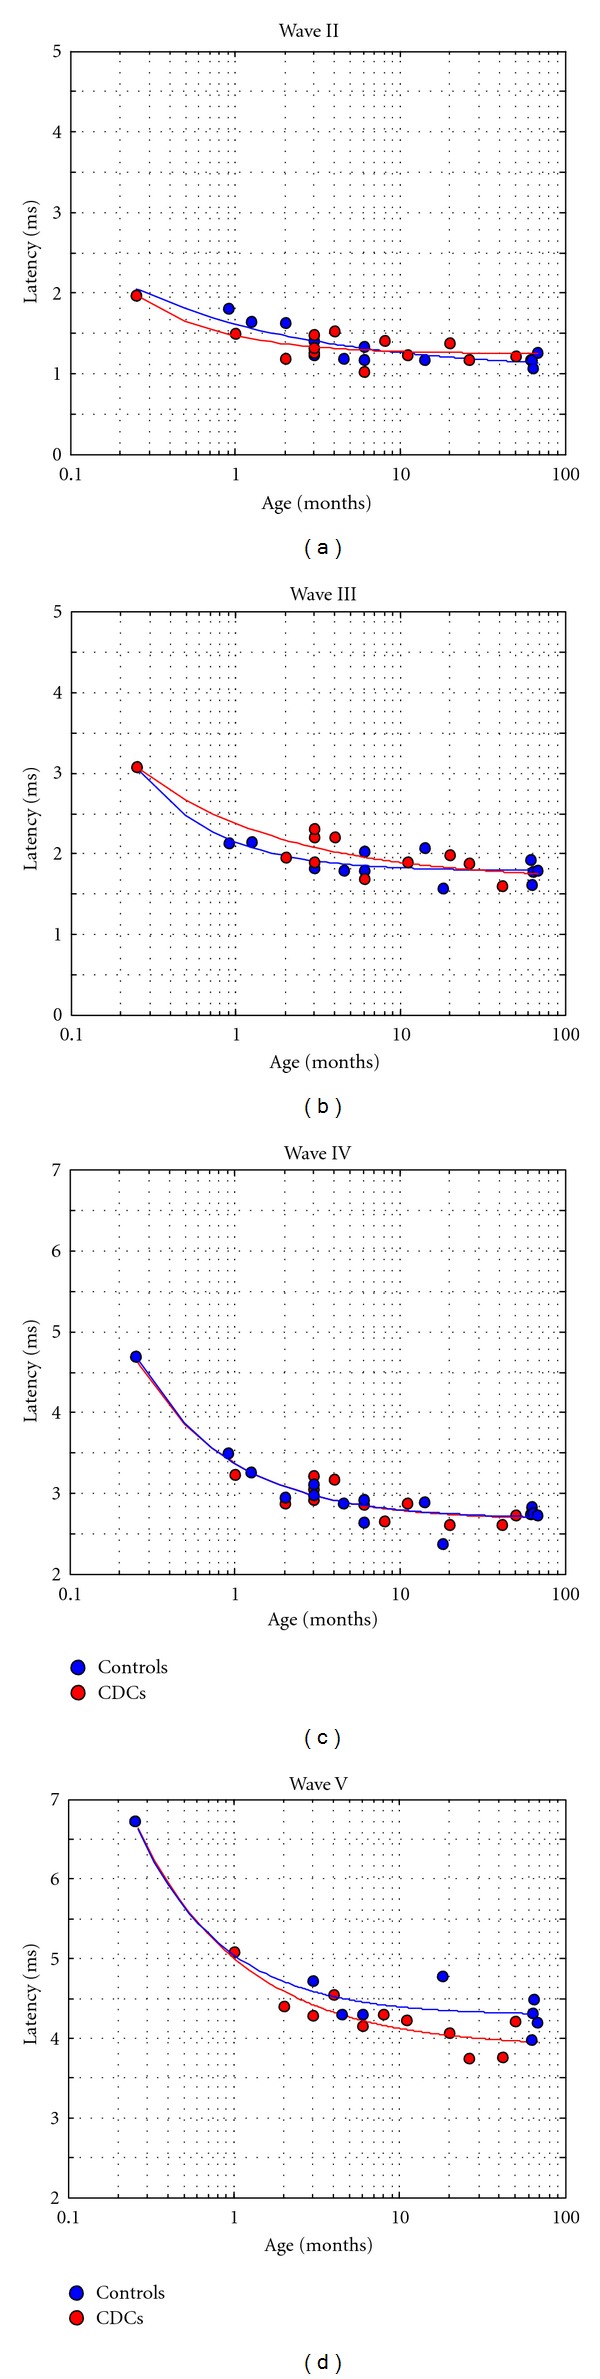
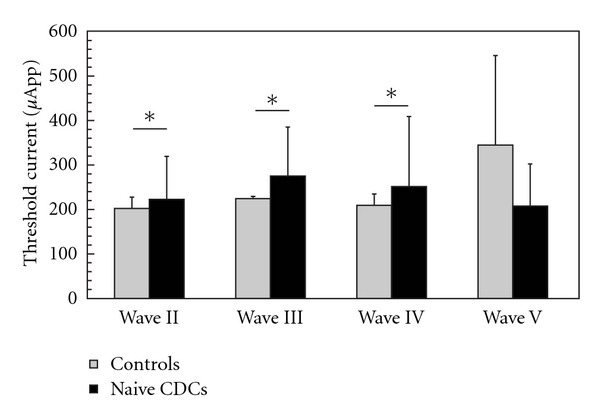
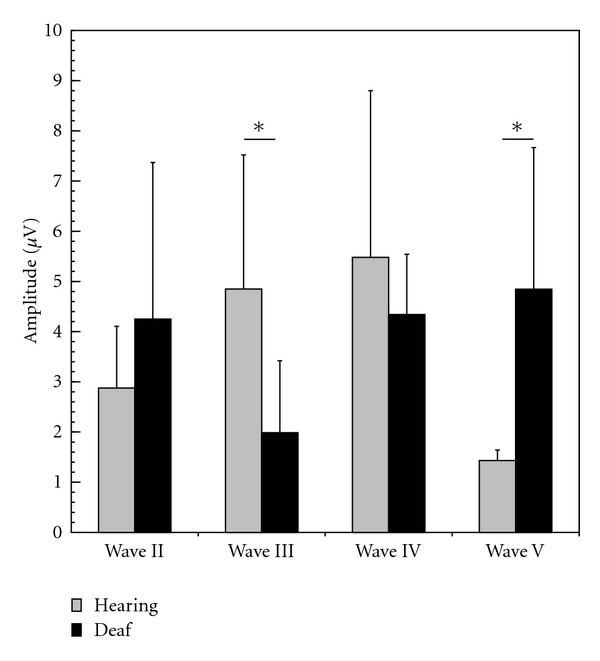
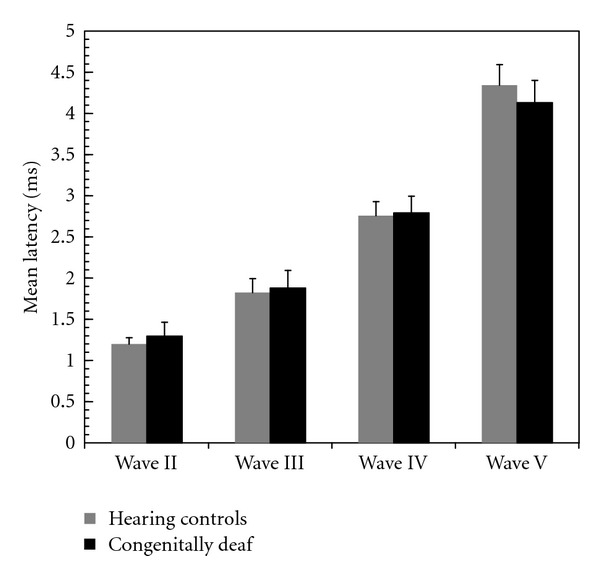
To compare the development of the auditory system in hearing and completely acoustically deprived animals, naive congenitally deaf white cats (CDCs) and hearing controls (HCs) were investigated at different developmental stages from birth till adulthood. The CDCs had no hearing experience before the acute experiment. In both groups of animals, responses to cochlear implant stimulation were acutely assessed. Electrically evoked auditory brainstem responses (E-ABRs) were recorded with monopolar stimulation at different current levels. CDCs demonstrated extensive development of E-ABRs, from first signs of responses at postnatal (p.n.) day 3 through appearance of all waves of brainstem response at day 8 p.n. to mature responses around day 90 p.n.. Wave I of E-ABRs could not be distinguished from the artifact in majority of CDCs, whereas in HCs, it was clearly separated from the stimulus artifact. Waves II, III, and IV demonstrated higher thresholds in CDCs, whereas this difference was not found for wave V. Amplitudes of wave III were significantly higher in HCs, whereas wave V amplitudes were significantly higher in CDCs. No differences in latencies were observed between the animal groups. These data demonstrate significant postnatal subcortical development in absence of hearing, and also divergent effects of deafness on early waves II-IV and wave V of the E-ABR.
Figures
Similar articles
-
The pattern of auditory brainstem response wave V maturation in cochlear-implanted children.Clin Neurophysiol. 2007 Mar;118(3):676-89. doi: 10.1016/j.clinph.2006.11.010. Epub 2007 Jan 16. Clin Neurophysiol. 2007. PMID: 17223382
-
Response of the primary auditory cortex to electrical stimulation of the auditory nerve in the congenitally deaf white cat.Hear Res. 1997 Oct;112(1-2):115-33. doi: 10.1016/s0378-5955(97)00114-7. Hear Res. 1997. PMID: 9367234
-
Congenital deafness reduces alpha-gamma cross-frequency coupling in the auditory cortex.Hear Res. 2024 Aug;449:109032. doi: 10.1016/j.heares.2024.109032. Epub 2024 May 17. Hear Res. 2024. PMID: 38797035
-
Use it or lose it? Lessons learned from the developing brains of children who are deaf and use cochlear implants to hear.Brain Topogr. 2011 Oct;24(3-4):204-19. doi: 10.1007/s10548-011-0181-2. Epub 2011 Apr 11. Brain Topogr. 2011. PMID: 21479928 Review.
-
Cortical development, plasticity and re-organization in children with cochlear implants.J Commun Disord. 2009 Jul-Aug;42(4):272-9. doi: 10.1016/j.jcomdis.2009.03.003. Epub 2009 Apr 5. J Commun Disord. 2009. PMID: 19380150 Free PMC article. Review.
Cited by
-
Stability and plasticity of auditory brainstem function across the lifespan.Cereb Cortex. 2015 Jun;25(6):1415-26. doi: 10.1093/cercor/bht311. Epub 2013 Dec 22. Cereb Cortex. 2015. PMID: 24366906 Free PMC article.
-
[Pathophysiology of hearing loss : Classification and treatment options].HNO. 2017 Apr;65(4):290-297. doi: 10.1007/s00106-016-0183-1. HNO. 2017. PMID: 27299892 Review. German.
-
Auditory reserve and the legacy of auditory experience.Brain Sci. 2014 Nov 14;4(4):575-93. doi: 10.3390/brainsci4040575. Brain Sci. 2014. PMID: 25405381 Free PMC article.
-
Neurocognitive factors in sensory restoration of early deafness: a connectome model.Lancet Neurol. 2016 May;15(6):610-21. doi: 10.1016/S1474-4422(16)00034-X. Epub 2016 Mar 12. Lancet Neurol. 2016. PMID: 26976647 Free PMC article. Review.
-
Monaural Congenital Deafness Affects Aural Dominance and Degrades Binaural Processing.Cereb Cortex. 2016 Apr;26(4):1762-77. doi: 10.1093/cercor/bhv351. Epub 2016 Jan 22. Cereb Cortex. 2016. PMID: 26803166 Free PMC article.
References
-
- Kral A. Unimodal and cross-modal plasticity in the “deaf” auditory cortex. International Journal of Audiology. 2007;46(9):479–493. - PubMed
-
- Kapfer C, Seidl AH, Schweizer H, Grothe B. Experience-dependent refinement of inhibitory inputs to auditory coincidence-detector neurons. Nature Neuroscience. 2002;5(3):247–253. - PubMed
-
- Brand A, Behrend O, Marquardt T, McAlpine T, Grothe B. Precise inhibition is essential for microsecond interaural time difference coding. Nature. 2002;417(6888):543–547. - PubMed
-
- Mair IWS. Hereditary deafness in the white cat. Acta Oto-Laryngologica. Supplementum. 1973;314:1–48. - PubMed
-
- Heid S, Hartmann R, Klinke R. A model for prelingual deafness, the congenitally deaf white cat—population statistics and degenerative changes. Hearing Research. 1998;115(1-2):101–112. - PubMed
Publication types
MeSH terms
LinkOut - more resources
Full Text Sources
Medical
Miscellaneous
