

The importance of rating scales in measuring patient-reported outcomes
- PMID: 22794788
- PMCID: PMC3503574
- DOI: 10.1186/1477-7525-10-80
The importance of rating scales in measuring patient-reported outcomes
Abstract
Background: A critical component that influences the measurement properties of a patient-reported outcome (PRO) instrument is the rating scale. Yet, there is a lack of general consensus regarding optimal rating scale format, including aspects of question structure, the number and the labels of response categories. This study aims to explore the characteristics of rating scales that function well and those that do not, and thereby develop guidelines for formulating rating scales.
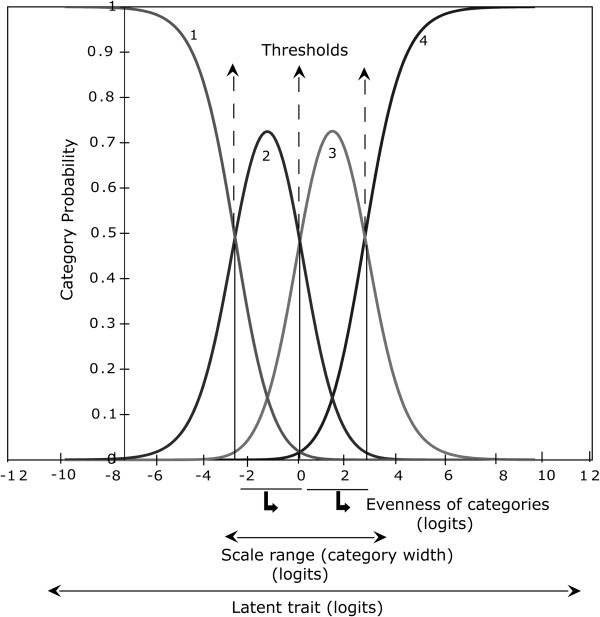
Methods: Seventeen existing PROs designed to measure vision-related quality of life dimensions were mailed for self-administration, in sets of 10, to patients who were on a waiting list for cataract extraction. These PROs included questions with ratings of difficulty, frequency, severity, and global ratings. Using Rasch analysis, performance of rating scales were assessed by examining hierarchical ordering (indicating categories are distinct from each other and follow a logical transition from lower to higher value), evenness (indicating relative utilization of categories), and range (indicating coverage of the attribute by the rating scale).
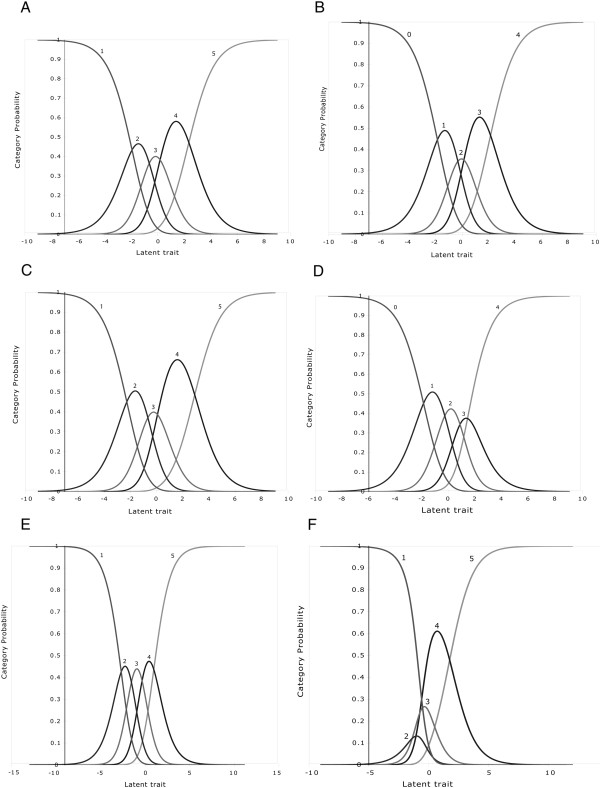
Results: The rating scales with complicated question format, a large number of response categories, or unlabelled categories, tended to be dysfunctional. Rating scales with five or fewer response categories tended to be functional. Most of the rating scales measuring difficulty performed well. The rating scales measuring frequency and severity demonstrated hierarchical ordering but the categories lacked even utilization.
Conclusion: Developers of PRO instruments should use a simple question format, fewer (four to five) and labelled response categories.
Figures
Similar articles
-
Multiplicative rating scales do not enable measurement of vision-related quality of life.Clin Exp Optom. 2011 Jan;94(1):52-62. doi: 10.1111/j.1444-0938.2010.00554.x. Clin Exp Optom. 2011. PMID: 21198834
-
The importance of rating scale design in the measurement of patient-reported outcomes using questionnaires or item banks.Invest Ophthalmol Vis Sci. 2012 Jun 26;53(7):4042-54. doi: 10.1167/iovs.12-9728. Invest Ophthalmol Vis Sci. 2012. PMID: 22618597
-
Catquest questionnaire: re-validation in an Australian cataract population.Clin Exp Ophthalmol. 2009 Nov;37(8):785-94. doi: 10.1111/j.1442-9071.2009.02133.x. Clin Exp Ophthalmol. 2009. PMID: 19878224
-
The impact of cataract surgery on quality of life.Curr Opin Ophthalmol. 2011 Jan;22(1):19-27. doi: 10.1097/ICU.0b013e3283414284. Curr Opin Ophthalmol. 2011. PMID: 21088580 Review.
-
[Evaluation of the quality of life in ophthalmology].Presse Med. 2002 Oct 19;31(34):1607-12. Presse Med. 2002. PMID: 12426979 Review. French.
Cited by
-
Sun protection behaviour checklist for targeted counselling in skin cancer patients.Australas J Dermatol. 2022 Aug;63(3):392-394. doi: 10.1111/ajd.13845. Epub 2022 Apr 23. Australas J Dermatol. 2022. PMID: 35460573 Free PMC article. No abstract available.
-
Recent advances in patient and proxy-reported quality of life research.Health Qual Life Outcomes. 2014 Aug 29;12:110. doi: 10.1186/s12955-014-0110-7. Health Qual Life Outcomes. 2014. PMID: 25169205 Free PMC article. Review.
-
The influence of the refractive correction on the vision-related quality of life in keratoconus patients.Qual Life Res. 2016 Apr;25(4):1043-51. doi: 10.1007/s11136-015-1117-1. Epub 2015 Sep 3. Qual Life Res. 2016. PMID: 26334843
-
Development and validation of the living with pulmonary hypertension questionnaire in pulmonary arterial hypertension patients.Health Qual Life Outcomes. 2013 Oct 3;11:161. doi: 10.1186/1477-7525-11-161. Health Qual Life Outcomes. 2013. PMID: 24088389 Free PMC article.
-
Development of a New Patient-reported Outcome Instrument to Evaluate Treatments for Scars: The SCAR-Q.Plast Reconstr Surg Glob Open. 2018 Apr 24;6(4):e1672. doi: 10.1097/GOX.0000000000001672. eCollection 2018 Apr. Plast Reconstr Surg Glob Open. 2018. PMID: 29876160 Free PMC article.
References
Publication types
MeSH terms
LinkOut - more resources
Full Text Sources
Miscellaneous
