. 2012 Jul 27;47(2):203-14.
doi: 10.1016/j.molcel.2012.06.010. Epub 2012 Jul 12.

Independence of repressive histone marks and chromatin compaction during senescent heterochromatic layer formation

Affiliations

Independence of repressive histone marks and chromatin compaction during senescent heterochromatic layer formation

Tamir Chandra et al. Mol Cell. .

Abstract

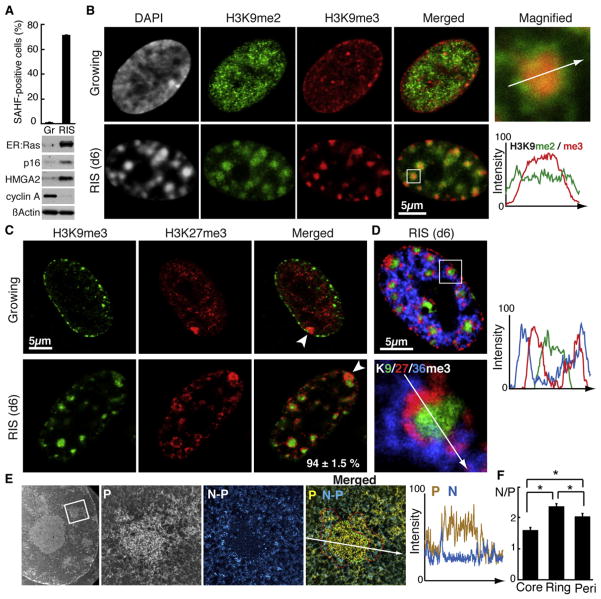
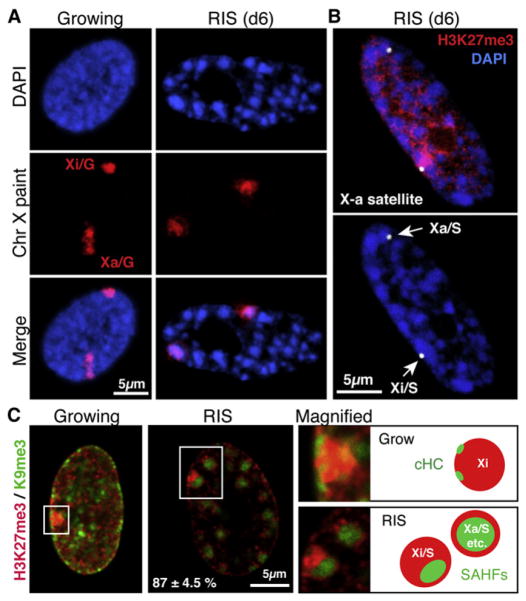
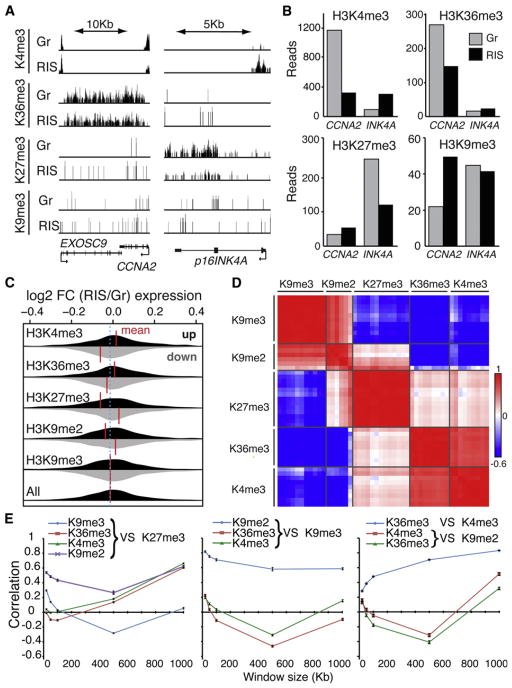
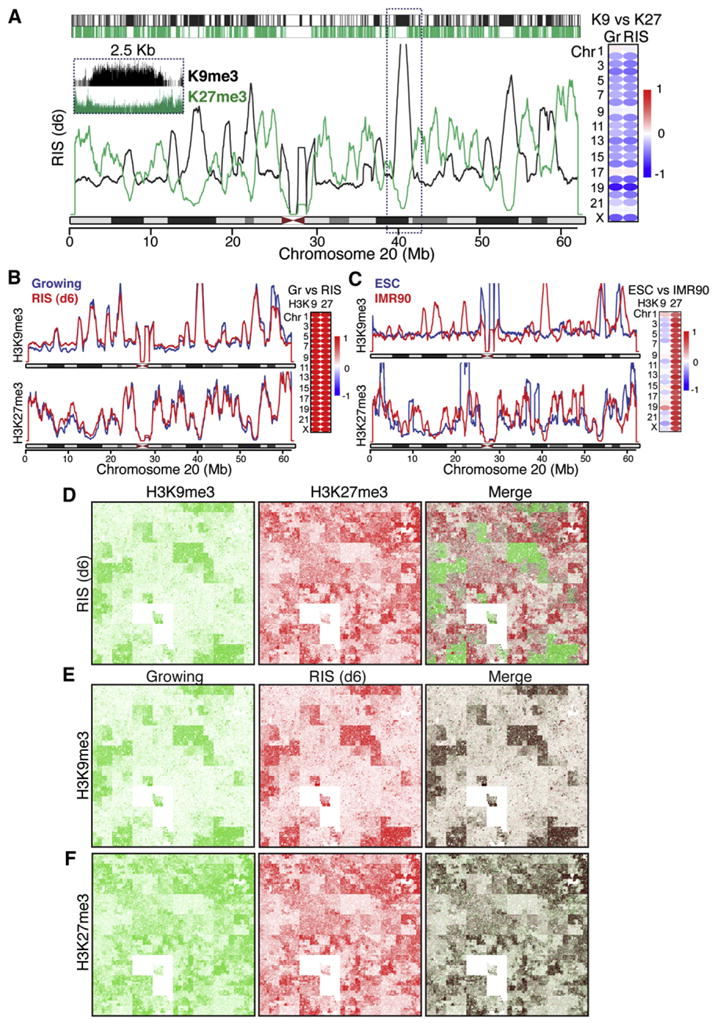
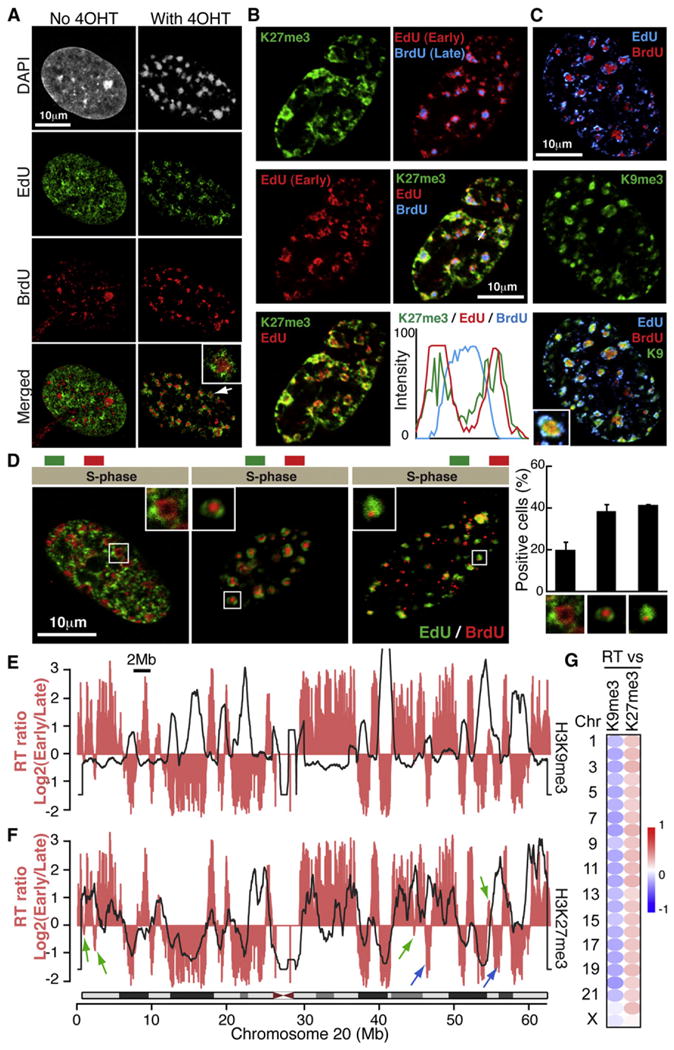
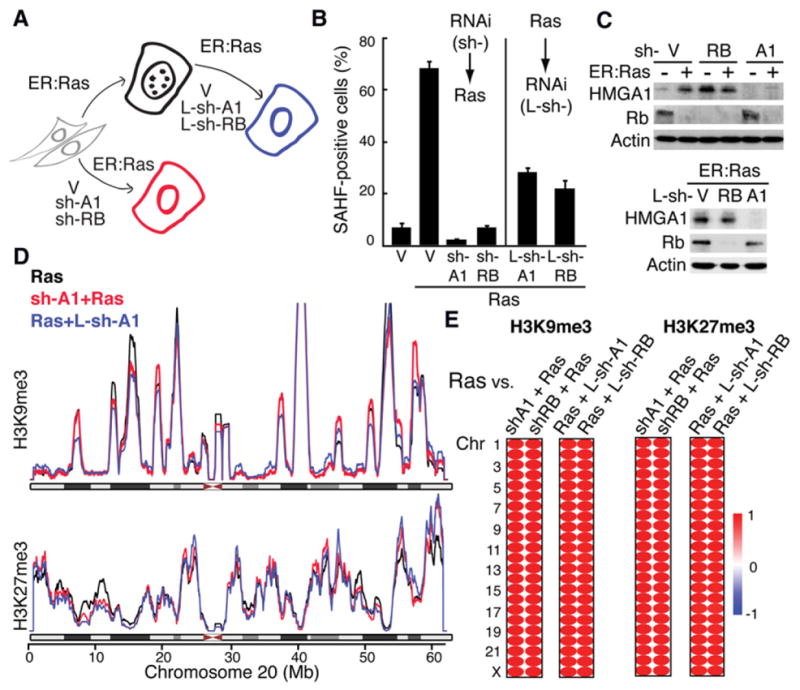
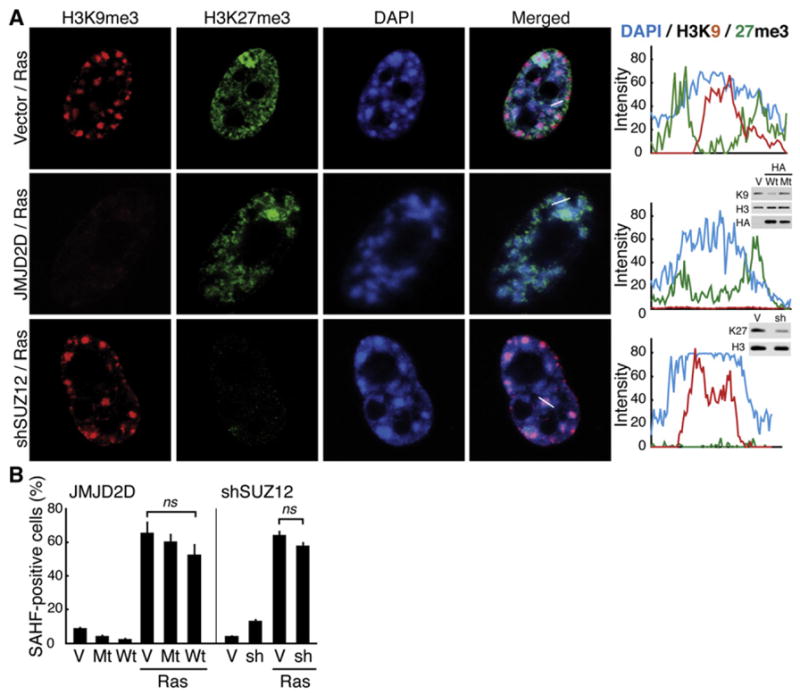
The expansion of repressive epigenetic marks has been implicated in heterochromatin formation during embryonic development, but the general applicability of this mechanism is unclear. Here we show that nuclear rearrangement of repressive histone marks H3K9me3 and H3K27me3 into nonoverlapping structural layers characterizes senescence-associated heterochromatic foci (SAHF) formation in human fibroblasts. However, the global landscape of these repressive marks remains unchanged upon SAHF formation, suggesting that in somatic cells, heterochromatin can be formed through the spatial repositioning of pre-existing repressively marked histones. This model is reinforced by the correlation of presenescent replication timing with both the subsequent layered structure of SAHFs and the global landscape of the repressive marks, allowing us to integrate microscopic and genomic information. Furthermore, modulation of SAHF structure does not affect the occupancy of these repressive marks, nor vice versa. These experiments reveal that high-order heterochromatin formation and epigenetic remodeling of the genome can be discrete events.


Figures

Figure 1
Figure 1. SAHF Chromatin Segregates into H3K9me3 Core and H3K27me3 Ring
(A) ER:Ras-expressing IMR90 cells were assessed for SAHFs and expression of the proteins indicated. Gr, growing (no 4OHT); RIS, d6 Ras-induced senescent cells. p16 and HMGA2, senescence markers; Cyclin A, a cell-cycle marker. Data are shown as mean ± SEM (n > 3). (B–D) Confocal images for indicated histone marks in cells indicated. The region indicated by the rectangle is magnified. The arrow indicates the path over which the fluorescent intensity was profiled (B and D). Arrowheads depict the Xi (C). The number represents the proportion of Xi, in SAHF-positive cells, displaying the typical H3K9me3 core with associated H3K27me3 ring (percent ± SEM, 176 cells from three independent experiments were assessed) (C). (E and F) Electron spectroscopic imaging (ESI) for phosphorous (P), nitrogen (N), and the N minus P (N – P), to delineate chromatin (P, yellow) and nonchromosomal (ribonucleo)protein (N – P, blue). The region indicated by the rectangle is magnified. The arrow indicates the path over which the intensity was profiled (E). Small, bright objects around the core represent gold particles labeling H3K27me3. The N/P ratio was calculated for the H3K9me3 core (core; green dashed line), the H3K27me3 ring (ring; red dashed line), and for perinuclear heterochromatin (peri; see Figure S1F) (F). Data are shown as mean ± SEM (16 SAHFs from three cells from two preparations). *p < 0.001. See also Figure S1.
Figure 2
Figure 2. Subchromosomal SAHF Formation in Xi
(A) Confocal images of DNA FISH with a chr X paint probe in the indicated conditions, as in Figure 1. (B) Confocal images of DNA FISH with a chr X alpha satellite probe (arrows) and immunofluorescence for H3K27me3. Xa/S and Xi/S represent the active and inactive chr X, respectively. (C) Merged confocal images for H3K27me3 and H3K9me3. The right hand panels are magnified images of the regions indicated by the rectangles and their corresponding schemes. Proportion of Xi/S displaying a clear H3K9me3 core with H3K27me3 ring (percent ± SEM); 35 Xi/S from four independent experiments were counted.
Figure 3
Figure 3. Genome-wide Mapping of Histone Marks in Growing and RIS IMR90 Cells
(A and B) Genome browser representations (A) and read counts (B) of ChIP-seq data for the indicated histone marks at the CCNA2 and p16INK4A loci. Gr, growing; RIS, d6 Ras-induced senescent. Read counts are shown for 500 bp upstream and 5,000 bp downstream of each transcription start site (TSS). (C) Distribution of gene expression values for genes with greatest changes in read counts for each histone mark indicated. Read counts were determined as in (B). The 1,000 genes with the greatest increase (black) or decrease (gray) in number of reads in RIS over Gr cells were plotted for the distribution of differential expression fold changes (FC, RIS/Gr) from the corresponding expression microarray data sets. Vertical red lines indicate the mean fold changes. (D and E) Read density cluster analysis of 48 ChIP-seq samples (Table S2) for the indicated histone marks, with a window size of 500 Kb (D). The correlation between the indicated histone marks is plotted against different window sizes (mean ± SEM) (E). See also Figure S2, Table S1, and Table S2.
Figure 4
Figure 4. Spatial Repositioning of Pre-existing Repressive Histone Marks to Form SAHFs
(A) Chromosome-wide landscape of repressive histone marks. The window size is 1 Kb, and the smoothing unit is 1,000. Top: Significantly enriched regions for each mark, determined by RSEG, are sketched with a 1 Kb window size. The browser shot of the region indicated by the rectangle is shown in the inset. Spearman correlations between H3K9me3 versus H3K27me3 in Growing (Gr) or Ras-induced senescent (RIS) cells are shown for all chromosomes. (B) Unaltered landscape of H3K9me3 and H3K27me3 marks between Gr and RIS cells on chromosome 20. Chromosome-wide spearman correlations between Gr and RIS cells for each mark are shown. (C) Marked changes in the landscape of H3K9me3 and H3K27me3 between ESCs and IMR90 cells on chromosome 20. Publicly available ChIP-seq data (Hawkins et al., 2010) were reanalyzed as in (B). (D–F) Chromosome-wide profiles of the ChIP-seq data visualized by Hilbert curves for the indicated marks and cells. The merged images were generated with Photoshop, using blending mode “darken.” See also Figure S3.
Figure 5
Figure 5. Spatiotemporal Correlation between SAHF Architecture and Replication Timing
(A) Radial distribution of DNA during SAHF formation according to replication timing (RT). After release of synchronization at the G1-S border, early- and late-replicating DNA was labeled by EdU and BrdU, respectively, followed by Ras induction. Confocal images for EdU/BrdU are shown. The focus indicated by the arrow is magnified. (B and C) Confocal images for the costaining of EdU/BrdU and repressive histone marks. Intensity profiles of fluorescence along the white line indicated in the merged panel is shown (B). (D) Three spatiotemporal patterns of RT in RIS cells. Asynchronous cells were labeled with EdU/BrdU, followed by Ras induction as in (A). Data are shown as mean ± SEM (131 cells from three independent experiments were assessed). (E and F) Global association between RT and indicated marks. The landscape for the RT ratio (pink) and the indicated histone marks (black lines) in growing IMR90 cells were overlaid for chromosome 20. Regions that show a negative correlation between RT and H3K27me3 profiles are indicated by blue arrows. Green arrows indicate mid-replicating regions. (G) Spearman correlations between RT and repressive marks in all chromosomes. See also Figure S4.
Figure 6
Figure 6. Independence of High-Order Heterochromatin Compaction and Repressive Histone Marks in SAHFs
(A) Overview of experiments: SAHF formation can be prevented by either sh-HMGA1 (sh-A1) or sh-RB during RIS. SAHFs can also be disrupted by lentivirus-mediated shRNAs (L-sh-A1 or L-sh-RB) after RIS establishment. (B) SAHF counts for the experiments described in (A). Data are shown as mean ± SEM. (C) Western blots for the proteins indicated, in the conditions indicated in (A). (D) Chromosomal landscapes plotted as in Figure 4 for H3K9me3 and H3K27me3 in the conditions indicated in (A). (E) Spearman correlations between Ras cells and the cells indicated.
Figure 7
Figure 7. Perturbation of the Repressive Histone Marks Does Not Prevent SAHF Formation
(A) Confocal images for the marks indicated. ER:Ras-expressing cells were infected with retroviruses expressing HA-JMJD2D (a demethylase of H3K9me3) or sh-SUZ12, and then ER:Ras was induced by 4OHT for 6 days. Intensity profiles of fluorescence along the white lines indicated in the merged panels are shown. Western blots show the extent of the reduction for each mark. Wt, wild-type HA-JMJD2D; Mt, a catalytically inactive mutant, H192A. (B) Quantitative analysis of the effect of the depletion of each repressive mark on SAHF formation. Data are shown as mean ± SEM. See also Figure S5.

References

    1. Adams PD. Remodeling of chromatin structure in senescent cells and its potential impact on tumor suppression and aging. Gene. 2007;397:84–93. - PMC - PubMed
    1. Agger K, Cloos PAC, Rudkjaer L, Williams K, Andersen G, Christensen J, Helin K. The H3K27me3 demethylase JMJD3 contributes to the activation of the INK4A-ARF locus in response to oncogene- and stress-induced senescence. Genes Dev. 2009;23:1171–1176. - PMC - PubMed
    1. Ahmed K, Dehghani H, Rugg-Gunn P, Fussner E, Rossant J, Bazett-Jones DP. Global chromatin architecture reflects pluripotency and lineage commitment in the early mouse embryo. PLoS ONE. 2010;5:e10531. - PMC - PubMed
    1. Ait-Si-Ali S, Guasconi V, Fritsch L, Yahi H, Sekhri R, Naguibneva I, Robin P, Cabon F, Polesskaya A, Harel-Bellan A. A Suv39h-dependent mechanism for silencing S-phase genes in differentiating but not in cycling cells. EMBO J. 2004;23:605–615. - PMC - PubMed
    1. Anders S. Visualization of genomic data with the Hilbert curve. Bioinformatics. 2009;25:1231–1235. - PMC - PubMed

Publication types

Associated data