. 2012 Aug 24;47(4):585-95.
doi: 10.1016/j.molcel.2012.06.007. Epub 2012 Jul 12.

A class of allosteric caspase inhibitors identified by high-throughput screening

Affiliations

A class of allosteric caspase inhibitors identified by high-throughput screening

Taya Feldman et al. Mol Cell. .

Abstract

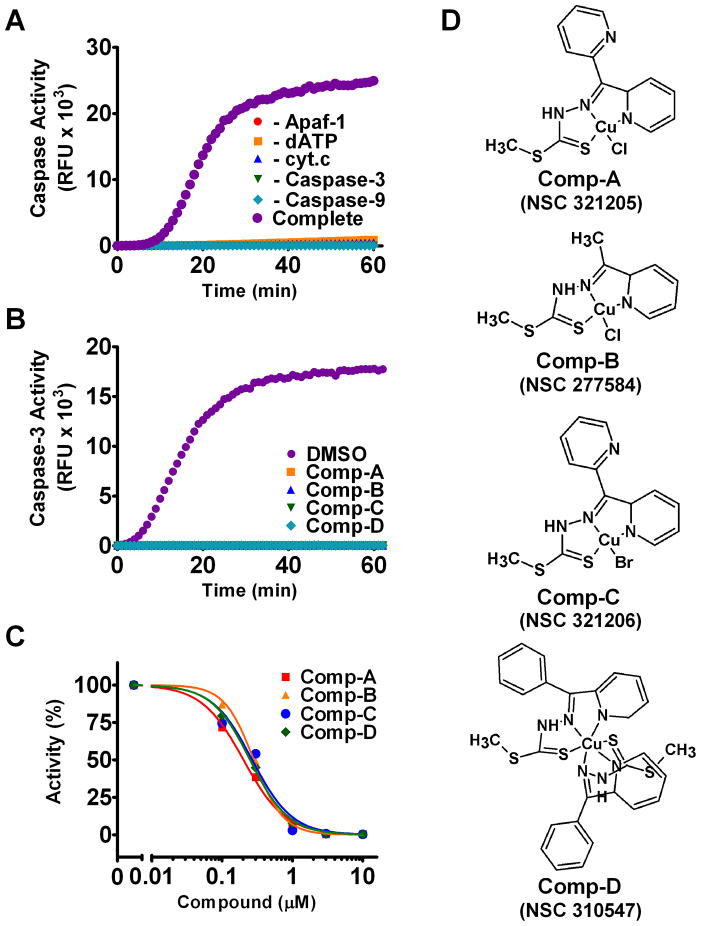
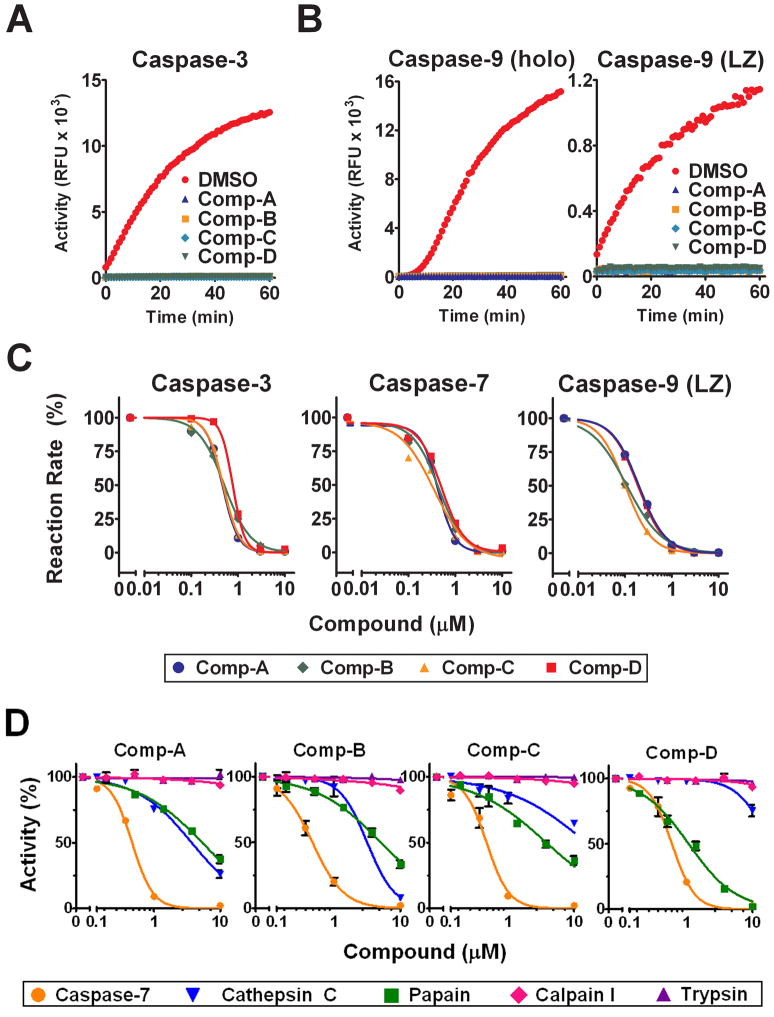
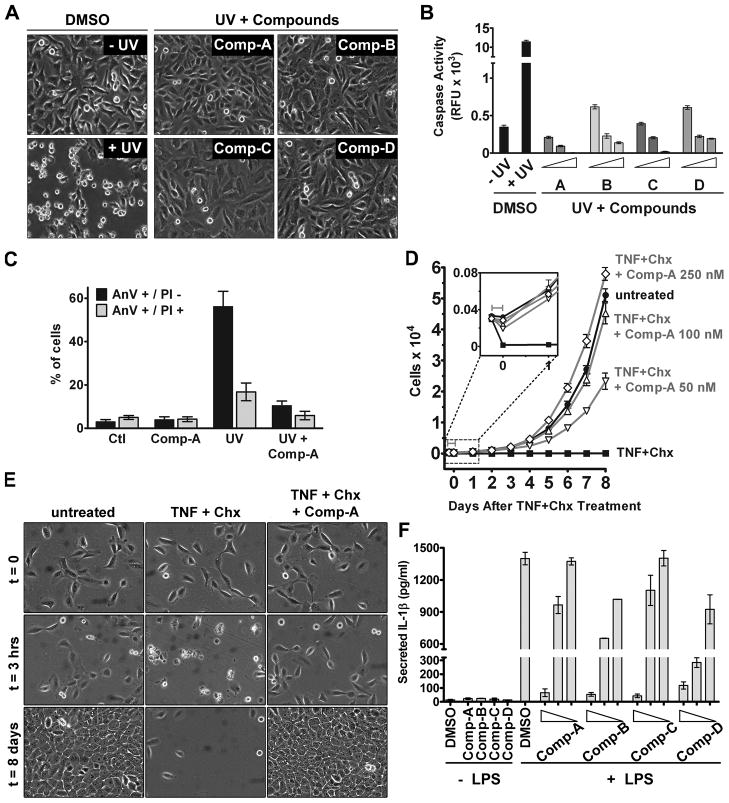
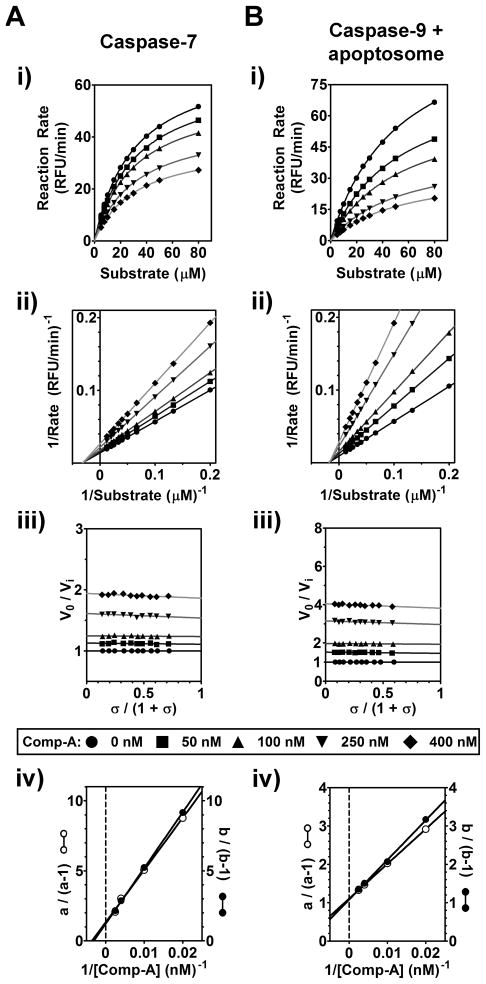
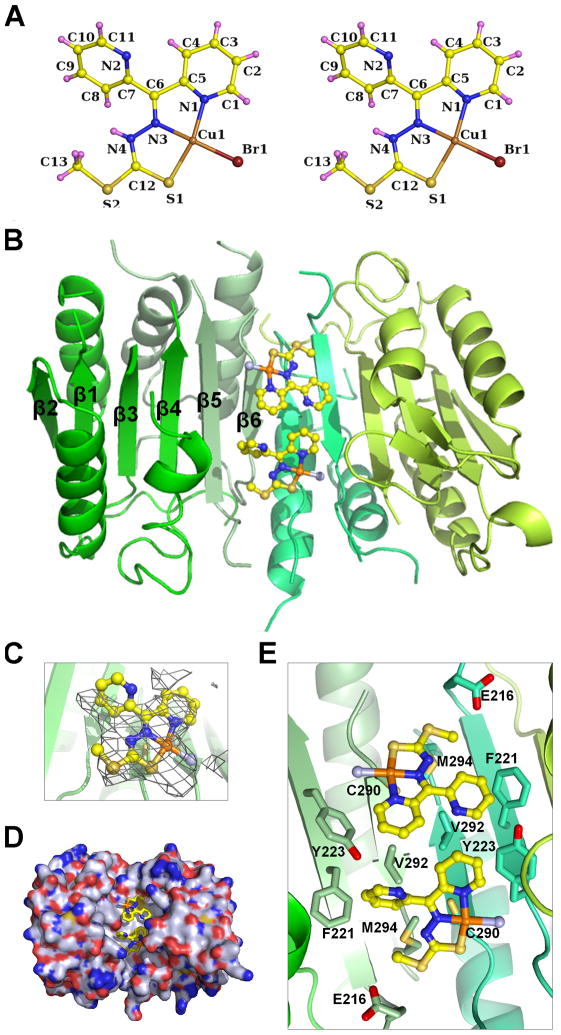
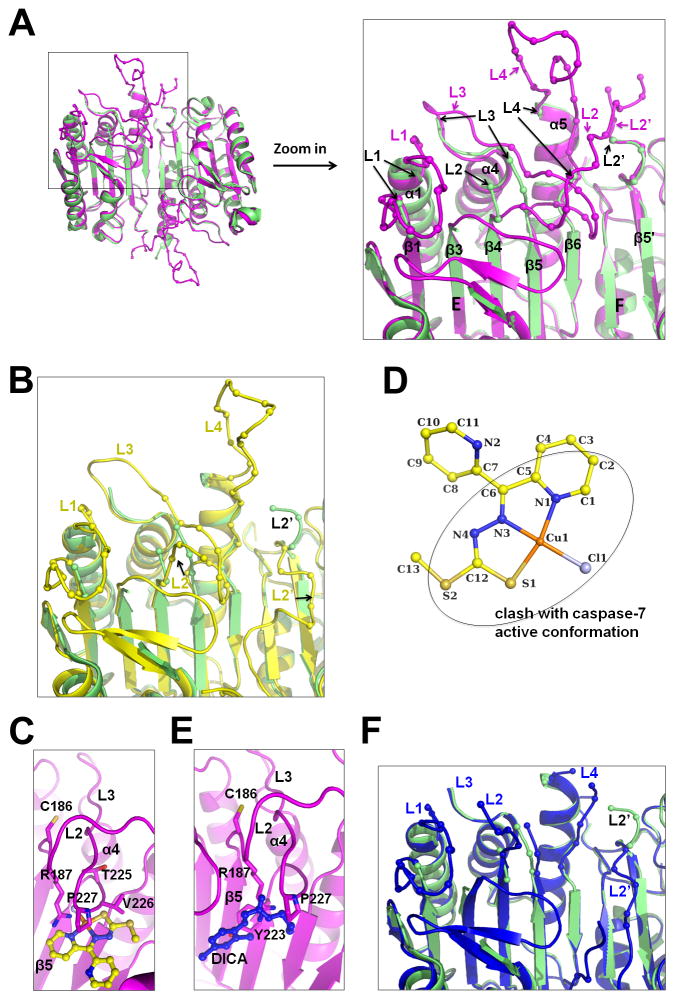
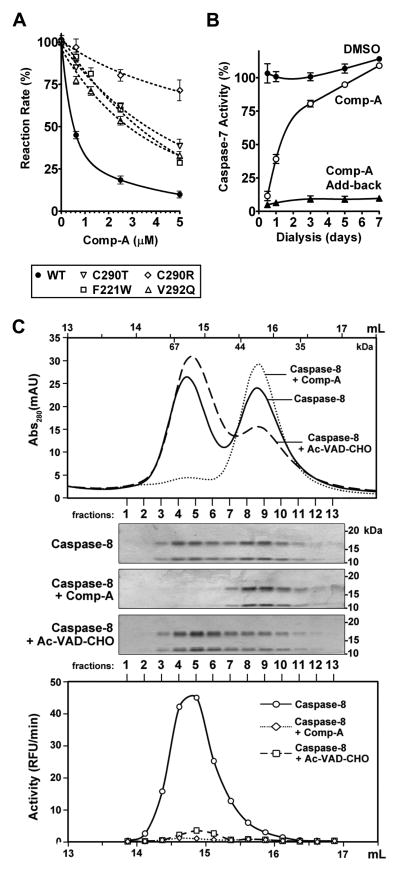
Caspase inhibition is a promising approach for treating multiple diseases. Using a reconstituted assay and high-throughput screening, we identified a group of nonpeptide caspase inhibitors. These inhibitors share common chemical scaffolds, suggesting the same mechanism of action. They can inhibit apoptosis in various cell types induced by multiple stimuli; they can also inhibit caspase-1-mediated interleukin generation in macrophages, indicating potential anti-inflammatory application. While these compounds inhibit all the tested caspases, kinetic analysis indicates they do not compete for the catalytic sites of the enzymes. The cocrystal structure of one of these compounds with caspase-7 reveals that it binds to the dimerization interface of the caspase, another common structural element shared by all active caspases. Consistently, biochemical analysis demonstrates that the compound abates caspase-8 dimerization. Based on these kinetic, biochemical, and structural analyses, we suggest that these compounds are allosteric caspase inhibitors that function through binding to the dimerization interface of caspases.


Figures

Figure 1
Figure 1. Identification of Inhibitors for Cytochrome c-Mediated Caspase Activation
(A) Time-course of the in vitro reconstituted cytochrome c-mediated caspase activity assay. For the reaction labeled “Complete,” Apaf-1, cytochrome c, dATP, procaspase-3, caspase-9, and a fluorogenic caspase-3 DEVD substrate were incubated. For other reactions, individual components were omitted as indicated. (B) Inhibition of caspase activation by 10 μM of each compound. (C) Dose response of compound inhibition of caspase activation. Compounds were added at the concentrations indicated. Activity is shown relative to DMSO control at the 20 minute time-point. (D) Structure of Compounds A, B, C, and D with NSC numbers. See also Figure S1.
Figure 2
Figure 2. The Identified Compounds Are Pan-caspase Inhibitors
(A) Inhibition of caspase-3. 2 nM of active recombinant caspase-3 were incubated with 10 μM compounds or DMSO. (B) Inhibition of caspase-9. Left panel: 20 nM of recombinant caspase-9 were incubated with Apaf-1, cytochrome c, dATP, and either 10 μM compounds or DMSO. Right panel: 200 nM of caspase-9 Leucine-Zipper (LZ) recombinant protein were incubated with 10 μM compounds or DMSO. (C) Normalized compound dose-response curves for caspases-3, -7, and -9-LZ. Recombinant caspase proteins (15 nM caspase-3, 20 nM caspase-7, 100 nM caspase-9-LZ) were incubated with compounds at the indicated concentrations in the presence of their corresponding fluorogenic substrates. Reaction rates are expressed relative to the DMSO control. (D) Protease specificity of compound inhibition. Recombinant caspase-7 (20 nM), cathepsin C (20 nM), papain (20 nM), calpain I (100 nM), and trypsin (20 nM) were incubated with compounds at the indicated concentrations in the presence of their corresponding fluorogenic substrates. Reaction rates are expressed relative to the DMSO control. See also Figure S2.
Figure 3
Figure 3. The Identified Compounds Inhibit Cellular Caspase Activation
(A) Compounds diminish UV-induced apoptotic morphology in HeLa cells. Cells were irradiated with UV and either DMSO or 100 nM of each compound was added to the culture medium. Cells were imaged 6 hours following irradiation. (B) Inhibition of caspase activation in HeLa cells. Cells were treated as in (A) and collected after 6 hours. Caspase activity in cell extracts was measured. Compound concentrations were 0.5, 1, and 3 μM, as indicated from left to right. Error bars represent the SEM from triplicate experiments. (C) Annexin V/PI double-staining of UV-treated HeLa cells. Cells were irradiated with UV in the presence or absence of Comp-A (100 nM). Cells were collected 6 hours following irradiation, stained with Annexin V-FITC and PI, and subjected to FACS analysis. Error bars represent the SEM of five experiments. (D) MCF10A cell growth following treatment with TNF-α and cycloheximide (Chx). Cells were treated with TNF-α and Chx in the presence of either DMSO or Comp-A at the indicated concentrations. After 3 hours (denoted by gray bar), TNF-α, cycloheximide, DMSO and Comp-A were removed and growth medium was replaced, and the number of viable cells was determined at the indicated time points using Resazurin dye. Error bars represent the SEM from triplicate experiments. (E) Long-term survival of MCF10A cells following TNF-α + cycloheximide induction. Cells were treated with TNF-α and Chx in the presence of either DMSO or 100 nM Comp-A as in (D). Cells were imaged before induction, 3 hours later, and 8 days later. (F) Inhibition of IL-1β secretion from J774 cells following LPS stimulation. J774 cells were stimulated with 1 μg/ml LPS in the presence of DMSO or compounds. After 24 hours, IL-1β in medium was measured by ELISA. Compound concentrations were 2, 1, and 0.5 μM, as indicated from left to right. Error bars represent the SEM from triplicate experiments. See also Figure S3.
Figure 4
Figure 4. Kinetic Analysis of Inhibition of Caspase-7 and Caspase-9 by Comp-A
Activity of caspase-7 (20 nM) (A) and caspase-9 (20 nM, with Apaf-1, cytochrome c, and dATP) (B) was determined in the presence of Comp-A at the indicated concentrations. (i) Substrate concentration curves of caspase activity in the presence of the indicated amount of Comp-A. The curves and numerical values of Vmax and Km represent nonlinear fitting of the data to the Michaelis-Menten equation using Prism software. (ii) Lineweaver-Burk double reciprocal transformation of the concentration-response curves in (i). Lines represent a linear least-squares fitting of the data. (iii) Specific velocity plot for the inhibition of caspases by Comp-A. The ratio of caspase activation rate in the absence of compound (V0) to the caspase activation rate in the presence of varying concentrations of Comp-A (Vi) was plotted as a function of the specific velocity σ/(1+σ), where σ= [S]/K m. (iv) Replot of the specific velocity plot. Two sets of intercepts on the ordinate axes of (iii) at abscissa value = 0 (defined as a) and 1 (defined as b) results in the resolution of kinetic parameters α, β, and Ki. Lines represent a linear least-squares fitting of the data. See also Figure S4 and Tables S1 and S2.
Figure 5
Figure 5. Crystal Structure of Caspase-7 in Complex with Comp-A
(A) Ball and stick model of the crystal structure of Comp-C. Carbon: yellow; nitrogen: blue; sulfur: gold; copper: orange; bromine: dark red; hydrogen: pink. Atom names are labeled. (B) Ribbon representation of the structure of caspase-7 in complex with Comp-A. The two p20 and p10 subunits are shown in different shades of green. Comp-A is shown in stick models with chloride atoms in light blue. (C) Comp-A superimposed with the Fo-Fc difference Fourier density contoured at 3.0 σ. (D) Surface diagram of caspase-7 (shown with carbon atoms in gray, oxygen atoms in red, nitrogen atoms in blue and sulfur atoms in gold) in complex with stick models of Comp-A bound at the dimerization interface. (E) Detailed interaction between caspase-7 and Comp-A. The different caspase-7 subunits are shown in shades of green. Carbon atoms are shown in the same shades of green as the subunits. See also Tables S3.
Figure 6
Figure 6. Conformational Changes and Disordering in the Caspase-7 Structure in Complex with Comp-A
(A) Superposition of the structure in complex with Comp-A (green) with that in complex with DEVD-CHO in the active conformation (magenta, accession code 1F1J). The L1, L3 and L4 loops and the L2 and L2′ regions are labeled in magenta for 1F1J. For caspase-7 in complex with Comp-A, end residues in these loops are labeled in black and with arrows to indicate the breaking points or last residues in them. Relevant secondary structures are also labeled. (B) Superposition of the structure in complex with Comp-A (green) with a procaspase-7 structure (yellow, accession code 1K88). (C) Comp-A would have been in clash with active conformation of caspase-7. Active site Cys186 and caspase-7 residues in direct clash with Comp-A are shown and labeled. (D) Atoms in Comp-A that would have been in clash with caspase-7 are shown within the oval. (E) Previously reported inhibitor DICA (blue, accession code 1SHJ) would have caused similar clash with the active conformation of caspase-7. (F) Superposition of the structure in complex with Comp-A (green) with DICA-bound caspase-7 (blue, accession code 1SHJ). See also Figure S5.
Figure 7
Figure 7. Comp-A Inhibits Effective Dimerization of Caspases in a Noncovalent, Reversible Manner
(A) Mutation of C290, F221, and V292 affect caspase-7 inhibition by Comp-A. Initial reaction rates of wild-type and mutant caspase-7 were measured in the presence of Comp-A at the indicated concentrations. Reaction rates are expressed relative to the DMSO control. Error bars represent the SEM from triplicate experiments. (B) Inhibition of caspase-7 by Comp-A is reversible. 200 nM of caspase-7 were incubated with either DMSO (labeled “DMSO”) or 10 μM Comp-A (labeled “Comp-A”). The samples were dialyzed against buffer ASC. Aliquots were removed at the indicated time-points and caspase-7 activity was measured with or without the addition of 10 μM of exogenous Comp-A (labeled “Comp-A Add-back”). Activity is expressed relative to un-dialyzed Caspase-7. Error bars represent the SEM from triplicate experiments. (C) Comp-A disrupts dimerization of caspase-8. 100 nM of recombinant caspase-8 were incubated with DMSO, 10 μM Comp-A, or 10 μM Ac-VAD-CHO for 15 minutes at 30°C and then subjected to Superdex 200 gel filtration. Collected fractions were subjected to SDS-PAGE stained with Coomassie Blue (middle). Activity in each fraction was measured (bottom plot). The volume (mL) labels on the top and bottom plots indicate the elution volume of the chromatographic run (starting from sample injection). The elution positions of protein mass standards are labeled inside of the top Abs280 plot. See also Figure S6 and Table S4.

Similar articles

Cited by

References

    1. Acehan D, Jiang X, Morgan D, Heuzer J, Wang X, Akey C. Three-Dimensional Structure of the Apoptosome Implications for Assembly, Procaspase-9 Binding, and Activation. Molecular Cell. 2002;9:423–432. - PubMed
    1. Agniswamy J, Fang B, Weber IT. Conformational similarity in the activation of caspase-3 and -7 revealed by the unliganded and inhibited structures of caspase-7. Apoptosis. 2009;14:1135–1144. - PubMed
    1. Antczak C, Shum D, Escobar S, Bassit B, Kim E, Seshan VE, Wu N, Yang G, Ouerfelli O, Li YM, et al. High-throughput identification of inhibitors of human mitochondrial peptide deformylase. J Biomol Screen. 2007;12:521–535. - PMC - PubMed
    1. Baici A. The specific velocity plot. A graphical method for determining inhibition parameters for both linear and hyperbolic enzyme inhibitors. Eur J Biochem. 1981;119:9–14. - PubMed
    1. Boatright KM, Renatus M, Scott FL, Sperandio S, Shin H, Pedersen IM, Ricci JE, Edris WA, Sutherlin DP, Green DR, et al. A unified model for apical caspase activation. Mol Cell. 2003;11:529–541. - PubMed

Publication types

MeSH terms

LinkOut - more resources