High-density lipoprotein cholesterol and particle concentrations, carotid atherosclerosis, and coronary events: MESA (multi-ethnic study of atherosclerosis)
- PMID: 22796256
- PMCID: PMC3411890
- DOI: 10.1016/j.jacc.2012.03.060
High-density lipoprotein cholesterol and particle concentrations, carotid atherosclerosis, and coronary events: MESA (multi-ethnic study of atherosclerosis)
Abstract
Objectives: The purpose of this study was to evaluate independent associations of high-density lipoprotein cholesterol (HDL-C) and particle (HDL-P) concentrations with carotid intima-media thickness (cIMT) and incident coronary heart disease (CHD).
Background: HDL-C is inversely related to CHD, and also to triglycerides, low-density lipoprotein particles (LDL-P), and related metabolic risk. HDL-P associations with CHD may be partially independent of these factors.
Methods: In a multiethnic study of 5,598 men and women ages 45 to 84 years old, without baseline CHD, excluding subjects on lipid-lowering medications, triglycerides >400 mg/dl, or missing values, we evaluated associations of HDL-C and nuclear magnetic resonance spectroscopy-measured HDL-P with cIMT and incident CHD (myocardial infarction, CHD death, and angina, n = 227 events; mean 6.0 years follow-up). All models were adjusted for age, sex, ethnicity, hypertension, and smoking.
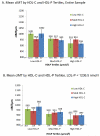
Results: HDL-C and HDL-P correlated with each other (ρ = 0.69) and LDL-P (ρ = -0.38, -0.25, respectively, p < 0.05 for all). For (1 SD) higher HDL-C (15 mg/dl) or HDL-P (6.64 μmol/l), cIMT differences were - 26.1 (95% confidence interval [CI]: -34.7 to -17.4) μm and -30.1 (95% CI: -38.8 to - 21.4) μm, and CHD hazard ratios were 0.74 (95% CI: 0.63 to 0.88) and 0.70 (95% CI: 0.59 to 0.82), respectively. Adjusted for each other and LDL-P, HDL-C was no longer associated with cIMT (2.3; 95% CI: - 9.5 to 14.2 μm) or CHD (0.97; 95% CI: 0.77 to 1.22), but HDL-P remained independently associated with cIMT (-22.2; 95% CI: - 33.8 to -10.6 μm) and CHD (0.75; 95% CI: 0.61 to 0.93). Interactions by sex, ethnicity, diabetes, and high-sensitivity C-reactive protein were not significant.
Conclusions: Adjusting for each other and LDL-P substantially attenuated associations of HDL-C, but not HDL-P, with cIMT and CHD. Potential confounding by related lipids or lipoproteins should be carefully considered when evaluating HDL-related risk.
Copyright © 2012 American College of Cardiology Foundation. Published by Elsevier Inc. All rights reserved.
Figures


Comment in
-
High-density lipoprotein particle number: a better measure to quantify high-density lipoprotein?J Am Coll Cardiol. 2012 Aug 7;60(6):517-20. doi: 10.1016/j.jacc.2012.03.058. Epub 2012 Jul 11. J Am Coll Cardiol. 2012. PMID: 22796252 No abstract available.
References
-
- Frikke-Schmidt R. Genetic variation in the ABCA1 gene, HDL cholesterol, and risk of ischemic heart disease in the general population. Atherosclerosis. 2010;208:305–16. - PubMed
-
- Johannsen TH, Kamstrup PR, Andersen RV, et al. Hepatic lipase, genetically elevated high-density lipoprotein, and risk of ischemic cardiovascular disease. J Clin Endocrinol Metab. 2009;94:1264–73. - PubMed
-
- Barter PJ, Caulfield M, Eriksson M, et al. Effects of torcetrapib in patients at high risk for coronary events. N Engl J Med. 2007;357:2109–22. - PubMed
Publication types
MeSH terms
Substances
Grants and funding
LinkOut - more resources
Full Text Sources
Other Literature Sources
Medical
Molecular Biology Databases
Research Materials

