

Review of the neuroanatomic landscape implicated in glucose sensing and regulation of nutrient signaling: immunophenotypic localization of diabetes gene Tcf7l2 in the developing murine brain
- PMID: 22796301
- PMCID: PMC3455112
- DOI: 10.1016/j.jchemneu.2012.06.002
Review of the neuroanatomic landscape implicated in glucose sensing and regulation of nutrient signaling: immunophenotypic localization of diabetes gene Tcf7l2 in the developing murine brain
Abstract
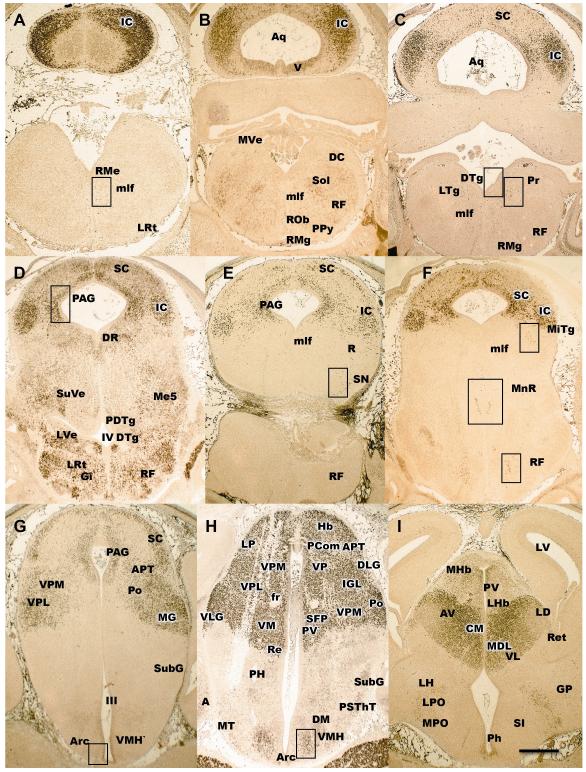
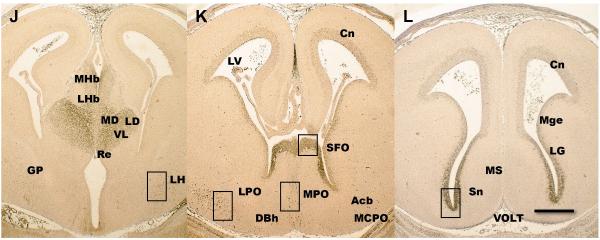
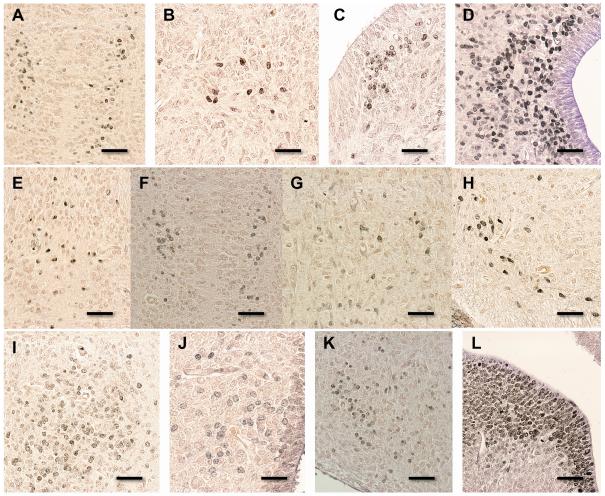
Genetic variants in the transcription factor 7-like 2(Tcf7l2) gene have been found to confer a significant risk of type 2 diabetes and attenuated insulin secretion. Based on its genomic wide association Tcf7l2 is considered the single most important predictor of diabetes to date. Previous studies of Tcf7l2 mRNA localization in the adult brain suggest a putative role of Tcf7l2 in the CNS regulation of energy homeostasis. The present study further characterizes the immunophenotypic distribution of peptide expression in the brains of Tcf7l2 progeny during developmental time periods between E12.5 and P1. Tcf7l2(-/-) is lethal beyond P1. Results show that while negligible TCF7L2 expression is found in the developing brains of Tcf7l2(-/-)mice, TCF7L2 protein is relatively widespread and robustly expressed in the brain by E18.5 and exhibits specific expression within neuronal populations and regions of the brain in Tcf7l2(+/-) and Tcf7l2(+/+) progeny. Strong immunophenotypic labeling was found in the diencephalic structure of the thalamus that suggests a role of Tcf7l2 in the development and maintenance of thalamic activity. Strongly expressed TCF7L2 was localized in select hypothalamic and preoptic nuclei indicative of Tcf7l2 function within neurons controlling energy balance. Definitive neuronal staining for TCF7L2 within nuclei of the brain stem and circumventricular organs extends TCF7L2 localization within autonomic neurons and its potential integration with autonomic function. In addition robust TCF7L2 expression was found in the tectal and tegmental structures of the superior and inferior colliculi as well as transient expression in neuroepithelium of the cerebral and hippocampal cortices of E16 and E18.5. Patterns of TCF7L2 peptide localization when compared to the adult protein synthetic chemical/anatomical landscape of glucose sensing exhibit a good correlational fit between its expression and regions, nuclei, and pathways regulating energy homeostasis via integration and response to peripheral endocrine, metabolic and neuronal signaling. TCF was also found co-localized with peptides that regulate energy homeostasis including AgRP, POMC and NPY. TCF7l2, some variants of which have been shown to impair GLP-1-induced insulin secretion, was also found co-localize with GLP-1 in adult TCF wild type progeny. Impaired Tcf7l2-mediated neural regulation may contribute to the risk and/or underlying pathophysiology of type 2 diabetes that has found high expression in genomic studies of Tcf7l2 variants.
Copyright © 2012 Elsevier B.V. All rights reserved.
Figures
Similar articles
-
The Wnt signaling pathway effector TCF7L2 controls gut and brain proglucagon gene expression and glucose homeostasis.Diabetes. 2013 Mar;62(3):789-800. doi: 10.2337/db12-0365. Epub 2012 Sep 10. Diabetes. 2013. PMID: 22966074 Free PMC article.
-
Alterations in TCF7L2 expression define its role as a key regulator of glucose metabolism.Genome Res. 2011 Sep;21(9):1417-25. doi: 10.1101/gr.123745.111. Epub 2011 Jun 14. Genome Res. 2011. PMID: 21673050 Free PMC article.
-
Postnatal isoform switch and protein localization of LEF1 and TCF7L2 transcription factors in cortical, thalamic, and mesencephalic regions of the adult mouse brain.Brain Struct Funct. 2013 Nov;218(6):1531-49. doi: 10.1007/s00429-012-0474-6. Epub 2012 Nov 15. Brain Struct Funct. 2013. PMID: 23152144 Free PMC article.
-
The Wnt signaling pathway effector TCF7L2 and type 2 diabetes mellitus.Mol Endocrinol. 2008 Nov;22(11):2383-92. doi: 10.1210/me.2008-0135. Epub 2008 Jul 3. Mol Endocrinol. 2008. PMID: 18599616 Review.
-
What Can Diabetes-Associated Genetic Variation in TCF7L2 Teach Us About the Pathogenesis of Type 2 Diabetes?Metab Syndr Relat Disord. 2018 Oct;16(8):383-389. doi: 10.1089/met.2018.0024. Epub 2018 Jul 11. Metab Syndr Relat Disord. 2018. PMID: 29993315 Free PMC article. Review.
Cited by
-
TCF7L2 polymorphisms are associated with amygdalar volume in elderly individuals with Type 2 Diabetes.Sci Rep. 2019 Nov 1;9(1):15818. doi: 10.1038/s41598-019-48899-3. Sci Rep. 2019. PMID: 31676834 Free PMC article.
References
-
- Ahlzen M, Johansson LE, Cervin C, Tornquist H, Groop L, Ridderstrale M. Expression of the transcription factor 7-like 2 gene(Tcf7l2) in human adipocytes is down regulated by insulin. Biochem. Biophys. Res. Commun. 2008;310:49–52. - PubMed
-
- Alvarez E, Martinez MD, Roncerto I, Chowen JA, Garcia-Cuartero B, Gispert JD, Sana C, Vazquez P, Maldonado A, deCaceres J, Desco M, Pozo MA, Blazquez E. The expression of GLP-1 receptor mRNA and protein allows the effect of GLP-1 on glucose metabolism in the human hypothalamus and brainstem. J. Neurochem. 2005;92:798–806. - PubMed
-
- Alvarez-Buylla A, Lim DA. For the long run: maintaining germinal niches in the adult brain. Neuron. 2004;41:683–6. - PubMed
Publication types
MeSH terms
Substances
Grants and funding
LinkOut - more resources
Full Text Sources
Medical
Molecular Biology Databases
Miscellaneous
