. 2012 Sep 1;53(5):1181-91.
doi: 10.1016/j.freeradbiomed.2012.07.002. Epub 2012 Jul 13.

Proline dehydrogenase is essential for proline protection against hydrogen peroxide-induced cell death

Affiliations

Proline dehydrogenase is essential for proline protection against hydrogen peroxide-induced cell death

Sathish Kumar Natarajan et al. Free Radic Biol Med. .

Abstract

Proline metabolism has an underlying role in apoptotic signaling that influences tumorigenesis. Proline is oxidized to glutamate in the mitochondria, with the rate-limiting step catalyzed by proline dehydrogenase (PRODH). PRODH expression is inducible by p53, leading to increased proline oxidation, reactive oxygen species formation, and induction of apoptosis. Paradoxical to its role in apoptosis, proline also protects cells against oxidative stress. Here we explore the mechanism of proline protection against hydrogen peroxide stress in melanoma WM35 cells. Treatment of WM35 cells with proline significantly increased cell viability, diminished oxidative damage of cellular lipids and proteins, and maintained ATP and NADPH levels after exposure to hydrogen peroxide. Inhibition or siRNA-mediated knockdown of PRODH abolished proline protection against oxidative stress, whereas knockdown of Δ(1)-pyrroline-5-carboxylate reductase, a key enzyme in proline biosynthesis, had no impact on proline protection. Potential linkages between proline metabolism and signaling pathways were explored. The combined inhibition of the mammalian target of rapamycin complex 1 (mTORC1) and mTORC2 eliminated proline protection. A significant increase in Akt activation was observed in proline-treated cells after hydrogen peroxide stress along with a corresponding increase in the phosphorylation of the forkhead transcription factor class O3a (FoxO3a). The role of PRODH in proline-mediated protection was validated in the prostate carcinoma cell line PC3. Knockdown of PRODH in PC3 cells attenuated phosphorylated levels of Akt and FoxO3a and decreased cell survival during hydrogen peroxide stress. The results provide evidence that PRODH is essential in proline protection against hydrogen peroxide-mediated cell death and that proline/PRODH helps activate Akt in cancer cells.


Figures

Fig. 1
Fig. 1
Proline metabolic pathway. Proline is oxidized to glutamate by proline dehydrogenase (PRODH) and P5C dehydrogenase (P5CDH) in the mitochondrion. PRODH couples proline oxidation to reduction of CoQ in the electron transport chain. The enzymes P5C synthetase (P5CS) and P5C reductase (PYCR) convert glutamate into proline.
Fig. 2
Fig. 2
Proline protects WM35 cells against oxidative stress. (A) WM35 cells were treated with (black squares) and without (gray diamonds) proline (5 mM) for 1–24 h and then incubated with 0.5 mM H2O2 for 3 h in serum free medium. Percent cell survival was estimated using the MTS cell viability assay. (B) WM35 cells were treated with (proline) and without (control) proline (5 mM) for 12 h and then incubated with and without 0.5 mM H2O2 (3 h) in serum free medium. Cell survival measurements were determined using the Cell Titer-Glo Luminescent assay. (C and D) WM35 cells were treated with (proline) and without (control) proline (5 mM) for 12 h and incubated with and without 0.5 mM H2O2 (3 h) in serum free medium. Oxidative stress markers (C) malondialdehyde and (D) protein carbonyls were then measured as described. Each value represents mean ± SD from five different experiments (*P < 0.05).
Fig. 2
Fig. 2
Proline protects WM35 cells against oxidative stress. (A) WM35 cells were treated with (black squares) and without (gray diamonds) proline (5 mM) for 1–24 h and then incubated with 0.5 mM H2O2 for 3 h in serum free medium. Percent cell survival was estimated using the MTS cell viability assay. (B) WM35 cells were treated with (proline) and without (control) proline (5 mM) for 12 h and then incubated with and without 0.5 mM H2O2 (3 h) in serum free medium. Cell survival measurements were determined using the Cell Titer-Glo Luminescent assay. (C and D) WM35 cells were treated with (proline) and without (control) proline (5 mM) for 12 h and incubated with and without 0.5 mM H2O2 (3 h) in serum free medium. Oxidative stress markers (C) malondialdehyde and (D) protein carbonyls were then measured as described. Each value represents mean ± SD from five different experiments (*P < 0.05).
Fig. 3
Fig. 3
Knockdown of PRODH abolishes proline protection. (A) WM35 cells were treated (12 h) with and without proline (5 mM) in the presence of increasing concentrations of THFA (0.1–5 mM). Cells were then incubated with and without 0.5 mM H2O2 (3 h) in serum free medium. Percent cell survival was estimated using the MTS cell viability assay. Each value represents mean ± SD of separate experiments (n = 5). *P < 0.05 when compared to H2O2 stress without proline, #P < 0.05 when compared to H2O2 stressed cells treated with proline and 0.1 mM THFA. (B) Intracellular proline levels in control cells, THFA (5 mM) treated cells, proline (5 mM) treated cells, and THFA + proline treated cells with and without H2O2 stress (0.5 mM, 3 h). Each value represents mean ± SD of separate experiments (n = 5) (*P < 0.05). (C) Western analysis of PRODH in WM35 cells transfected with control siRNA (siCon, 50 nM) and PRODH siRNA (siPRODH, 50 nM) for 48 h. VDAC is shown as a control. (D) Percent cell survival of control siRNA (siCon) or PRODH siRNA (siPRODH) treated WM35cells with and without H2O2 stress in the absence (control) and presence of proline (5 mM). Percent cell survival was estimated using the MTS cell viability assay. Each value represents mean ± SD of separate experiments (n = 4) (*P < 0.05).
Fig. 3
Fig. 3
Knockdown of PRODH abolishes proline protection. (A) WM35 cells were treated (12 h) with and without proline (5 mM) in the presence of increasing concentrations of THFA (0.1–5 mM). Cells were then incubated with and without 0.5 mM H2O2 (3 h) in serum free medium. Percent cell survival was estimated using the MTS cell viability assay. Each value represents mean ± SD of separate experiments (n = 5). *P < 0.05 when compared to H2O2 stress without proline, #P < 0.05 when compared to H2O2 stressed cells treated with proline and 0.1 mM THFA. (B) Intracellular proline levels in control cells, THFA (5 mM) treated cells, proline (5 mM) treated cells, and THFA + proline treated cells with and without H2O2 stress (0.5 mM, 3 h). Each value represents mean ± SD of separate experiments (n = 5) (*P < 0.05). (C) Western analysis of PRODH in WM35 cells transfected with control siRNA (siCon, 50 nM) and PRODH siRNA (siPRODH, 50 nM) for 48 h. VDAC is shown as a control. (D) Percent cell survival of control siRNA (siCon) or PRODH siRNA (siPRODH) treated WM35cells with and without H2O2 stress in the absence (control) and presence of proline (5 mM). Percent cell survival was estimated using the MTS cell viability assay. Each value represents mean ± SD of separate experiments (n = 4) (*P < 0.05).
Fig. 4
Fig. 4
Knockdown of PYCR. (A) Western blot analysis of PYCR1 in WM35 cells transfected with control siRNA (siCon, 50 nM) and PYCR1 siRNA (siPYCR1, 50 nM) for 48 h. β-actin is shown as a control. (B) Western analysis of PYCR1 and PYCR2 in cells transfected with siCon (50 nM), siPYCR2 alone (50 nM), and siPYCR1 (50 nM) and siPYCR2 (50 nM) combined (siPYCR1/2, 100 nM total). For siPYCR1/2, 100 nM of siCon was used. β-actin is shown as a control. (C). Percent cell survival of siCon, siPYCR1, and siPYCR2 transfected cells with and without H2O2 stress in the absence (control) and presence (proline) of proline (5 mM). (D) Percent cell survival of WM35 cells transfected with siCon and siPYCR1/2 with and without H2O2 stress in the absence (control) and presence of proline (5 mM). Percent cell survival was estimated using the MTS cell viability assay. Each value represents mean ± SD of separate experiments (n = 4) (* P < 0.05).
Fig. 4
Fig. 4
Knockdown of PYCR. (A) Western blot analysis of PYCR1 in WM35 cells transfected with control siRNA (siCon, 50 nM) and PYCR1 siRNA (siPYCR1, 50 nM) for 48 h. β-actin is shown as a control. (B) Western analysis of PYCR1 and PYCR2 in cells transfected with siCon (50 nM), siPYCR2 alone (50 nM), and siPYCR1 (50 nM) and siPYCR2 (50 nM) combined (siPYCR1/2, 100 nM total). For siPYCR1/2, 100 nM of siCon was used. β-actin is shown as a control. (C). Percent cell survival of siCon, siPYCR1, and siPYCR2 transfected cells with and without H2O2 stress in the absence (control) and presence (proline) of proline (5 mM). (D) Percent cell survival of WM35 cells transfected with siCon and siPYCR1/2 with and without H2O2 stress in the absence (control) and presence of proline (5 mM). Percent cell survival was estimated using the MTS cell viability assay. Each value represents mean ± SD of separate experiments (n = 4) (* P < 0.05).
Fig. 5
Fig. 5
(A) ATP levels and (B) NADPH/NADP+ ratio were measured in control and proline treated cells with or without 0.5 mM H2O2 stress (3 h). Each value represents mean ± SD of separate experiments (n = 4) (*P < 0.05).
Fig. 5
Fig. 5
(A) ATP levels and (B) NADPH/NADP+ ratio were measured in control and proline treated cells with or without 0.5 mM H2O2 stress (3 h). Each value represents mean ± SD of separate experiments (n = 4) (*P < 0.05).
Fig. 6
Fig. 6
Inhibition of mTORC1 and mTORC2. (A) Cell survival of WM35 cells incubated with rapamycin (10 nM and 100 nM) and treated with and without H2O2 stress (3 h) in the absence (control) and presence of proline (5 mM). (B) Cell survival rate of WM35 cells incubated with Ku-0063794 and treated with and without H2O2 stress (3 h) in the absence (control) and presence of proline (5 mM). Cells treated with DMSO were used as controls. Percent cell survival was estimated using the MTS cell viability assay. Each value represents mean ± SD of separate experiments (n = 6) (* P<0.05).
Fig. 6
Fig. 6
Inhibition of mTORC1 and mTORC2. (A) Cell survival of WM35 cells incubated with rapamycin (10 nM and 100 nM) and treated with and without H2O2 stress (3 h) in the absence (control) and presence of proline (5 mM). (B) Cell survival rate of WM35 cells incubated with Ku-0063794 and treated with and without H2O2 stress (3 h) in the absence (control) and presence of proline (5 mM). Cells treated with DMSO were used as controls. Percent cell survival was estimated using the MTS cell viability assay. Each value represents mean ± SD of separate experiments (n = 6) (* P<0.05).
Fig. 7
Fig. 7
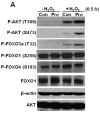
Proline upregulates Akt signaling during H2O2 stress. (A) Western analysis of P-Akt (T308 and S473), P-FoxO3a (T32), P-FoxO1 (S256) and P-FoxO4 (S193) in WM35 cells treated with and without proline (5 mM) for 12 h and incubated with and without 0.5 mM H2O2 (0.5 h) in serum free medium. Controls are FoxO1, β-actin, and Akt. Quantified levels of (B) P-Akt-T308 and (C) P-Akt-S473 relative to total Akt (P-Akt/Akt). (D) Quantified levels of P-FoxO3a-T32 relative to β-actin. Each value represents mean ± SD of separate experiments (n = 4) (*P < 0.05). (E) Same as panel A except cells were incubated with and without 0.5 mM H2O2 for 3 h. (F) Quantified levels of P-Akt-T308 relative to total Akt (P-Akt/Akt). Each value represents mean ± SD of separate experiments (n = 4).
Fig. 7
Fig. 7
Proline upregulates Akt signaling during H2O2 stress. (A) Western analysis of P-Akt (T308 and S473), P-FoxO3a (T32), P-FoxO1 (S256) and P-FoxO4 (S193) in WM35 cells treated with and without proline (5 mM) for 12 h and incubated with and without 0.5 mM H2O2 (0.5 h) in serum free medium. Controls are FoxO1, β-actin, and Akt. Quantified levels of (B) P-Akt-T308 and (C) P-Akt-S473 relative to total Akt (P-Akt/Akt). (D) Quantified levels of P-FoxO3a-T32 relative to β-actin. Each value represents mean ± SD of separate experiments (n = 4) (*P < 0.05). (E) Same as panel A except cells were incubated with and without 0.5 mM H2O2 for 3 h. (F) Quantified levels of P-Akt-T308 relative to total Akt (P-Akt/Akt). Each value represents mean ± SD of separate experiments (n = 4).
Fig. 8
Fig. 8
Proline protection and Akt signaling at lower H2O2 levels. (A) WM35 cells were treated with (proline) and without (control) proline (5 mM) for 12 h and incubated with and without 50 μM H2O2 (3 h) in serum free medium. Percent cell survival was estimated using the MTS cell viability assay. (B) Western analysis of P-Akt (T308 and S473) and P-FoxO3a (T32) in WM35 cells treated with and without proline (5 mM) for 12 h and incubated with and without 50 μM H2O2 (0.5 h) in serum free medium. Controls are β-actin, and Akt. Quantified levels of (C) P- Akt-T308 and (D) P-Akt-S473 relative to total Akt (P-Akt/Akt). (E) Quantified levels of P- FoxO3a-T32 relative to β-actin. Each value represents mean ± SD of separate experiments (n = 4) (*P < 0.05).
Fig. 8
Fig. 8
Proline protection and Akt signaling at lower H2O2 levels. (A) WM35 cells were treated with (proline) and without (control) proline (5 mM) for 12 h and incubated with and without 50 μM H2O2 (3 h) in serum free medium. Percent cell survival was estimated using the MTS cell viability assay. (B) Western analysis of P-Akt (T308 and S473) and P-FoxO3a (T32) in WM35 cells treated with and without proline (5 mM) for 12 h and incubated with and without 50 μM H2O2 (0.5 h) in serum free medium. Controls are β-actin, and Akt. Quantified levels of (C) P- Akt-T308 and (D) P-Akt-S473 relative to total Akt (P-Akt/Akt). (E) Quantified levels of P- FoxO3a-T32 relative to β-actin. Each value represents mean ± SD of separate experiments (n = 4) (*P < 0.05).
Fig. 9
Fig. 9
Knockdown of PRODH and Akt signaling pathway in prostate cancer cells. (A) RWPE-1 cells were treated with and without proline (5 mM) for 12 h and then incubated with 0.5 mM H2O2 for 3 h in serum free medium. Percent cell survival was estimated using the MTS cell viability assay. (B) Survival rates of PC3 cells transfected (48 h) with control siRNA (siCon) and PRODH siRNA (siPRODH) and incubated with different concentrations of H2O2 (0–10 mM) for 3 h. (C) Western blot analysis of PRODH in PC3 cells transfected with siCon (50 nM) and siPRODH (50 nM) for 48 h. VDAC is shown as a control. (D) Western blot analysis of P-Akt (T308 and S473), P-FoxO3a (T32), and β-actin in PC3 cells transfected with siCon and siPRODH (48 h). (E) Quantification of P-Akt-T308 and P-Akt-S473 relative to total AKT (P-Akt/Akt) and P- FoxO3a-T32 relative to β-actin. Each value represents mean ± SD of separate experiments (n = 4) (* P < 0.05).
Fig. 9
Fig. 9
Knockdown of PRODH and Akt signaling pathway in prostate cancer cells. (A) RWPE-1 cells were treated with and without proline (5 mM) for 12 h and then incubated with 0.5 mM H2O2 for 3 h in serum free medium. Percent cell survival was estimated using the MTS cell viability assay. (B) Survival rates of PC3 cells transfected (48 h) with control siRNA (siCon) and PRODH siRNA (siPRODH) and incubated with different concentrations of H2O2 (0–10 mM) for 3 h. (C) Western blot analysis of PRODH in PC3 cells transfected with siCon (50 nM) and siPRODH (50 nM) for 48 h. VDAC is shown as a control. (D) Western blot analysis of P-Akt (T308 and S473), P-FoxO3a (T32), and β-actin in PC3 cells transfected with siCon and siPRODH (48 h). (E) Quantification of P-Akt-T308 and P-Akt-S473 relative to total AKT (P-Akt/Akt) and P- FoxO3a-T32 relative to β-actin. Each value represents mean ± SD of separate experiments (n = 4) (* P < 0.05).
Fig. 10
Fig. 10
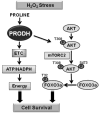
Model of proline protection against oxidative stress induced cell death. Proline oxidation in the mitochondrion is coupled to reduction of the electron transport chain (ETC) by PRODH. PRODH activity helps support oxidative phosphorylation and ATP formation and prevents decreases in NADPH/NADP+ which sustains cells during oxidative stress. Through an unknown mechanism, proline/PRODH further activates Akt during H2O2 stress which leads to inhibition of FoxO3a and blocks cell death. Activation of Akt by proline and PRODH may involve mTORC2 or other factors not yet identified.

Similar articles

Cited by

References

    1. Blake RL, Hall JG, Russell ES. Mitochondrial proline dehydrogenase deficiency in hyperprolinemic PRO/Re mice: genetic and enzymatic analyses. Biochem Genet. 1976;14:739–57. - PubMed
    1. Phang JM, Pandhare J, Liu Y. The metabolism of proline as microenvironmental stress substrate. J Nutr. 2008;138:2008S–2015S. - PMC - PubMed
    1. Szabados L, Savoure A. Proline: a multifunctional amino acid. Trends Plant Sci. 2010;15:89–97. - PubMed
    1. Wu G, Bazer FW, Burghardt RC, Johnson GA, Kim SW, Knabe DA, Li P, Li X, McKnight JR, Satterfield MC, Spencer TE. Proline and hydroxyproline metabolism: implications for animal and human nutrition. Amino Acids. 2011;40:1053–63. - PMC - PubMed
    1. Pandhare J, Donald SP, Cooper SK, Phang JM. Regulation and function of proline oxidase under nutrient stress. J Cell Biochem. 2009;107:759–68. - PMC - PubMed

Publication types

MeSH terms