

The contribution of age structure to cell population responses to targeted therapeutics
- PMID: 22796330
- PMCID: PMC3592383
- DOI: 10.1016/j.jtbi.2012.07.001
The contribution of age structure to cell population responses to targeted therapeutics
Abstract
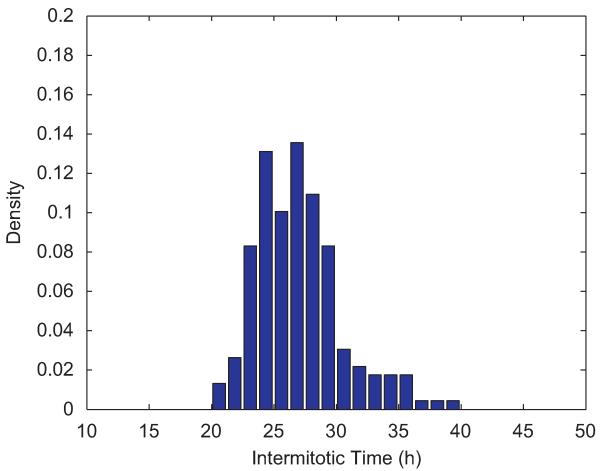
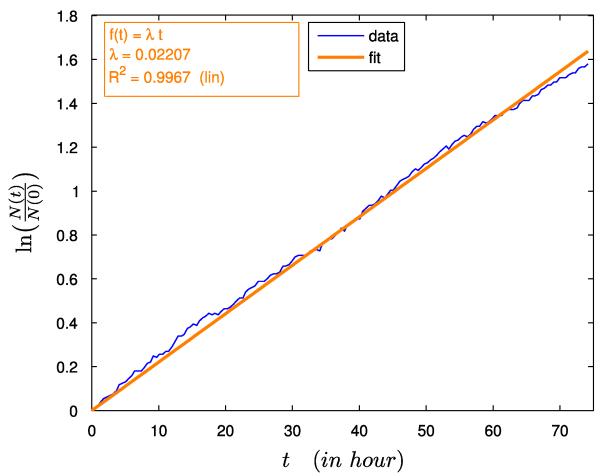
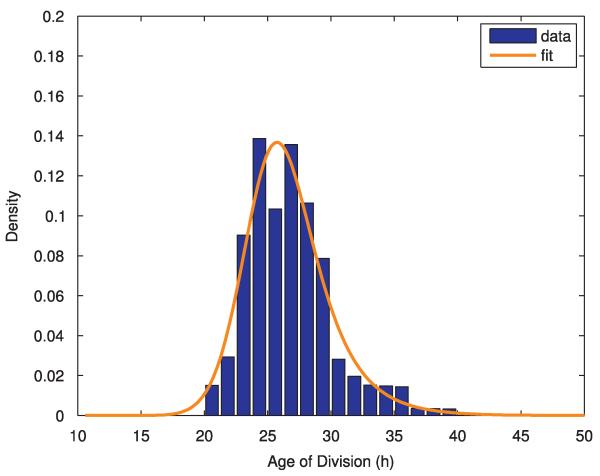
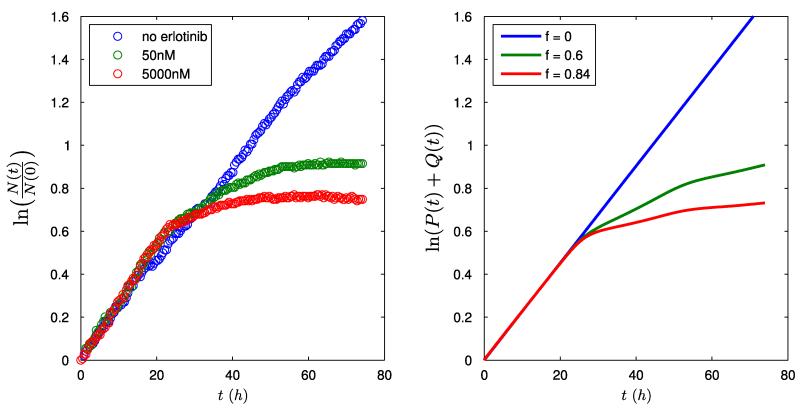
Cells grown in culture act as a model system for analyzing the effects of anticancer compounds, which may affect cell behavior in a cell cycle position-dependent manner. Cell synchronization techniques have been generally employed to minimize the variation in cell cycle position. However, synchronization techniques are cumbersome and imprecise and the agents used to synchronize the cells potentially have other unknown effects on the cells. An alternative approach is to determine the age structure in the population and account for the cell cycle positional effects post hoc. Here we provide a formalism to use quantifiable lifespans from live cell microscopy experiments to parameterize an age-structured model of cell population response.
Copyright © 2012 Elsevier Ltd. All rights reserved.
Figures

Similar articles
-
Stilbene Compounds Inhibit Tumor Growth by the Induction of Cellular Senescence and the Inhibition of Telomerase Activity.Int J Mol Sci. 2019 Jun 2;20(11):2716. doi: 10.3390/ijms20112716. Int J Mol Sci. 2019. PMID: 31159515 Free PMC article. Review.
-
Cancer cell senescence: a new frontier in drug development.Drug Discov Today. 2012 Mar;17(5-6):269-76. doi: 10.1016/j.drudis.2012.01.019. Epub 2012 Jan 31. Drug Discov Today. 2012. PMID: 22314100 Review.
-
Tumor senescence as a determinant of drug response in vivo.Drug Resist Updat. 2002 Oct;5(5):204-8. doi: 10.1016/s1368764602001103. Drug Resist Updat. 2002. PMID: 12450785 Review.
-
Targeting Cancer Metabolism and Cell Cycle by Plant-Derived Compounds.Adv Exp Med Biol. 2020;1247:125-134. doi: 10.1007/5584_2019_449. Adv Exp Med Biol. 2020. PMID: 31749136 Review.
-
Too big not to fail: emerging evidence for size-induced senescence.FEBS J. 2024 Jun;291(11):2291-2305. doi: 10.1111/febs.16983. Epub 2023 Nov 20. FEBS J. 2024. PMID: 37986656 Review.
Cited by
-
Structured models of cell migration incorporating molecular binding processes.J Math Biol. 2017 Dec;75(6-7):1517-1561. doi: 10.1007/s00285-017-1120-y. Epub 2017 Apr 12. J Math Biol. 2017. PMID: 28405746
-
Evolution of cancer stem cell lineage involving feedback regulation.PLoS One. 2021 May 20;16(5):e0251481. doi: 10.1371/journal.pone.0251481. eCollection 2021. PLoS One. 2021. PMID: 34014979 Free PMC article.
-
A framework for macroscopic phase-resetting curves for generalised spiking neural networks.PLoS Comput Biol. 2022 Aug 1;18(8):e1010363. doi: 10.1371/journal.pcbi.1010363. eCollection 2022 Aug. PLoS Comput Biol. 2022. PMID: 35913991 Free PMC article.
-
Stochastic multi-scale models of competition within heterogeneous cellular populations: Simulation methods and mean-field analysis.J Theor Biol. 2016 Oct 21;407:161-183. doi: 10.1016/j.jtbi.2016.07.028. Epub 2016 Jul 22. J Theor Biol. 2016. PMID: 27457092 Free PMC article.
-
Characterising the Behaviour of a Structured PDE Model of the Cell Cycle in Contrast to a Corresponding ODE System.Bull Math Biol. 2025 Jun 8;87(7):93. doi: 10.1007/s11538-025-01472-8. Bull Math Biol. 2025. PMID: 40484899 Free PMC article.
References
-
- Ackleh AS. Parameter identification in size-structured population models with nonlinear individual rates. Math. Comp. Modelling. 1999;30(9-10):81–92.
-
- Ackleh AS, Ito K. An implicit finite difference scheme for the nonlinear size-structured population model. Numer. Funct. Anal. Optim. 1997;18(9-10):865–884.
-
- Ainseba B, Benosman C. CML dynamics: optimal control of age-structured stem cell population. Math. Comput. Simul. 2011;81(10):1962–1977.
-
- Ainseba B, Picart D, Thiéry D. An innovative multistage, physiologically structured, population model to understand the European grapevine moth dynamics. J. Math. Anal. Appl. 2011;382(1):34–46.
-
- Alarcón T, Byrne H, Maini P. A cellular automaton model for tumour growth in inhomogeneous environment. J. Theor. Biol. 2003;225(2):257–274. - PubMed
Publication types
MeSH terms
Substances
Grants and funding
LinkOut - more resources
Full Text Sources
