. 2012 Nov 1;318(18):2269-83.
doi: 10.1016/j.yexcr.2012.07.002. Epub 2012 Jul 13.

Desmoglein 3 acting as an upstream regulator of Rho GTPases, Rac-1/Cdc42 in the regulation of actin organisation and dynamics

Affiliations

Desmoglein 3 acting as an upstream regulator of Rho GTPases, Rac-1/Cdc42 in the regulation of actin organisation and dynamics

Siu Man Tsang et al. Exp Cell Res. .

Abstract

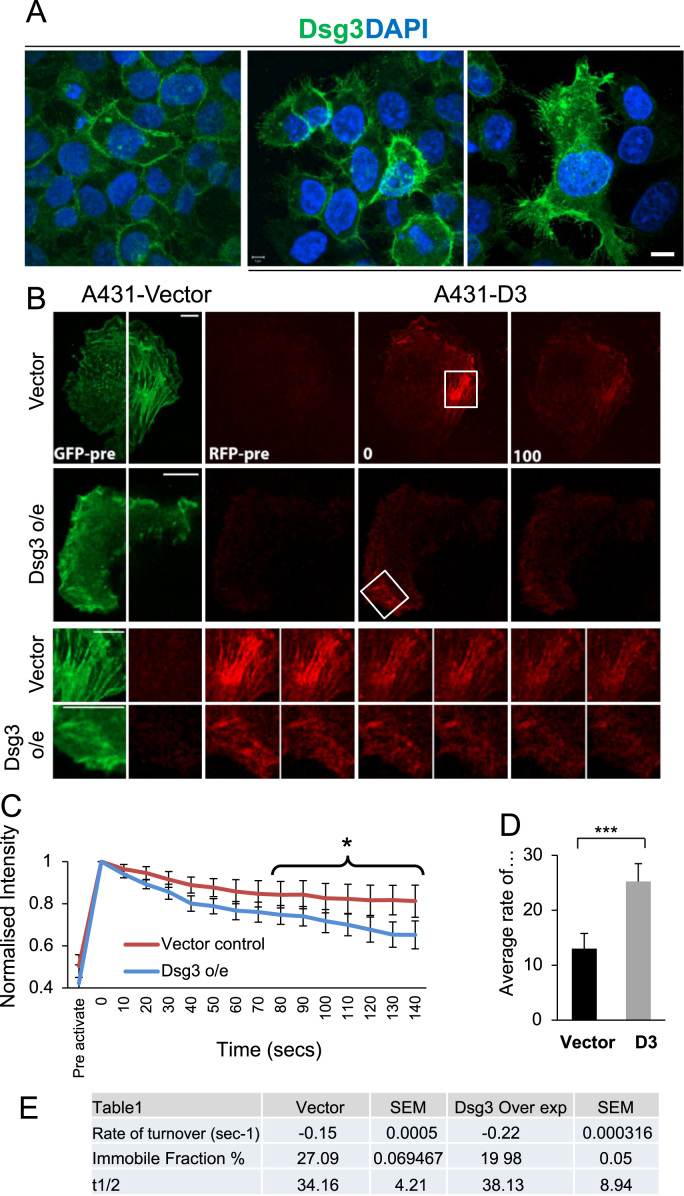
Desmoglein 3 (Dsg3), a member of the desmoglein sub-family, serves as an adhesion molecule in desmosomes. Our previous study showed that overexpression of human Dsg3 in several epithelial lines induces formation of membrane protrusions, a phenotype suggestive of Rho GTPase activation. Here we examined the interaction between Dsg3 and actin in detail and showed that endogenous Dsg3 colocalises and interacts with actin, particularly the junctional actin in a Rac1-dependent manner. Ablation of Rac1 activity by dominant negative Rac1 mutant (N17Rac1) or the Rac1 specific inhibitor (NSC23766) directly disrupts the interaction between Dsg3 and actin. Assembly of the junctional actin at the cell borders is accompanied with enhanced levels of Dsg3, while inhibition of Dsg3 by RNAi results in profound changes in the organisation of actin cytoskeleton. In accordance, overexpression of Dsg3 results in a remarkable increase of Rac1 and Cdc42 activities and to a lesser extent, RhoA. The enhancements in Rho GTPases are accompanied by the pronounced actin-based membrane structures such as lamellipodia and filopodia, enhanced rate of actin turnover and cell polarisation. Together, our results reveal an important novel function for Dsg3 in promoting actin dynamics through regulating Rac1 and Cdc42 activation in epithelial cells.


Figures

None
Graphical abstract
Fig. 1
Fig. 1
Colocalisation of Dsg3 and F-actin at the plasma membrane in normal human keratinocytes. (A) Calcium (2 mM) induced junction formation for 4 h or 8 h in HaCaT cells followed by flourescent staining with mouse anti-Dsg3 antibody (red) and A488 conjugated phalloidin (green). Arrows indicate the colocalisation of Dsg3 with F-actin, especially the junctional actin at the plasma membrane. (B,C) The profiles of the peripheral fluorescent intensities of Dsg3 and F-actin along the marked dotted lines in cells B (red) and C (yellow) showed a general trend of overlapping of two proteins. (D) HaCaT cells transiently transfected with either scrambled (Scram) or two different Dsg3 specific siRNAs (RNAi-1 and -2) at the concentration of 50 nM, for 48 h prior to calcium switch for 5 h followed by fluorescent staining for Dsg3 or desmoplakin (Dp, a negative control) combined with F-actin. An efficient inhibition of the Dsg3 expression was seen in both Dsg3 knockdown cells. Marked reduction of overall actin staining including both junctional actin (arrows) and cortical actin bundles (arrowheads) were observed in RNAi treated cells compared to scrambled control. Quantitation of the peripheral fluorescence intensity is shown in bar chart (mean±SEM from at least four arbitrary images in each group, **p<0.01, ***p<0.001). (E) Western blots of HaCaTs without or with Dsg3 knockdown for the indicated proteins. Scale bars, 10 μm. (For interpretation of the references to colour in this figure legend, the reader is referred to the web version of this article.)
Fig. 2
Fig. 2
Association of Dsg3 with actin. (A) Co-immunoprecipiation of lysates of HaCaT cells and human breast skin pulled down with Dsg3 antibody. Actin was found to be co-purified with Dsg3 in both HaCaTs and human breast skin sample in addition to E-cadherin. The blots on the left were controls for co-IP pull-down with either mouse pre-immune IgG or anti-Dsg3 and blotted for myc tag. Only sample with Dsg3.myc expression displayed a positive band of Dsg3. (B) The soluble and insoluble fractions of HaCaT cells were subjected to sequential extractions using 1% Triton X-100 and RIPA buffer (1% NP-40), respectively, prior to co-IP pulled down with mouse anti-Dsg3 antibody. Actin was shown to be co-purified with Dsg3 only in the Triton soluble fraction. (C,D) Colocalisation analysis of Dsg3 and actin staining in A431 cells of vector control (V) or with overexpression of Dsg3 (D3). The pixels with the colocalisation were highlighted in white (with ImageJ) and significantly enhanced colocalisation was seen in D3 cells (mean±SEM from three arbitrary images in each group, ***p<0.001). Scale bars, 20 μm.
Fig. 3
Fig. 3
Dsg3 is required for peripheral cortical actin assembly and cell polarisation in A431 and HaCaT cells. (A,B) The representative confocal image stack of A431-D3 cells treated with scrambled or Dsg3 siRNA. Note that, comparing with the small colony with the same number of four cells in control, cells with Dsg3 knockdown appeared more flattening and showed severe disruption of E-cadherin junction formation and a marked collapse of the cell edges (arrows). Quantitation analysis in (B) showed that the enhanced cell height in A431-D3 cells (compared to vector control cells) was greatly reduced by Dsg3 knockdown (*p<0.05). Cell height was measured from five confocal Z-stacks in each group. (C,D) HaCaT cells treated with Dsg3 RNAi showed a lack of cell polarisation and apparent cell flattening with reduced cell height (*p<0.05). Sufficient knockdown was achieved in RNAi treated cells (red) with concomitantly significantly reduced intensity of F-actin staining at cell–cell junctions. Arrow in control cells (C) indicates where cells tended to stratify but this was lacking in RNAi-treated cells. The xz image panels underneath of each image are the vertical protein distribution and the shape of nuclei in RNAi-treated cells indicates the cell flattening compared to that in control. Data shown in bar charts were mean±SEM. Scale bars, 10 μm. (E,F) Western blots of the indicated proteins in Triton soluble and insoluble fractions of A431 and HaCaTs with either overexpression or suppression of Dsg3 along with the matched control, respectively. Fold changes normalised against control sample in the corresponding fractions were shown underneath of each blot. The reduced expression of both E-cadherin and p120 was seen in Dsg3 overexpressing cells, and to a lesser degree for E-cadherin in its insoluble pool and p120 in both fractions in Dsg3 knockdown cells. (For interpretation of the references to colour in this figure legend, the reader is referred to the web version of this article.)
Fig. 4
Fig. 4
Dsg3 is required for cell polarisation and cortical actin assembly in MDCK. (A) Confocal images of Dsg3/ZO-1 or F-actin/ZO-1 double staining in MDCK cells treated with scrambled (Scram) or Dsg3 specific siRNA. Cells were permeabilised in 0.1% Triton buffer only for 1 min before fluorescent staining. The enlarged boxed areas in the panels of Dsg3/ZO-1 staining are displayed underneath. Note that Dsg3 staining appeared linear continuous, just like that of ZO-1, and both proteins were largely colocalised at the junctions. Remarkable disruption of ZO-1 was seen in cells with Dsg3 knockdown and the remaining fragmented Dsg3 was still strongly colocalised with ZO-1. The ZY sections for F-actin/ZO-1 below showed a polarised distribution of both proteins in control cells but lost in RNAi treated cells. Large intercellular gaps with concomitant loss of cortical actin bundles were indicated by arrow in RNAi treated cells. (B) Beewarm plot of Dsg3 and ZO-1 fluorescence intensity. One hundred and seventy five control cells and 130 RNAi-treated cells were analysed. Significant reduction of ZO-1 was strongly correlated with Dsg3 depletion (***p<0.001). (C) Confocal images of triple staining of Dsg3/F-actin/pMLC in scrambled control and RNAi treated cells. Again, strong correlation of three proteins at the cell borders was seen in control cells (arrowheads) but lost in RNAi treated cells (arrows). Bar chart underneath is the quantitation of the peripheral fluorescence intensities of Dsg3, F-actin and pMLC in control and RNAi treated cells (n>9, mean±SEM, **p<0.01, ***p<0.001). Scale bars, 10 μm.
Fig. 5
Fig. 5
Dsg3 enhances membrane protrusions and actin dynamics in A431 cells. (A) Confocal images of A431-V (vector) and -D3 immunostained with anti-Dsg3 antibody (green) and nucleus counterstained with DAPI. (B) Confocal time-lapse series of A431 cells transfected with Eos-FP Actin. Images were acquired using 488 and 543 nm laser lines showing both the GFP and RFP species of actin. Images were acquired for 3 min, seconds after photo-conversion. Time-lapse frame rate was 1 image every 10 s. Boxes show the region of interest (ROI) photoconverted. (C) Graph showing quantification of actin dynamics in A431-V and -C7 cells following photoconversion of Eos-FP Actin from GFP to RFP over time from a representative cell. The intensity profiles for each ROI were normalised and the mean percentage recovery was measured. The time points with statistical difference were marked (*p<0.05). (D) Graph showing quantification of the rate of actin turnover following photoconversion of a small region of Eos-FP actin. Data are pooled from 20 regions of interest from 4 independent experiments (***P<0.001 using Students t-test). (E) Summary of the quantiation data. Scale bars, 5 μm. (For interpretation of the references to colour in this figure legend, the reader is referred to the web version of this article.)
Fig. 6
Fig. 6
Overexpression of Dsg3 in A431 cells significantly enhances the activity of Rac1 and Cdc42. (A) Glutathione–sepharose beads complexed with GST-Pak-PBD or GST-Rhotekin-PBD fusion proteins were used to pull down the active GTP-bound Rac1 and Cdc42 or RhoA from lysates of A431-V and -D3 cells. Bead-bound complexes were loaded onto a 4–12% gradient gel and the amount of activated GTPases was determined by Western blotting with antibodies against Rac1, Cdc42 and RhoA. The negative control of GST pull down is displayed on the left. Significantly enhanced activity of Rac1 and Cdc42 but to a small extent, RhoA was detected in Dsg3 overexpressing cells. No evident changes were seen for total GTPases. Note that increased Dsg3 proteins were co-purified with the GTP-bound GTPases in D3 compared to V cells in both pull down assays. (B) Phase contrast images of A431-V and -D3 cells showing enhanced membrane projections and ruffling in D3 compared to V cells. Bar, 20 mm. (C) Graph showing ruffling velocity of A431-V and -C7 cells, treated in the absence or presence of the Rac1 inhibitor, NSC23766 at the concentration of 30 μM. Velocity measurements were obtained from kymograph analysis of the cell membrane. Overexpression of Dsg3 was shown to enhanced membrane ruffling and this could be blocked completely by Rac1 inhibitor. Data are collected from 24 regions of interest from 8 cells (pooled from 3 independent experiments, ***p<0.001). (D) Graph showing velocity of cell migration in A431-V and -D3 cells treated in the absence or presence of Rac1 inhibitor. Time-lapse series of 18 h duration were acquired at 5 min intervals however data are shown from the first 3 h of migration due to cell death in A431-D3 cells treated with NSC23766 inhibitor. Data are pooled from three independent experiments (n=80, ***p<0.001).
Fig. 7
Fig. 7
A crucial role of the Rac1 activation in Dsg3 and actin interaction. (A) Co-immunprecipitation pull down with anti-actin antibody in lysates of HaCaT cells pretreated with either the Rac1 dominant negative mutant (N17Rac1) or the Rac1 specific inhibitor (NSC23766, 30–50 μM) and Western blotting for Dsg3. Cells without any treatment were used as a control. The input of total cell lysates was shown underneath. Quantification of band densitometry from three independent experiments was shown in (B). Reduced interaction of Dsg3 and actin was observed in cells treated with both N17Rac1 and NSC23766, the latter of which exhibited inhibition in a dose-dependent manner. (C) Colocalisation analysis of Dsg3 and actin (highlighted in white) in A431-C11 (with low Dsg3 levels) and -C7 (with highest Dsg3 levels) cloned cells treated with either N17Rac1 or the Rac1 specific inhibitor, NSC23766 (30 μM). Five-seven images of confluent areas in each sample were acquired and the colocalisation was measured in ImageJ. A significant reduction of the colocalisation was particularly seen in C7 cells treated with NSC23766 (mean±SEM, ***p<0.001) and to a lesser extent in cells treated with the dominant negative mutant, N17Rac1. The Dsg3 Western blot in C11 and C7 cells was shown in (E). Scale bar, 50 μm.
Video S1
Video S1
– Time lapse video of A431-V cells plated in the uncoated culture dish for 3 h before live cell imaging. Image series of 100 frames with 1.5 h duration at 1 minute interval were acquired and fast played at 120 times. doi:10.1016/j.yexcr.2012.07.002.
Video S2
Video S2
– Time lapse video of A431-C7 cloned cells plated in the uncoated culture dish for 3 h before live cell imaging. Image series of 100 frames with 1.5 h duration at 1 min interval were acquired and fast played at 120 times. doi:10.1016/j.yexcr.2012.07.002.

Similar articles

Cited by

References

    1. Fuchs E. Scratching the surface of skin development. Nature. 2007;445:834–842. - PMC - PubMed
    1. Rudini N., Dejana E. Adherens junctions. Curr. Biol. 2008;18:R1080–R1082. - PubMed
    1. Etienne-Manneville S. Control of polarized cell morphology and motility by adherens junctions. Semin. Cell Dev. Biol. 2011;22:850–857. - PubMed
    1. Amagai M., Klaus-Kovtun V., Stanley J.R. Autoantibodies against a novel epithelial cadherin in pemphigus vulgaris, a disease of cell adhesion. Cell. 1991;67:869–877. - PubMed
    1. Amagai M., Ahmed A.R., Kitajima Y., Bystryn J.C., Milner Y., Gniadecki R., Hertl M., Pincelli C., Kurzen H., Fridkis-Hareli M., Aoyama Y., Frusic-Zlotkin M., Muller E., David M., Mimouni D., Vind-Kezunovic D., Michel B., Mahoney M., Grando S. Are desmoglein autoantibodies essential for the immunopathogenesis of pemphigus vulgaris, or just witnesses of disease? Exp. Dermatol. 2006;15:815–831. - PubMed

Publication types

MeSH terms