

β-Adrenergic receptor mediated increases in activation and function of natural killer cells following repeated social disruption
- PMID: 22796551
- PMCID: PMC3468689
- DOI: 10.1016/j.bbi.2012.07.002
β-Adrenergic receptor mediated increases in activation and function of natural killer cells following repeated social disruption
Abstract
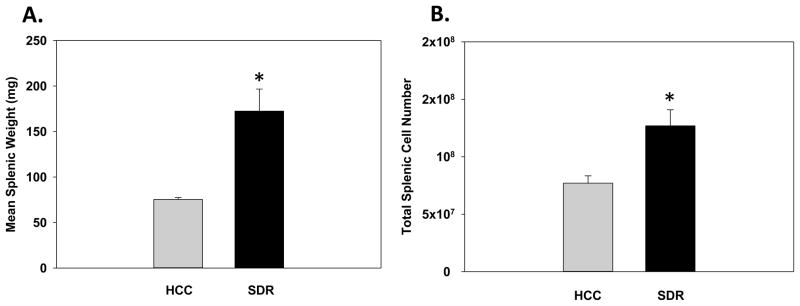
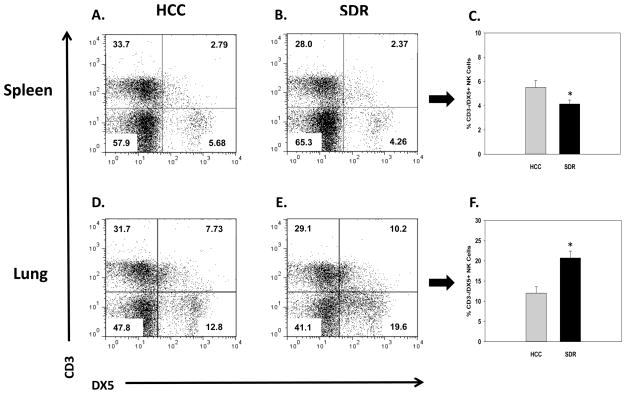
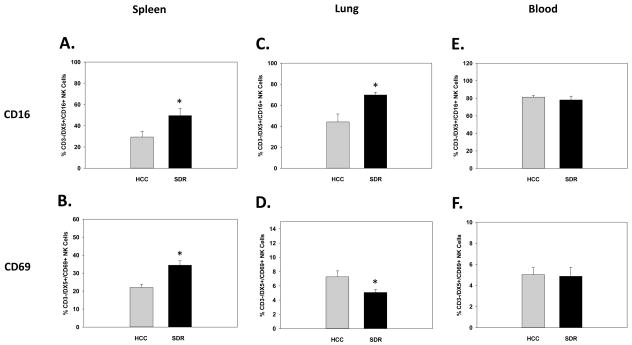
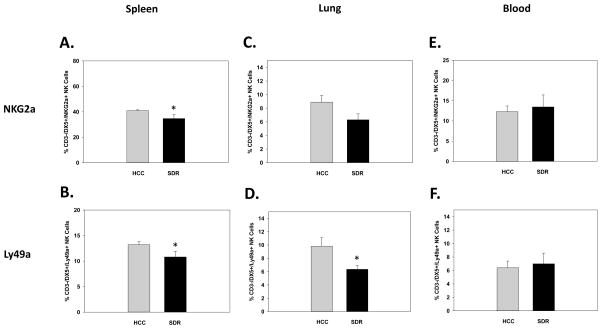
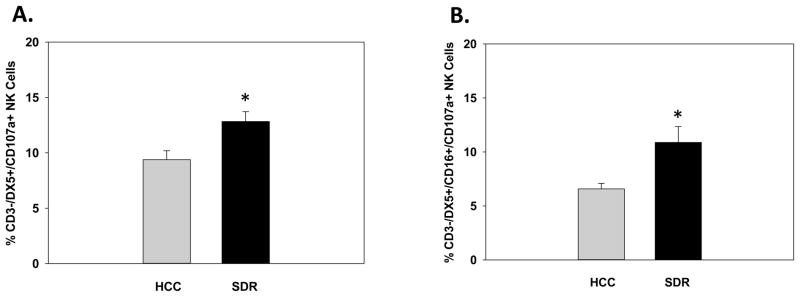
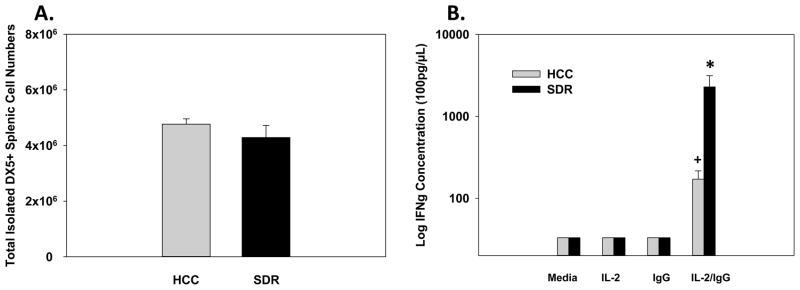
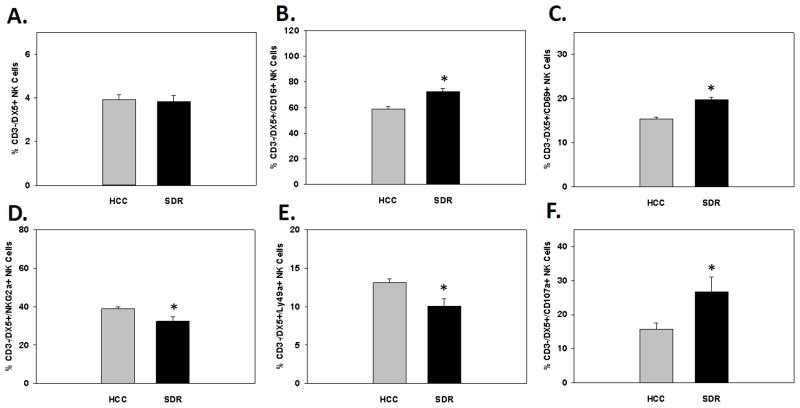
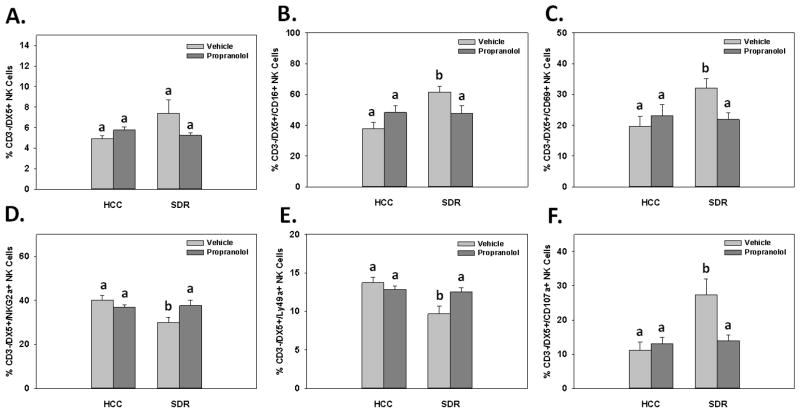
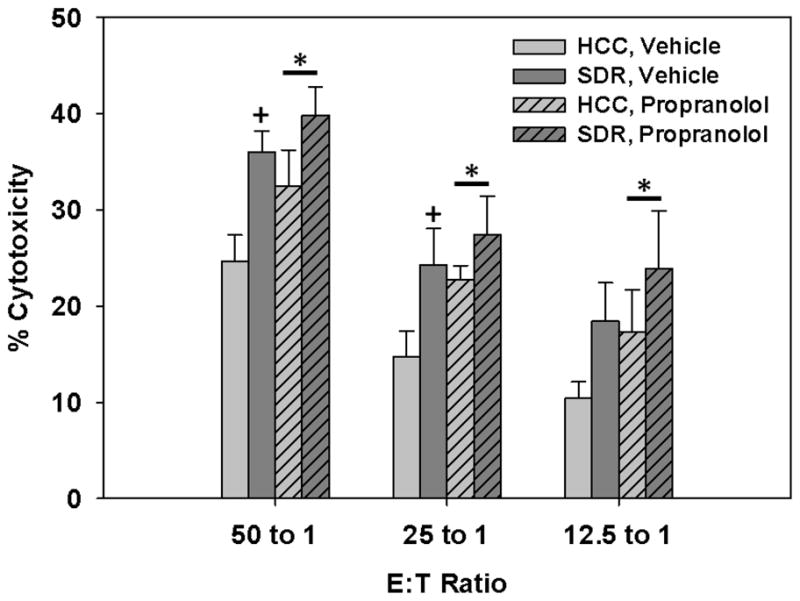
Natural killer (NK) cells are specialized innate lymphocytes important in the early defense against tumor and virus bearing cells. Many factors influence the immune system's effectiveness against pathogens, including stress. Social disruption (SDR) "primes" macrophages/monocytes and dendritic cells thereby enhancing their anti-microbial function. What remains unclear is whether similar responses are evident in NK cells. Current studies investigated the cellular distribution and activation/inhibitory phenotypes of NK cells in the spleen, lung, and blood of C57BL/6 male mice following SDR. Furthermore, cytolytic activity and anti-viral cytokine production of splenic NK cells were determined. Lastly, β-adrenergic receptor (β-AR) signaling was investigated to determine possible mechanisms behind the SDR-induced NK cell alterations. Results indicated NK cells from SDR mice have increased expression of CD16 and CD69 and reduced NKG2a and Ly49a expression on splenic CD3-/DX5+ NK cells indicative of an activated phenotype, both immediately and 14h post-SDR. Administration of propranolol (10mg/kg; non-selective β-adrenergic receptor antagonist) was shown to block these "priming" effects at the 14h time-point. In the lung, SDR had similar effects on activation and inhibitory receptors 14h post-SDR, however no alterations were evident in the blood besides increased NK cells directly after SDR. Additionally, splenic NK cells from SDR mice had increased CD107a surface expression, cytolytic activity, and IFN-γ production was increased upon costimulation with IgG and IL-2 ex vivo. Collectively, these data suggest that social stress "primes" NK cells in the spleen and lung to be more proficient in their cytolytic and anti-viral/tumor effecter functions through β-adrenergic receptor dependent signaling.
Copyright © 2012 Elsevier Inc. All rights reserved.
Conflict of interest statement
Conflict of Interest Statement: All authors declare that there are no conflicts of interest.
Figures
Comment in
-
Can we really know if a stressor increases or decreases natural killer cell activity?Brain Behav Immun. 2012 Nov;26(8):1224-5. doi: 10.1016/j.bbi.2012.08.004. Epub 2012 Aug 10. Brain Behav Immun. 2012. PMID: 22890132 No abstract available.
Similar articles
-
Beta adrenergic blockade decreases the immunomodulatory effects of social disruption stress.Brain Behav Immun. 2012 Oct;26(7):1150-9. doi: 10.1016/j.bbi.2012.07.011. Epub 2012 Jul 24. Brain Behav Immun. 2012. PMID: 22841997 Free PMC article.
-
Sleep-deprivation reduces NK cell number and function mediated by β-adrenergic signalling.Psychoneuroendocrinology. 2015 Jul;57:134-43. doi: 10.1016/j.psyneuen.2015.04.006. Epub 2015 Apr 14. Psychoneuroendocrinology. 2015. PMID: 25929826
-
Tumor-induced suppression of interferon-gamma production and enhancement of interleukin-10 production by natural killer (NK) cells: paralleled to CD4+ T cells.Mol Immunol. 2005 May;42(9):1023-31. doi: 10.1016/j.molimm.2004.09.035. Epub 2004 Nov 23. Mol Immunol. 2005. PMID: 15829292
-
Surface molecules involved in the activation and regulation of T or natural killer lymphocytes in humans.Immunol Rev. 1989 Oct;111:145-75. doi: 10.1111/j.1600-065x.1989.tb00545.x. Immunol Rev. 1989. PMID: 2697680 Review.
-
Natural Killer Cells in the Lungs.Front Immunol. 2019 Jun 25;10:1416. doi: 10.3389/fimmu.2019.01416. eCollection 2019. Front Immunol. 2019. PMID: 31293580 Free PMC article. Review.
Cited by
-
Regulation of natural killer cell activity by glucocorticoids, serotonin, dopamine, and epinephrine.Cell Mol Immunol. 2020 Jul;17(7):705-711. doi: 10.1038/s41423-020-0477-9. Epub 2020 Jun 5. Cell Mol Immunol. 2020. PMID: 32503998 Free PMC article. Review.
-
Adrenergic regulation of innate immunity: a review.Front Pharmacol. 2015 Aug 13;6:171. doi: 10.3389/fphar.2015.00171. eCollection 2015. Front Pharmacol. 2015. PMID: 26321956 Free PMC article. Review.
-
Monocyte trafficking to the brain with stress and inflammation: a novel axis of immune-to-brain communication that influences mood and behavior.Front Neurosci. 2015 Jan 21;8:447. doi: 10.3389/fnins.2014.00447. eCollection 2014. Front Neurosci. 2015. PMID: 25653581 Free PMC article. Review.
-
In vivo suppression of NK cell cytotoxicity by stress and surgery: glucocorticoids have a minor role compared to catecholamines and prostaglandins.Brain Behav Immun. 2014 Mar;37:207-19. doi: 10.1016/j.bbi.2013.12.007. Epub 2013 Dec 12. Brain Behav Immun. 2014. PMID: 24333572 Free PMC article.
-
Neuroendocrine regulation of inflammation.Semin Immunol. 2014 Oct;26(5):357-68. doi: 10.1016/j.smim.2014.01.003. Epub 2014 Jan 31. Semin Immunol. 2014. PMID: 24486056 Free PMC article. Review.
References
-
- Alter G, Malenfant JM, Altfeld M. CD107a as a functional marker for the identification of natural killer cell activity. J Immunol Methods. 2004;294:15–22. - PubMed
-
- Andoniou CE, van Dommelen SL, Voigt V, Andrews DM, Brizard G, sselin-Paturel C, Delale T, Stacey KJ, Trinchieri G, gli-Esposti MA. Interaction between conventional dendritic cells and natural killer cells is integral to the activation of effective antiviral immunity. Nat Immunol. 2005;6:1011–1019. - PubMed
-
- Avitsur R, Kavelaars A, Heijnen C, Sheridan JF. Social stress and the regulation of tumor necrosis factor-alpha secretion. Brain Behav Immun. 2005;19:311–317. - PubMed
-
- Avitsur R, Padgett DA, Dhabhar FS, Stark JL, Kramer KA, Engler H, Sheridan JF. Expression of glucocorticoid resistance following social stress requires a second signal. J Leukoc Biol. 2003;74:507–513. - PubMed
-
- Avitsur R, Stark JL, Dhabhar FS, Sheridan JF. Social stress alters splenocyte phenotype and function. J Neuroimmunol. 2002;132:66–71. - PubMed
Publication types
MeSH terms
Substances
Grants and funding
LinkOut - more resources
Full Text Sources
Research Materials
Miscellaneous
