. 2012 Aug 1;31(15):3282-96.
doi: 10.1038/emboj.2012.189. Epub 2012 Jul 13.

BiP-mediated closing of the Sec61 channel limits Ca2+ leakage from the ER

Affiliations

BiP-mediated closing of the Sec61 channel limits Ca2+ leakage from the ER

Nico Schäuble et al. EMBO J. .

Erratum in

  • EMBO J. 2012 Sep 12;31(18):3784

Abstract

In mammalian cells, signal peptide-dependent protein transport into the endoplasmic reticulum (ER) is mediated by a dynamic protein-conducting channel, the Sec61 complex. Previous work has characterized the Sec61 channel as a potential ER Ca(2+) leak channel and identified calmodulin as limiting Ca(2+) leakage in a Ca(2+)-dependent manner by binding to an IQ motif in the cytosolic aminoterminus of Sec61α. Here, we manipulated the concentration of the ER lumenal chaperone BiP in cells in different ways and used live cell Ca(2+) imaging to monitor the effects of reduced levels of BiP on ER Ca(2+) leakage. Regardless of how the BiP concentration was lowered, the absence of available BiP led to increased Ca(2+) leakage via the Sec61 complex. When we replaced wild-type Sec61α with mutant Sec61αY344H in the same model cell, however, Ca(2+) leakage from the ER increased and was no longer affected by manipulation of the BiP concentration. Thus, BiP limits ER Ca(2+) leakage through the Sec61 complex by binding to the ER lumenal loop 7 of Sec61α in the vicinity of tyrosine 344.


Conflict of interest statement

The authors declare that they have no conflict of interest.

Figures

Figure 1
Figure 1
Effect of BIP gene silencing on cell proliferation. HeLa cells were cultured in DMEM-medium in 6-cm culture dishes and transfected with BIP siRNA, BIP-UTR siRNA, or control siRNA at a final concentration of 35 nM as indicated. (A, B) Silencing was evaluated by western blot analysis using anti-BiP antibody with anti-β-actin antibody as a control as described in Materials and methods. Growth rates were determined by using the Countess Automated Cell Counter. The number of control siRNA-treated cells at 96 h was considered to be 100%. Average values are given, and error bars represent standard errors of the mean (n=3). (C, D) Cell growth in the presence of the different siRNAs was also evaluated using CFSE staining in combination with automated cell sorting (FACS). M1 through M5 represent the number of cell divisions that occurred between 0 and 96 h of cultivation (from right to left); M6 represents unlabelled cells. Similar results were obtained for BIP-UTR siRNA-treated cells (data not shown). M refers to the respective area of control cells.
Figure 2
Figure 2
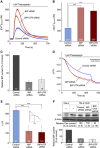
Effect of BIP gene silencing on Ca2+ leakage from the ER. (A) HeLa cells were treated with the indicated siRNAs for 48 h and loaded with the calcium indicator Fura-2 AM as described in Materials and methods. Then live cell Ca2+ imaging was carried out. Ca2+ release was unmasked by applying thapsigargin in the presence of external EGTA. Average values are given, and error bars represent standard errors of the mean (s.e.m.). (B) Statistical analysis of the changes in the cytosolic Ca2+ concentration after the addition of thapsigargin in the experiments presented in (A). Error bars represent s.e.m. P-values <0.001 were defined as significant by unpaired t-tests and are indicated with three asterisks (***). The numbers of cells that were analysed are indicated. (C) Silencing was evaluated by western blots. (D) HeLa-CES2 cells, stably expressing an ER resident carboxylesterase, were transfected with the indicated siRNAs and loaded with Fluo5N AM. Then live cell Ca2+ imaging was carried out. Ca2+ release was initiated by applying thapsigargin and by the addition of ionomycin in the absence of external Ca2+. Average values of relative fluorescence decrease are given. (E) Statistical analysis of the changes in the ER lumenal Ca2+ concentration after the addition of thapsigargin in the experiments presented in (D) as indicated by the insert; error bars represent s.e.m. (F) Western blotting evaluated BIP silencing and confirmed that BIP silencing did not lead to significant changes in ER resident carboxylesterase within the time of the experiments. Figure source data can be found with the Supplementary data.
Figure 3
Figure 3
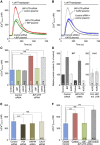
Effect of BIP and KAR2 expression on Ca2+ leakage from the ER. HeLa cells were treated with the indicated siRNAs and plasmids for about 48 h and loaded with the calcium indicator Fura-2 AM as described in Materials and methods. Then live cell Ca2+ imaging was carried out. (A, B) Ca2+ release was unmasked by applying thapsigargin in the absence of external Ca2+. Average values are given, and error bars represent standard errors of the mean (s.e.m.). (C) Statistical analysis of the changes in the cytosolic Ca2+ concentration after the addition of thapsigargin in the experiments presented in (A, B). Error bars represent s.e.m. P-values <0.001 were defined as significant by unpaired t-tests and are indicated with three asterisks (***), NS, not significant. The numbers of cells that were analysed are indicated. (D) Silencing and expression were evaluated by western blots. The KAR2 expression was evaluated by using purified Kar2p (Weitzmann et al, 2007) as a standard (data not shown) and is given as compared with the BiP content. (E) In analogy to BIP, the PDI-, GRP94, and CALR-genes were silenced and the effect on Ca2+ leakage from the ER was analysed as described in the legend to Figure 2A. *P<0.05. (F) Instead of BIP, mutant BIPR197E was expressed in the presence of BIP-UTR siRNA and its effect on Ca2+ leakage from the ER was analysed as described in (A).
Figure 4
Figure 4
Effect of combined BIP and SEC61A1 silencing on Ca2+ leakage from the ER. HeLa cells were treated with the indicated siRNAs for 48 h and loaded with the calcium indicator Fura-2 AM as described in Materials and methods. Then live cell Ca2+ imaging was carried out. (A) Ca2+ release was unmasked by applying thapsigargin in the absence of external Ca2+. Average values are given, and error bars represent standard errors of the mean (s.e.m.). (B) Statistical analysis of the changes in the cytosolic Ca2+ concentration after the addition of thapsigargin in the experiments presented in (A). Error bars represent s.e.m. P-values <0.001 were defined as significant by unpaired t-tests and are indicated with three asterisks (***). The numbers of cells that were analysed are indicated. (C) Silencing was evaluated by western blots. (D) Growth rates were determined as described in the legend to Figure 1A (n=3).
Figure 5
Figure 5
Effect of ER stress inducers on Ca2+ leakage from the ER. HeLa cells were loaded with the calcium indicator Fura-2 AM as described in Materials and methods. Then live cell Ca2+ imaging was carried out. (A, B) As indicated with arrow, the cells were treated with the indicated concentrations of stress inducers for 3 min, and Ca2+ release was unmasked by applying thapsigargin in the absence of external Ca2+. Average values are given, and error bars represent standard errors of the mean (s.e.m.). (C) Statistical analysis of the changes in the cytosolic Ca2+ concentration after the addition of thapsigargin in the experiments presented in (A, B). Error bars represent s.e.m. P-values<0.001 were defined as significant by unpaired t-tests and are indicated with three asterisks (***). The numbers of cells that were analysed are indicated. Tm, tunicamycin. (D) After treatment of HeLa cells with tunicamycin (Tm; 10 μg/ml) or buffer for 3 or 60 min, semi-permeabilized cells were prepared as described in Materials and methods. The indicated precursor polypeptides were synthesized in the presence of the cellular ER or buffer as a negative control. Translation reactions were followed by SDS–PAGE and phosphorimaging. Only the areas of interest from single gels are shown. The efficiencies of modification by oligosaccharyl transferase are given as glycosylated protein in per cent of precursor plus mature protein (n was 3 and 4, respectively). Figure source data can be found with the Supplementary data.
Figure 6
Figure 6
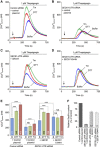
Effect of ER stress inducers and BIP silencing on Ca2+ leakage from the ER. HeLa cells were treated with the indicated siRNAs for 48 h and loaded with the calcium indicator Fura-2 AM as described in Materials and methods. Then live cell Ca2+ imaging was carried out. (A, B) As indicated with arrow, the cells were treated with folding antagonists for 3 min (1 mM and 10 μg/ml, respectively), and Ca2+ release was unmasked by applying thapsigargin in the absence of external Ca2+. Average values are given, and error bars represent standard errors of the mean (s.e.m.). (C) Statistical analysis of the changes in the cytosolic Ca2+ concentration after the addition of thapsigargin in the experiments presented in (A, B). Error bars represent s.e.m. P-values <0.001 were defined as significant by unpaired t-tests and are indicated with three asterisks (***), NS, not significant. The numbers of cells that were analysed are indicated. (D) Silencing was evaluated by western blots. B, buffer; Tm, tunicamycin. Figure source data can be found with the Supplementary data.
Figure 7
Figure 7
Effect of ER stress inducers and SEC61A1Y344H expression on Ca2+ leakage from the ER. HeLa cells were treated with the indicated siRNAs and plasmids for 48 or 96 h and loaded with the calcium indicator Fura-2 AM as described in Materials and methods. Then live cell Ca2+ imaging was carried out. (AD) As indicated with arrow, the cells were treated with folding antagonists for 3 min, and Ca2+ release was unmasked by applying thapsigargin in the absence of external Ca2+. Average values are given, and error bars represent standard errors of the mean (s.e.m.). (E) Statistical analysis of the changes in the cytosolic Ca2+ concentration after the addition of thapsigargin in the experiments presented in (AD). Error bars represent s.e.m. P-values <0.001 were defined as significant by unpaired t-tests and are indicated with three asterisks (***), NS, not significant. The numbers of cells that were analysed are indicated. (F) Silencing and expression were evaluated by western blots. B, buffer, Tm, tunicamycin.
Figure 8
Figure 8
The absence of BiP and the presence of Sec61αY344H affect protein transport into the ER in a precursor-specific manner. (A) Two hours before preparation of semi-permeabilized cells, HeLa cells were treated with SubAB or SubAA272B at final concentrations of 1 μg/ml. (B) HeLa cells were treated with SEC61A1-UTR siRNA or control siRNA for 96 h; 48 h before preparation of semi-permeabilized cells, the cells were transfected with the indicated SEC61A1- or control plasmids. The indicated precursor polypeptides were imported into the cellular ER under co- or post-translational (ppcecA, Sec61β) transport conditions or incubated in the presence of buffer as a negative control. Transport reactions were either followed by sequestration analysis and/or by SDS–PAGE and phosphorimaging. Only the areas of interest from single gels are shown. The efficiencies of modification by signal peptidase or oligosaccharyl transferase are indicated for the shown gel and are given as mature protein in per cent of precursor plus mature protein. PrP precursor was efficiently ubiquitinated, the characteristic ladder of mono-, di-, or triple-ubiqutinated PrP was observed (indicated by asterisk). g, glycosylated polypeptide, p, precursor, PK, proteinase K. Figure source data can be found with the Supplementary data.
Figure 9
Figure 9
BiP binds at or near the minihelix in loop 7 of Sec61α1. (A) 16 Peptides scanning loop 7 of human Sec61α1 as defined by Van den Berg et al (2004) were synthesized on cellulose membranes via carboxy-terminal attachment as described (Hilpert et al, 2007; Erdmann et al, 2011). The peptides consisted of 15 amino-acid residues with an overlap of 13 residues with adjacent peptides and were incubated with similar amounts of 14C-labelled BiP, NBD, and BiP that was saturated with heptapeptide FYQLALT in binding buffer (30 mM Tris–HCl pH 7.5, 170 mM NaCl, 100 mM KCl, 2 mM MgCl2, 100 nM BSA, 5% sucrose, 0.05% Tween20). After washing the membranes three times with binding buffer and drying, the bound proteins were visualized by phosphorimaging. Every second peptide is indicated according to the amino-acid sequence of human Sec61α1. (B) Wild-type and mutant peptide 339–353 were synthesized with biotinylated dipeptide KG at the carboxy-terminus and immobilized in the measuring cell of Biacore avidin sensor chip SA. BiP and Kar2p binding were analysed at analyte concentrations between 0.5 and 10 μM in comparison to peptide 325–339 in the reference cell. The running buffer was 10 mM HEPES/KOH pH 7.4, 150 mM NaCl, 6.4 mM KCl, 2 mM MgCl2, 0.005% Surfactant P2. The analyses at 4 μM analyte are shown. (C) Peptide 338–353 was synthesized with or without the Y344H substitution and BiP binding was analysed in comparison to the corresponding wild-type peptide as described in (A). Where indicated, ADP or ATP was present at a final concentration of 2 mM. Spot number 3 remained underivatized and served as background. The mean values for bound BiP (arbitrary units) are given with s.e.m. (n=6). (D) Loop 7 is shown in single letter code and with the calculated BiP-binding scores of the respective heptapeptide (kcal/mol). The amino-acid residues were numbered according to Van den Berg et al (2004). See text for details. The following structural data were used for peptide docking (PDB ID): 1YUW, 2V7Y, 2KHO, 1DKZ, 1DKY:B, 1DKX, 3DPQ:A, 3DPQ:B, 3DPQ:E, 3DPQ:F, 3DPP:A, 3DPP:B, 3DPO:A, 3DPO:B.
Figure 10
Figure 10
Model for the mechanisms of BiP- and CaM-mediated gating of the human Sec61 complex. (A, B) Homology model for the human heterotrimeric Sec61 complex. Views from the plane of the membrane (A, lateral gate front) and the cytosol (B) are shown. Transmembrane helices (TM) forming the front of the lateral gate and the plug, respectively, are indicated in colour (based on Figure 3 in Zimmermann et al, 2011). We note that the ribosome interacts with cytosolic loops 6 and 8 and that these loops directly connect to transmembrane helices 7 and 8, that are part of the lateral gate and flank loop 7. (C) Dynamic equilibrium and effectors of the Sec61 complex (based on Figure 2 in Gumbart and Schulten, 2007). Our data suggest that BiP binds to ER lumenal loop 7 that directly connects to transmembrane helix 7. Thus, by providing binding energy ribosome and BiP may be able to ‘pull’ on transmembrane helix 7 from opposite ends in order to facilitate channel opening for the nascent polypeptide chain.

References

    1. Alder NN, Shen Y, Brodsky JL, Hendershot LM, Johnson AE (2005) The molecular mechanisms underlying BiP-mediated gating of the Sec61 translocon of the endoplasmic reticulum. J Cell Biol 168: 389–399 - PMC - PubMed
    1. Awad W, Estrada I, Shen Y, Hendershot LM (2008) BiP mutants that are unable to interact with endoplasmic reticulum DnaJ proteins provide insight into interdomain interactions of BiP. Proc Natl Acad Sci USA 105: 1164–1169 - PMC - PubMed
    1. Becker T, Bhushan S, Jarasch A, Armache JP, Funedad S, Jossinet F, Gumbart J, Mielke T, Berninghausen O, Schulten K, Westhof E, Gilmore R, Mandon ES, Beckmann R (2009) Structure of monomeric yeast and mammalian Sec61 complexes interacting with the translating ribosome. Science 326: 1369–1373 - PMC - PubMed
    1. Berridge MJ (2002) The endoplasmic reticulum: a multifunctional signalling organelle. Cell Calcium 32: 235–249 - PubMed
    1. Blobel G, Dobberstein B (1975) Transfer of proteins across membranes. I. Presence of proteolytically processed and unprocessed nascent immunoglobulin light chains on membrane-bound ribosomes of murine myeloma. J Cell Biol 67: 835–851 - PMC - PubMed

Publication types

MeSH terms