. 2012 Sep;23(9):1486-95.
doi: 10.1681/ASN.2012010040. Epub 2012 Jul 12.

IL-17A production by renal γδ T cells promotes kidney injury in crescentic GN

Affiliations

IL-17A production by renal γδ T cells promotes kidney injury in crescentic GN

Jan-Eric Turner et al. J Am Soc Nephrol. 2012 Sep.

Abstract

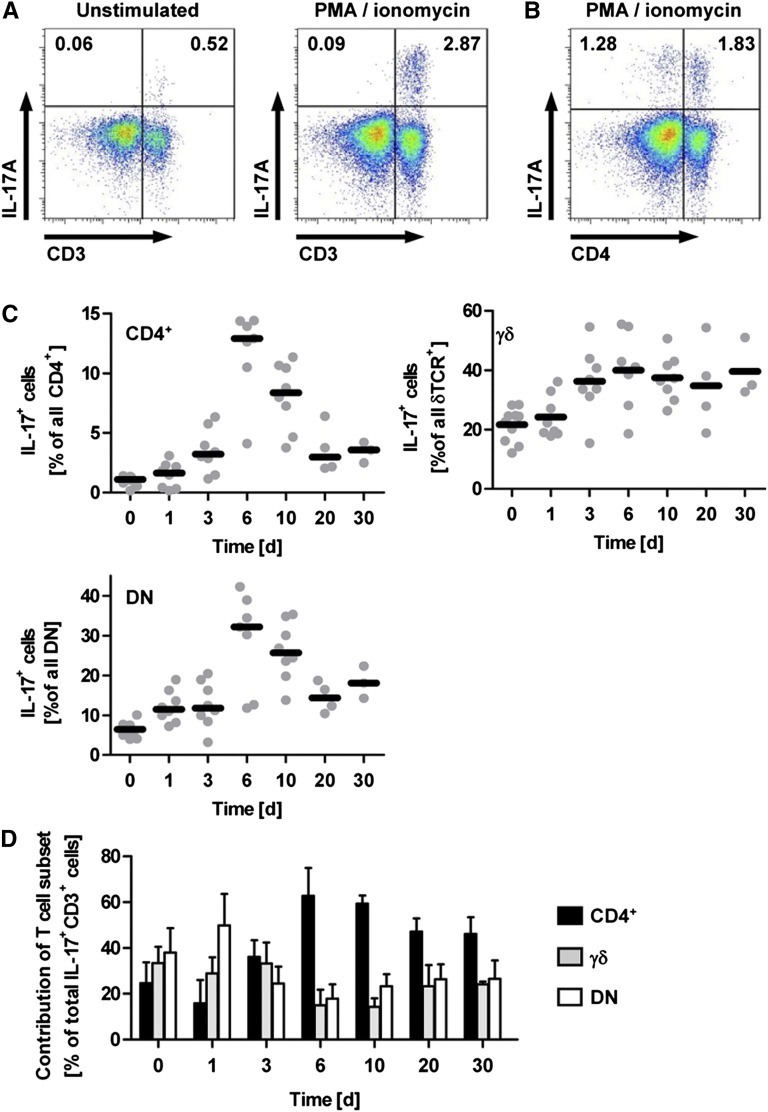
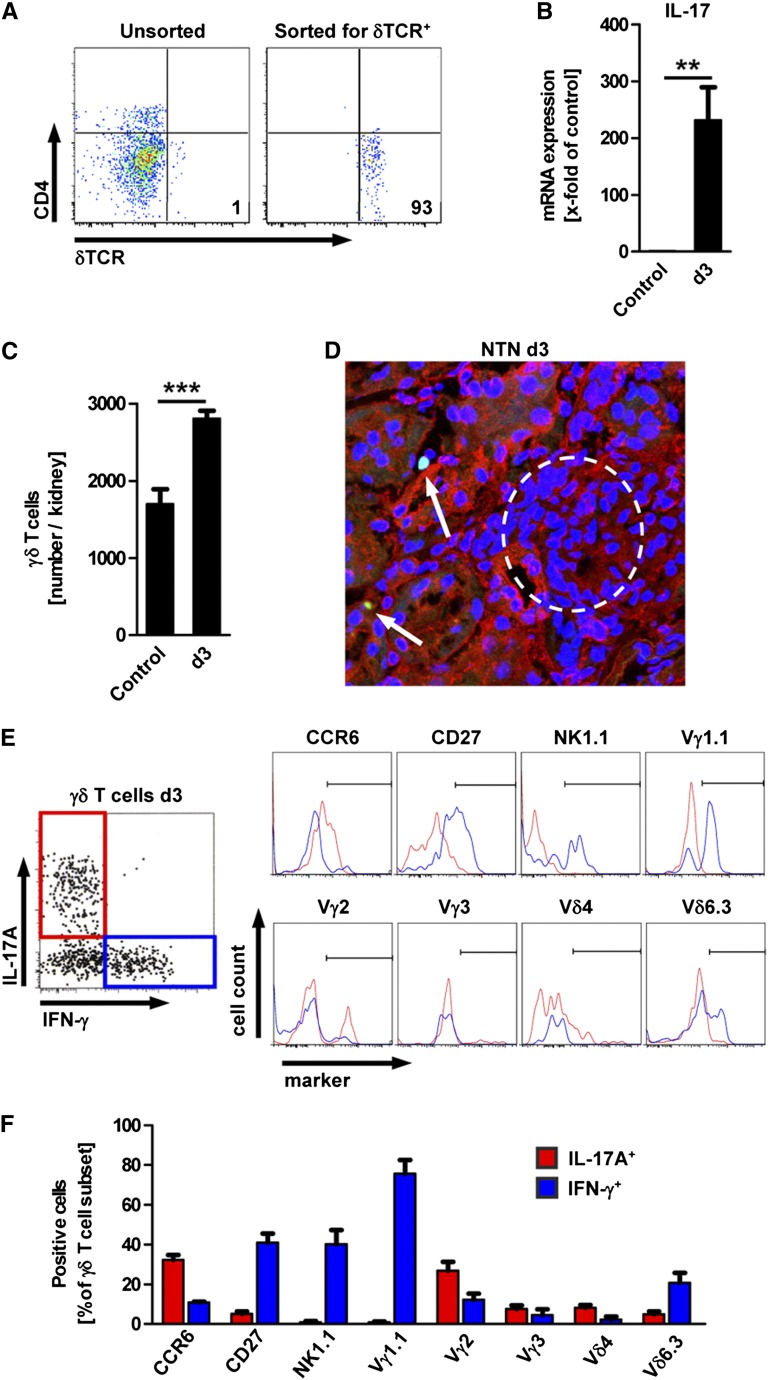
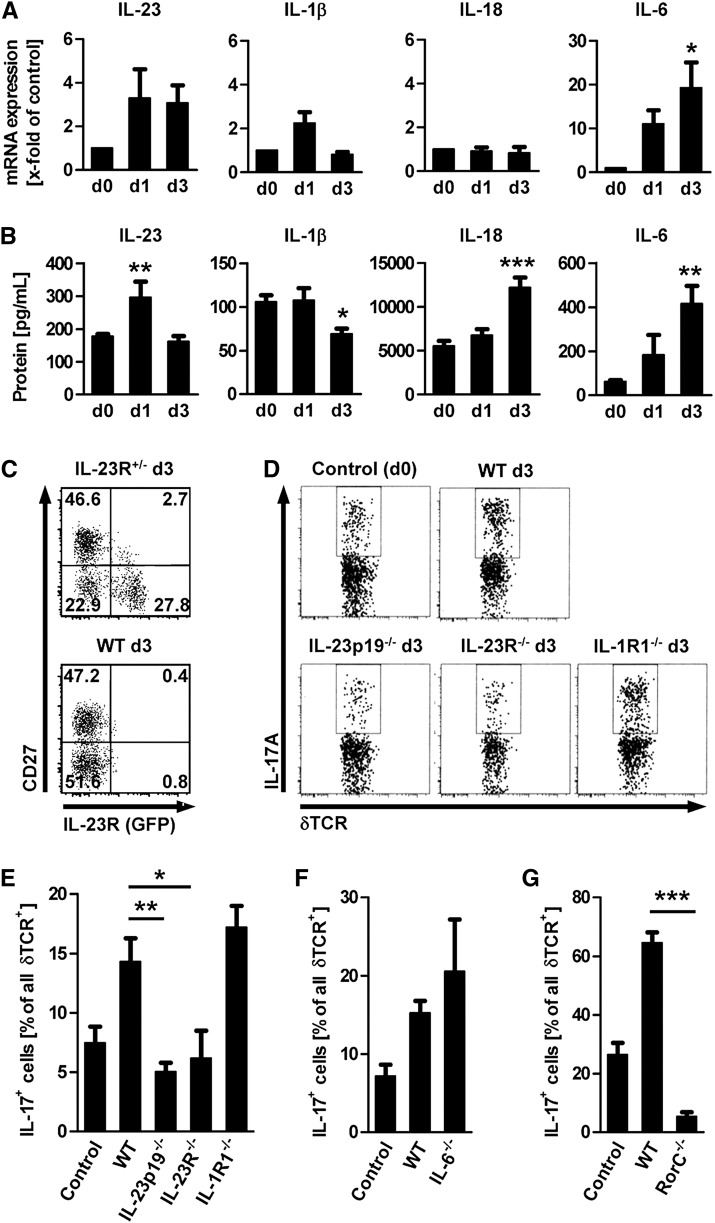
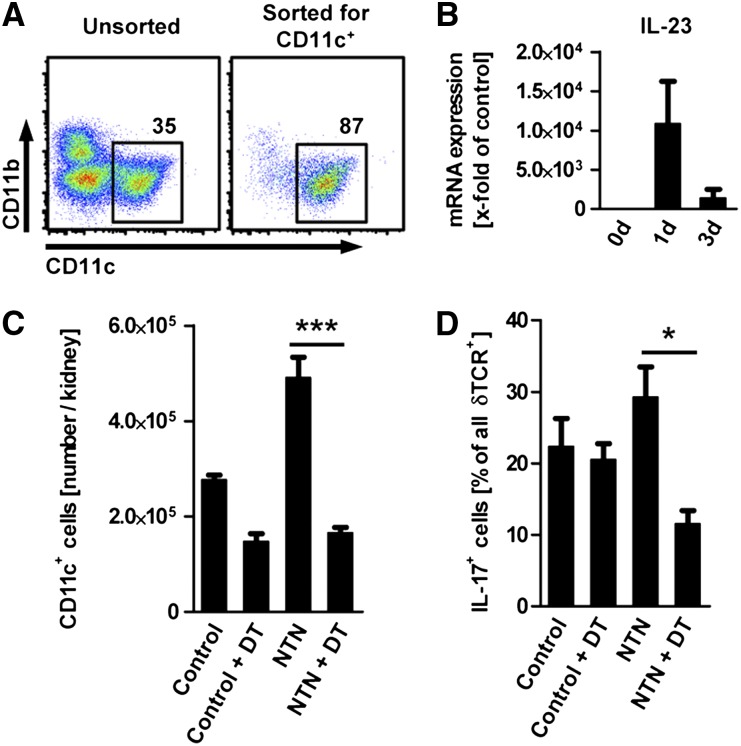
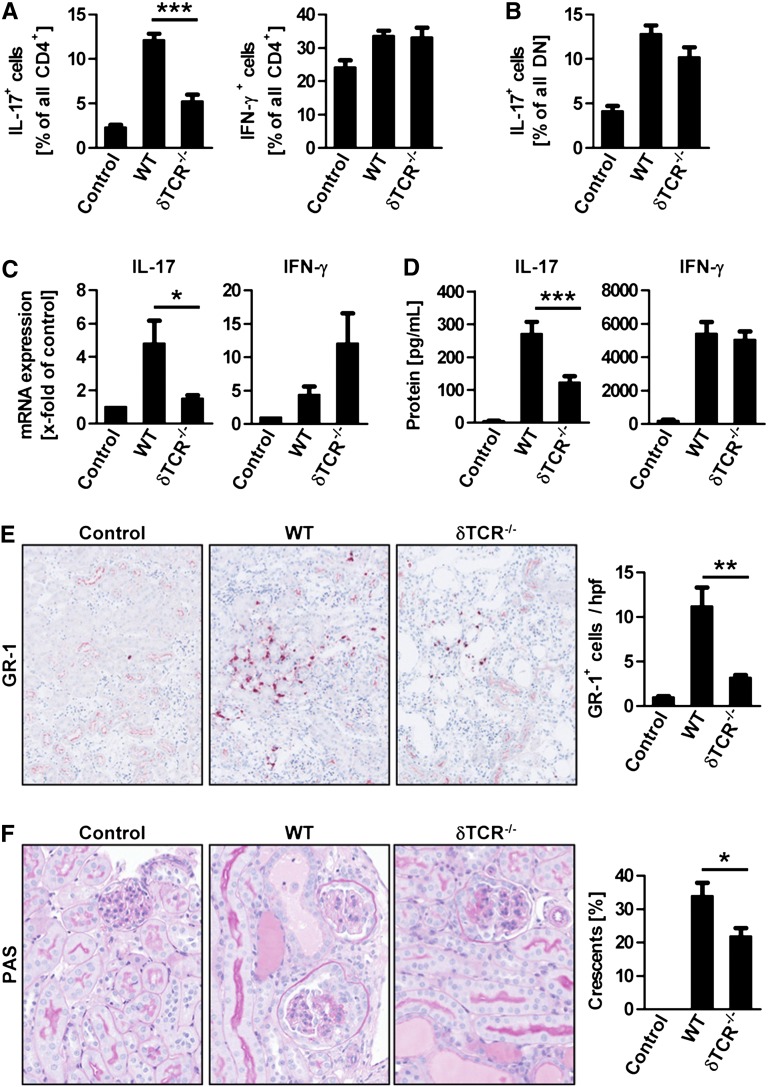
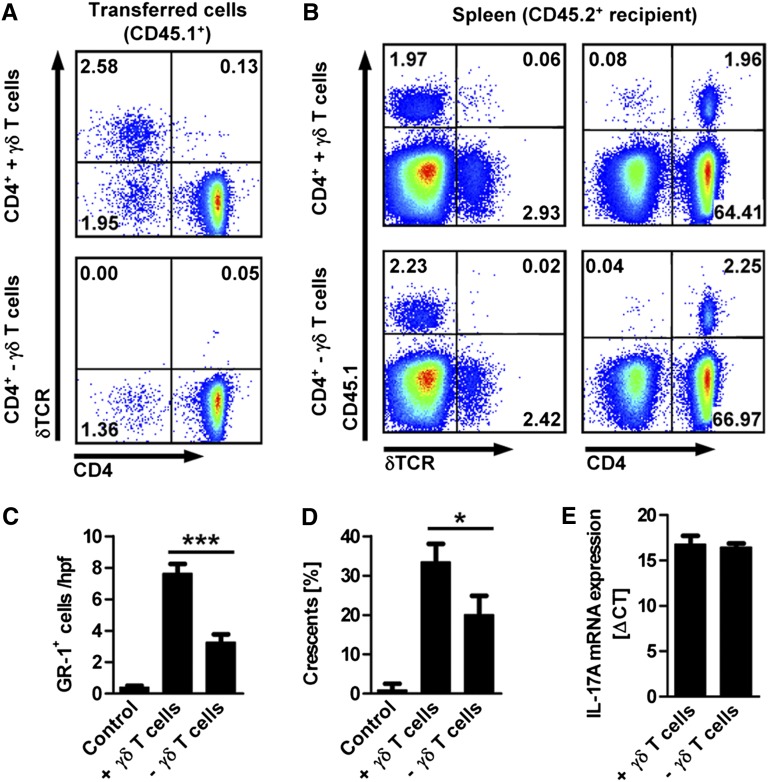
The Th17 immune response appears to contribute to the pathogenesis of human and experimental crescentic GN, but the cell types that produce IL-17A in the kidney, the mechanisms involved in its induction, and the IL-17A-mediated effector functions that promote renal tissue injury are incompletely understood. Here, using a murine model of crescentic GN, we found that CD4(+) T cells, γδ T cells, and a population of CD3(+)CD4(-)CD8(-)γδT cell receptor(-)NK1.1(-) T cells all produce IL-17A in the kidney. A time course analysis identified γδ T cells as a major source of IL-17A in the early phase of disease, before the first CD4(+) Th17 cells arrived. The production of IL-17A by renal γδ T cells depended on IL-23p19 signaling and retinoic acid-related orphan receptor-γt but not on IL-1β or IL-6. In addition, depletion of dendritic cells, which produce IL-23 in the kidney, reduced IL-17A production by renal γδ T cells. Furthermore, the lack of IL-17A production in γδ T cells, as well as the absence of all γδ T cells, reduced neutrophil recruitment into the kidney and ameliorated renal injury. Taken together, these data suggest that γδ T cells produce IL-17A in the kidney, induced by IL-23, promoting neutrophil recruitment, and contributing to the immunopathogenesis of crescentic GN.


Figures

Figure 1.
Figure 1.
Time course of IL-17A production in experimental GN. (A and B) Flow cytometric analysis of renal leukocytes isolated from nephritic mice at day 10 after induction of NTN. For restimulation, cells were cultured with PMA/ionomycin for 4.5 hours before intracellular staining for IL-17A. Plots are gated for live CD45+ lymphocytes. Numbers indicate events in the quadrants in percentage of all gated events. (C) Quantification of the percentage of IL-17A+ cells in the respective T cell subset during the time course of the nephritis (n=7–10 per group for days 0–10 and n=3–4 per group for days 20 and 30). (D) Relative contribution of the IL-17A–producing T cell subsets (in percentages) to total IL-17A+CD3+ cells (100%) after restimulation with PMA/ionomycin at the given time points after induction of NTN. DN, double negative. Bars represent means ± SEM.
Figure 2.
Figure 2.
Characterization of IL-17+ γδ T cells in the kidney. (A) Flow cytometric assessment of the percentage of δTCR+ cells in renal leukocytes before and after FACS sorting for CD45+CD3+δTCR+ cells. Plots are gated on live CD45+ events. Numbers indicate events in the quadrant in percentage of all gated events. (B) IL-17A mRNA expression in renal γδ T cells sorted from naive mice (control) and at day 3 of the nephritis (d3) as shown in part A (n=5 per group). (C) Flow cytometric quantification of γδ T cells in the kidney of the respective groups (n=5 per group). (D) Immunofluorescence image of renal tissue section from γδTCR-H2b-eGFP mice 3 days after induction of NTN (green, γδTCR; blue, Topro III; red, wheat germ agglutinin; original magnification, ×400). (E) Flow cytometric analysis gated for renal γδ T cells after intracellular cytokine staining for IL-17A and IFN-γ 3 days after induction of NTN. The histograms show the expression of cell surface markers for IL-17A+ (red) and IFN-γ+ (blue) γδ T cells. (F) Frequency of surface marker expression in IL-17A+ or IFN-γ+ γδ T cells. Gating was performed as shown in part E (n≥3 per marker). Bars represent means ± SEM. **P<0.01; ***P<0.001.
Figure 3.
Figure 3.
Early IL-17A production by γδ T cells in the kidney is regulated by IL-23. (A and B) Time course of mRNA and protein expression of IL-23p19, IL-1β, IL-18, and IL-6 in the renal cortex (n=5–11 per time point). Bars represent means ± SEM (*P<0.05; **P<0.01; ***P<0.001, all versus day 0). (C) Flow cytometric analysis of renal leukocytes isolated at day 3 of NTN from a heterozygous IL-23R GFP knock-in mouse and a wild-type (WT) mouse. Plots are gated on γδ T cells. (D and E) Flow cytometry plots and quantification of IL-17A+ γδ T cells in percentage of all renal γδ T cells isolated from wild-type, IL-23p19−/−, IL-23R−/−, and IL-1R1−/− mice 3 days after induction of NTN (n=3–7 per group). The percentages of IL-17A+ cells of all renal γδ T cells isolated from IL-6−/− (F) and RORγt–deficient mice (RorC−/−) (G) mice at day 3 after induction of NTN were quantified in separate experimental sets (n=3–5 per group). Bars represent means ± SEM. *P<0.05; **P<0.01; ***P<0.001.
Figure 4.
Figure 4.
Kidney dendritic cells stimulate IL-17A production by local γδ T cells. (A) Flow cytometric assessment of the percentage of CD11c+ dendritic cells in renal leukocytes before and after magnetic bead sorting for CD11c. Plots are gated on live CD45+ events. Numbers indicate events in the gate in percentage of all events shown. (B) mRNA expression of IL-23p19 in renal dendritic cells sorted as shown in part A (n=3–5 per group). (C) Number of renal CD11c+ dendritic cells in control CD11c-DTR mice (control) and in CD11c-DTR mice 3 days after induction of the nephritis (NTN). Dendritic cells were depleted as indicated by injection of diphtheria toxin (DT) 18 hours before the analysis at day 3 (n=3 per group). (D) Quantification of IL-17A+ γδ T cells in percentage of all renal γδ T cells isolated from CD11c-DTR mice with and without NTN or depletion of dendritic cells. Group numbers as in part C. Bars represent means ± SEM *P<0.05; ***P<0.001.
Figure 5.
Figure 5.
γδ T cells aggravate crescentic GN by stimulating the Th17 response. (A) Quantification of the percentage of IL-17A+ and IFN-γ+ cells in the renal CD4+ T cell subset isolated from controls (n=4), nephritic wild-type (WT, n=6), and nephritic δTCR−/− mice (n=7) 6 days after induction of NTN. For restimulation, cells were cultured with PMA/ionomycin for 4.5 hours before intracellular cytokine staining. (B) Percentage of IL-17A+ cells in the double-negative T cell subset. (C) Quantitative RT-PCR measurement of IL-17A and IFN-γ mRNA expression in the renal cortex. (D) ELISA measurement of IL-17A and IFN-γ protein concentrations from supernatants of splenocytes stimulated for 60 hours with sheep IgG. (E) Immunohistochemistry for the neutrophil marker GR-1 (original magnification, ×400) and quantification of GR-1+ cells from renal tissue sections. (F) Periodic acid-Schiff staining of renal tissue sections (original magnification, ×400) and quantification of the percentage of crescentic glomeruli. Group sizes for parts B to E are the same as in part A. Bars represent means ± SEM. *P<0.05; **P<0.01; ***P<0.001.
Figure 6.
Figure 6.
IL-17A production by γδ T cells contributes to immune-mediated kidney injury. (A) Flow cytometric analysis of the cell populations isolated by magnetic bead sorting from spleens of IL-17A–competent CD45.1+ donors. Congenic IL-17A–deficient CD45.2+ recipients received a combination of CD4+ T cells, double-negative T cells, and γδ T cells (upper panel) or a combination of CD4+ T cells and double-negative T cells without γδ T cells (lower panel). Transfer of 5–8×10⁶ cells was performed 24 hours before induction of NTN in IL-17A−/− mice. (B) Flow cytometric analysis of splenocytes isolated from CD45.2+ IL-17A−/− recipients on day 6 after induction of the nephritis. Plots in parts A and B are gated on live cells and the numbers indicate events in the quadrants in percentage of all gated events. (C and D) Quantification of GR-1+ cells (neutrophils) and crescent formation in kidney sections of both groups of cell recipients after 6 day of NTN, as well as in naive IL-17A−/− mice (control) (n=4 per group). (E) Quantitative RT-PCR of IL-17A mRNA expression in transferred (CD45.1+) CD4+ T cells FACS-sorted from the spleen of both groups of cell recipients at day 6 after induction of the nephritis (n=3 per group). mRNA level is expressed as Δcross threshold value normalized to the 18s expression in the respective sample. Bars represent means ± SEM. *P<0.05; ***P<0.001.

Similar articles

Cited by

References

    1. Chadban SJ, Atkins RC: Glomerulonephritis. Lancet 365: 1797–1806, 2005 - PubMed
    1. Tarzi RM, Cook HT, Pusey CD: Crescentic glomerulonephritis: New aspects of pathogenesis. Semin Nephrol 31: 361–368, 2011 - PubMed
    1. Dong X, Bachman LA, Miller MN, Nath KA, Griffin MD: Dendritic cells facilitate accumulation of IL-17 T cells in the kidney following acute renal obstruction. Kidney Int 74: 1294–1309, 2008 - PMC - PubMed
    1. Paust HJ, Turner JE, Steinmetz OM, Peters A, Heymann F, Hölscher C, Wolf G, Kurts C, Mittrücker HW, Stahl RA, Panzer U: The IL-23/Th17 axis contributes to renal injury in experimental glomerulonephritis. J Am Soc Nephrol 20: 969–979, 2009 - PMC - PubMed
    1. Ooi JD, Phoon RK, Holdsworth SR, Kitching AR: IL-23, not IL-12, directs autoimmunity to the Goodpasture antigen. J Am Soc Nephrol 20: 980–989, 2009 - PMC - PubMed

Publication types