. 2012 Aug;122(8):2967-82.
doi: 10.1172/JCI62860. Epub 2012 Jul 17.

Viral acute lower respiratory infections impair CD8+ T cells through PD-1

Affiliations

Viral acute lower respiratory infections impair CD8+ T cells through PD-1

John J Erickson et al. J Clin Invest. 2012 Aug.

Abstract

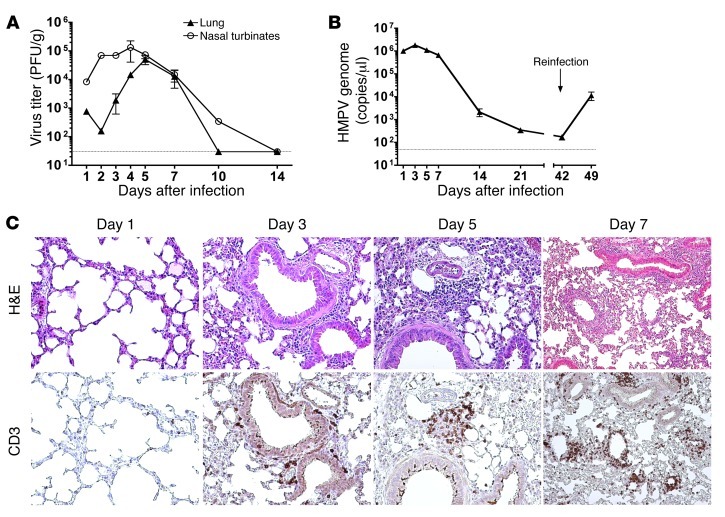
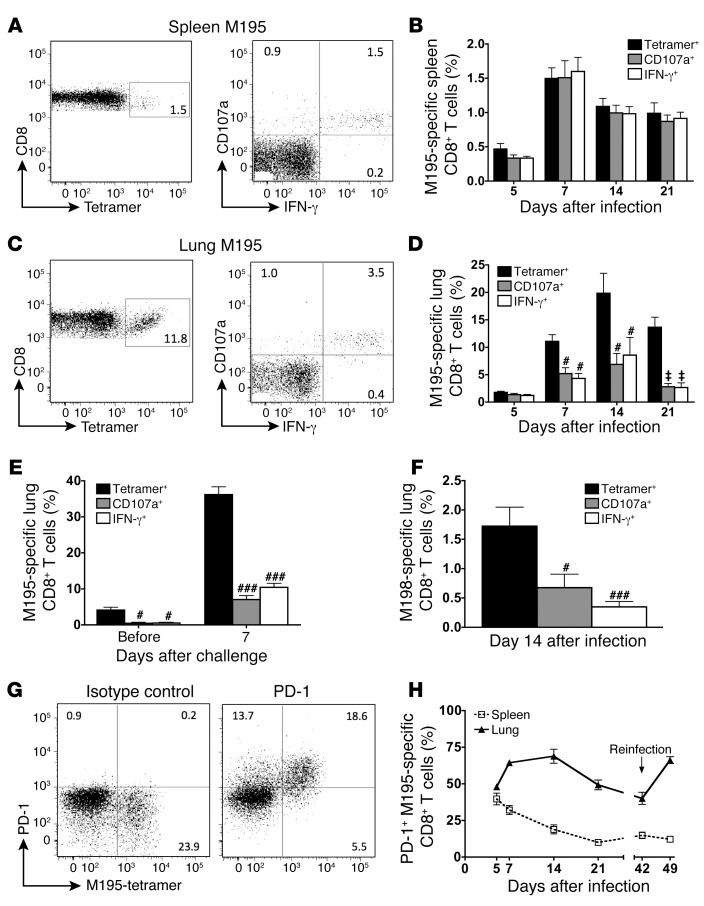
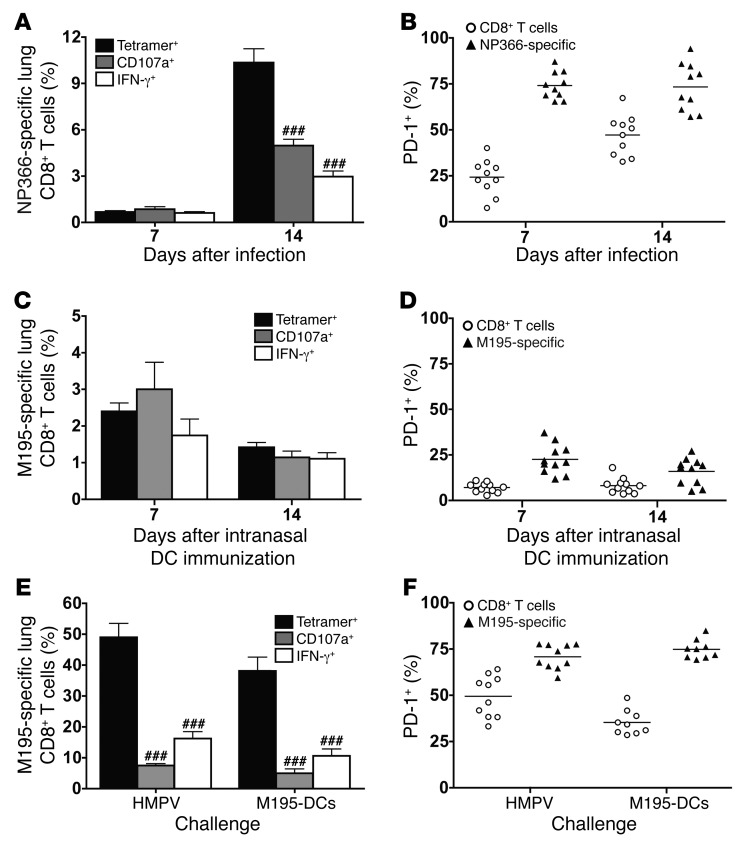
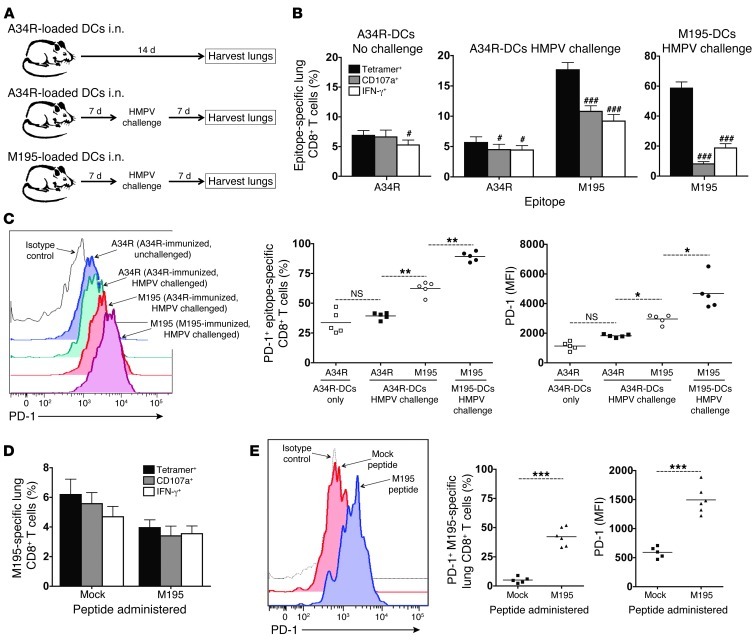
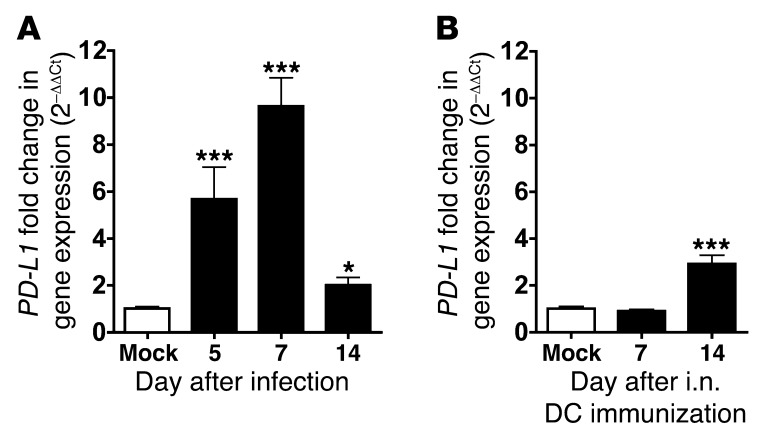
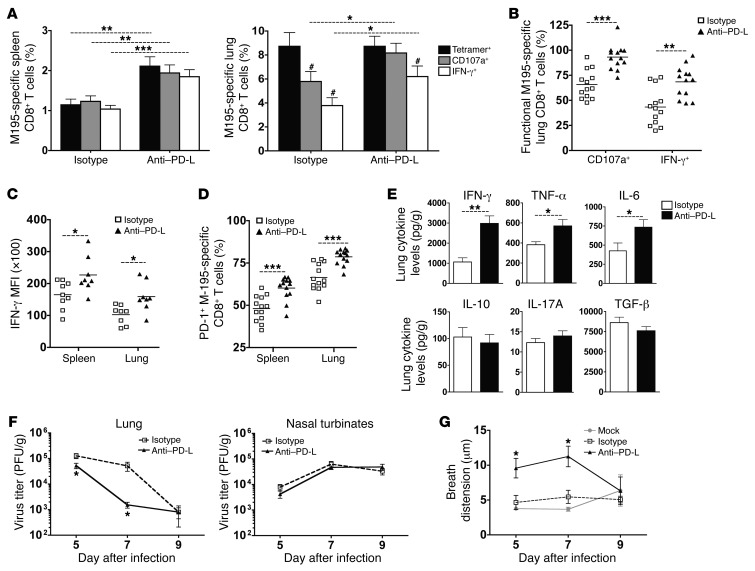
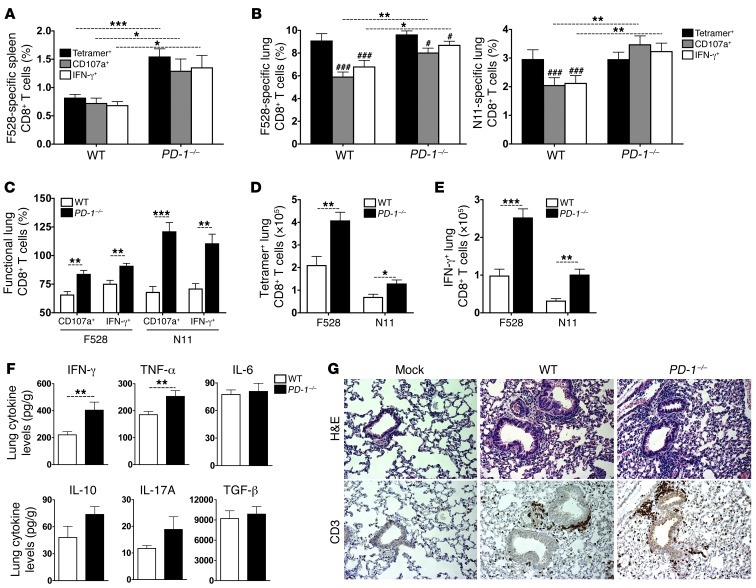
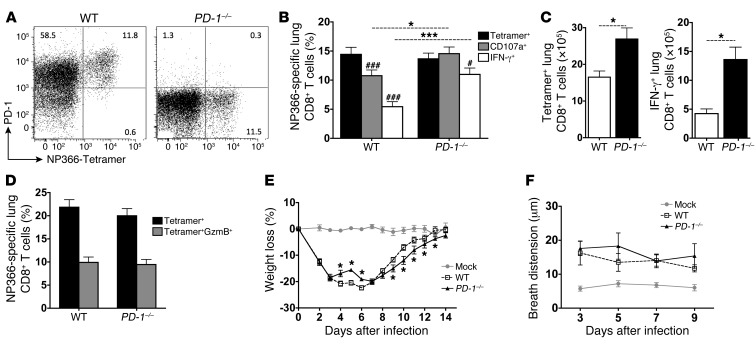
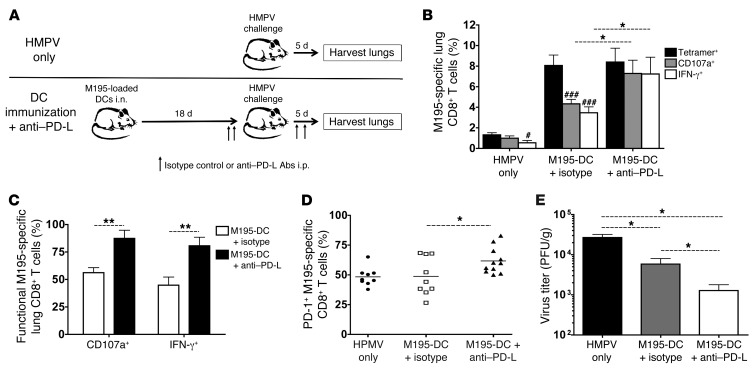
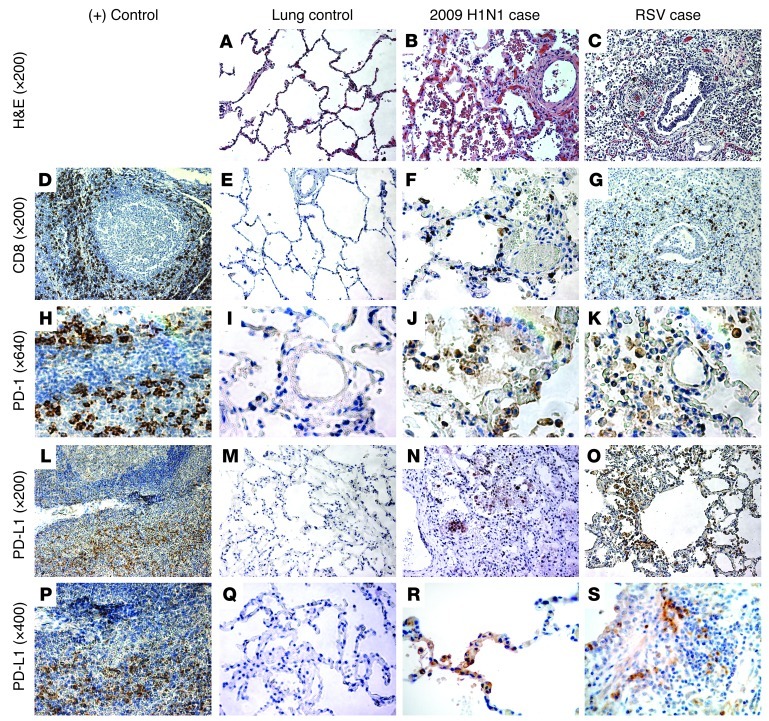
Viruses are leading causes of severe acute lower respiratory infections (LRIs). These infections evoke incomplete immunity, as individuals can be repeatedly reinfected throughout life. We report that acute viral LRI causes rapid pulmonary CD8+ cytotoxic T lymphocyte (TCD8) functional impairment via programmed death-1/programmed death ligand-1 (PD-1/PD-L1) signaling, a pathway previously associated with prolonged antigenic stimulation during chronic infections and cancer. PD-1-mediated TCD8 impairment occurred acutely in mice following infection with human metapneumovirus or influenza virus. Viral antigen was sufficient for PD-1 upregulation, but induction of PD-L1 was required for impairment. During secondary viral infection or epitope-only challenge, memory TCD8 rapidly reexpressed PD-1 and exhibited severe functional impairment. Inhibition of PD-1 signaling using monoclonal antibody blockade prevented TCD8 impairment, reduced viral titers during primary infection, and enhanced protection of immunized mice against challenge infection. Additionally, PD-1 and PD-L1 were upregulated in the lungs of patients with 2009 H1N1 influenza virus, respiratory syncytial virus, or parainfluenza virus infection. These results indicate that PD-1 mediates TCD8 functional impairment during acute viral infection and may contribute to recurrent viral LRIs. Therefore, the PD-1/PD-L1 pathway may represent a therapeutic target in the treatment of respiratory viruses.


Figures

Figure 1
Figure 1. Kinetics of HMPV viral replication and lower airway pathology.
(A) B6 mice were infected i.n. with HMPV and viral titers were quantified for the lungs and nasal turbinates in PFU per gram tissue (n = 3–6 mice per time point). Dotted line indicates the limit of viral detection. (B) Real-time RT-PCR targeting the HMPV N gene was used to quantify genome levels in the lungs of infected mice at the indicated times after infection (n = 5–10 mice per time point). Arrow indicates the time at which mice were challenged with HMPV. (C) Images represent serially cut lung sections stained with H&E or anti-CD3 and are representative of 3–5 individual mice per time point for which viral titers were determined to confirm infection. Original magnification, ×200 (days 1–5); ×100 (day 7). Data in B are representative of 3 experiments.
Figure 2
Figure 2. Pulmonary TCD8 are impaired and upregulate PD-1 during HMPV LRI.
Spleen (A and B) and lung (C and D) lymphocytes were isolated from B7tg mice at the indicated times after HMPV infection. Representative histograms from day 7 after infection (A and C) and combined data from several time points (B and D) enumerate the TCD8 response directed against the M195 epitope. Numbers in flow plots indicate the percentage of CD8+ T cells that either bind to M195 tetramer or respond to restimulation with M195 peptide by mobilizing CD107a to the cell surface (i.e., degranulating) or producing IFN-γ. (E) M195-specific TCD8 response at day 42 after primary infection (Before) and then at day 7 after challenge. (F) N198-specific TCD8 response at day 14 after infection. (G) Representative flow cytometry plots demonstrating PD-1 expression versus M195 tetramer staining at day 14 after infection in the lung. Numbers in each quadrant indicate the percentage of CD8+ T cells. (H) Kinetics of PD-1 expression on spleen or lung M195-specific CD8+ T cells. Arrow indicates the time at which mice were challenged with HMPV (day 42 after primary infection). Data are representative of at least 2 independent experiments with 4–5 individual mice per time point. Twenty-thousand CD8+ T cells were counted for the spleen and 10,000 for the lung. #P < 0.05, P < 0.005, ###P < 0.0005 (2-tailed paired t test); values in DF are relative to tetramer+ cells analyzed in parallel from the same mice at the same time point.
Figure 3
Figure 3. Viral infection is required for pulmonary TCD8 impairment and PD-1 upregulation.
(A and B) B6 mice were infected with IAV (strain A/34/PR/8), and the lung TCD8 response (A) and PD-1 expression (B) were assessed at days 7 and 14 after infection for the H2-Db/NP366 epitope. (C and D) B7tg mice were immunized i.n. with M195 peptide-loaded, LPS-matured DCs, and the lung M195-specific TCD8 response (C) and PD-1 expression (D) were quantified. (E and F) B7tg mice were infected with HMPV and then challenged at least 50 days later with either virus (HMPV) or M195-DCs delivered i.n. Lung lymphocytes were harvested at day 7 after challenge, and the TCD8 response (E) and PD-1 expression (F) were quantified. PD-1 expression on total lung CD8+ lymphocytes and epitope-specific CD8+ T cells are shown (B, D, and F). Each symbol represents an individual mouse, while horizontal lines denote the mean for each group. Data are combined from 2 independent experiments with 5 individual mice per time point per experiment. ###P < 0.0005 (2-tailed paired t test).
Figure 4
Figure 4. Cognate viral antigen in the presence of active LRI is required for PD-1 induction and TCD8 impairment.
(A) Experimental strategy for B and C: B7tg mice were immunized i.n. with VACV A34R-loaded or HMPV M195-loaded DCs, and lung lymphocytes were harvested at either day 14 after immunization (A34R immunization) or day 7 after HMPV challenge (both A34R and M195 immunizations). (B) The A34R- and M195-specific TCD8 responses were quantified in each group of mice as indicated. (C) PD-1 expression is shown as either representative histograms, percentage positive, or MFI. (D and E) Mice were immunized i.n. with M195-loaded DCs, and then 50 μg of either an irrelevant peptide (Mock) or M195 peptide (M195) was administered daily i.n. for 7 days. The M195-specific TCD8 response (D) and PD-1 expression (E) following repeated peptide administration were quantified. Data in B are combined from 3 independent experiments, while data in CE are representative of at least 2 independent experiments with 4–6 individual mice per group per experiment. #P < 0.05, ###P < 0.0005 (2-tailed paired t test). *P < 0.05, **P < 0.005, ***P < 0.0005 (1-way ANOVA with Bonferroni post-test [C] or 2-tailed Student’s t test [E]).
Figure 5
Figure 5. PD-L1 expression increases in lungs upon viral infection but not DC immunization.
B7tg mice were either infected with HMPV (A) or immunized i.n. with M195-loaded DCs (B). At the indicated times after inoculation lung RNA was extracted for quantification of PD-L1 gene expression using real-time RT-PCR. PD-L1 levels were normalized to the housekeeping gene Hprt, and the relative gene expression compared with that in mock-infected animals is shown (2–ΔΔCt method). Data are combined from 2 independent experiments with 4–6 individual mice per time point per experiment. *P < 0.05, ***P < 0.0005 compared with mock-infected mice (2-tailed Student’s t test).
Figure 6
Figure 6. Blocking PD-1 ligation prevents functional impairment of pulmonary TCD8 during HMPV infection.
B7tg mice were injected i.p. with 200 μg of isotype control antibody (Isotype) or both anti–PD-L1 and anti–PD-L2 blocking antibodies (Anti–PD-L) for 2 days prior to infection and then every other day during HMPV infection. (A) The M195-specific TCD8 response was quantified in the spleen and lung on day 7 after infection. (B) The percentage of functional M195-specific pulmonary TCD8 was calculated by dividing the percentage of CD8+ T cells that were either CD107a+ or IFN-γ+ by the percentage of cells that were tetramer+ for both isotype- and anti–PD-L–treated mice. (C) IFN-γ MFI from M195-stimulated cells. (D) PD-1 expression on spleen and lung M195-specific CD8+ T cells. (E) Lung cytokines were quantified by cytometric bead array on day 7 after infection. (Note: IL-2 and IL-4 levels were below the limit of detection). (F) Lung and nasal turbinate viral titers were quantified via plaque assay on days 5, 7, and 9 after infection. (G) Breath distension of peripheral arteries, a measure of pulsus paradoxus and airway dysfunction, was quantified noninvasively by pulse oximetry as described in Methods. “Mock” indicates mice that were mock infected. Data in AE are combined from 2 or 3 independent experiments with 4–5 individual mice per group per experiment, while data in F and G are representative of 2 independent experiments with 5 mice per group. #P < 0.05 (2-tailed paired t test); *P < 0.05, **P < 0.005, ***P < 0.0005 (2-tailed Student’s t test).
Figure 7
Figure 7. Pulmonary TCD8 impairment is prevented during HMPV LRI in PD-1–/– mice.
WT and PD-1–/– mice were infected with HMPV, and 7 days later spleen and lung lymphocytes were harvested. (A and B) The spleen H2-Db/F528–specific TCD8 response (A) and the lung F528 and H2-Kb/N11–specific TCD8 responses (B) were quantified. (CE) The percentage of functional F528- or N11-specific lung TCD8 (C) as well as the absolute number of tetramer+ (D) and IFN-γ+ (E) epitope-specific cells was calculated. (F) Lung cytokines were quantified by cytometric bead array at day 7 after infection. (Note: IL-2 and IL-4 levels were below the limit of detection). (G) Lung sections from WT or PD-1–/– mice were either H&E or anti-CD3 stained. Images are representative of 4 individual mice per group. Original magnification, ×200. Data are combined from 2 (F) or 3 (AE) independent experiments with 4–6 individual mice per group per experiment. #P < 0.05, ###P < 0.0005 (2-tailed paired t test); *P < 0.05, **P < 0.005, ***P < 0.0005 (2-tailed Student’s t test).
Figure 8
Figure 8. Pulmonary TCD8 impairment is improved but recovery is delayed in IAV-infected PD-1–/– mice.
WT and PD-1–/– mice were infected with IAV (strain HK/x31), and 8 days later lung lymphocytes were isolated. (A) Representative flow cytometry plots showing PD-1 staining on NP366-specific TCD8 in WT versus PD-1–/– mice. Numbers in each quadrant indicate the percentage of CD8+ T cells. (B) Quantification of the lung NP366-specific TCD8 response. (C) The absolute number of tetramer+ or IFN-γ+ NP366-specific lung TCD8 was calculated. (D) NP366 tetramer-labeled cells were permeabilized and stained for intracellular GzmB. (E) Weight loss is shown as a percentage of initial body weight. (F) Breath distension was measured as described in Methods. “Mock” indicates mice that were mock infected. Data are combined from 2 (F) or 3 (AE) independent experiment with 5 individual mice per group per experiment. #P < 0.05, ###P < 0.0005 (2-tailed paired t test); *P < 0.05, ***P < 0.0005 (2-tailed Student’s t test).
Figure 9
Figure 9. Anti–PD-L treatment improves secondary immune responses by overcoming TCD8 impairment during challenge infection.
(A) Experimental strategy: mice were either not immunized (HMPV only) or immunized i.n. with M195-loaded DCs. Eighteen days later, mice were challenged with HMPV. Immunized mice were injected i.p. with isotype control antibody (M195-DC + isotype) or both anti–PD-L1 (250 μg) and anti–PD-L2 (200 μg) blocking antibodies (M195-DC + anti–PD-L) for 2 days prior to infection and then on days 1 and 3 during HMPV infection. (B and C) Five days after challenge, the lung M195-specific TCD8 response was quantified (B), and the functionality of these cells was calculated (C). (D) PD-1 expression of lung M195-specific TCD8. (E) Lung viral titers were quantified by plaque assay. Data are combined from 2 independent experiments with 4–6 individual mice per group per experiment. #P < 0.05, ###P < 0.0005 (2-tailed paired t test); *P < 0.05, **P < 0.005 (2-tailed Student’s t test).
Figure 10
Figure 10. PD-1 and PD-L1 are expressed in the lower airways of pediatric patients with severe 2009 H1N1 pandemic IAV or RSV infection.
Lung autopsy specimens were fixed and stained with H&E (AC), anti-CD8 (DG), anti–PD-1 (HK), or anti–PD-L1 (LS) antibodies. Tonsil (D and H) or spleen (L and P) tissue were used as positive controls. “Lung control” (A, E, I, M, and Q) is from a patient with non-pulmonary disease, while “2009 H1N1 case” (B, F, J, N, and R) is from a 12-year old patient with 2009 H1N1 pandemic IAV infection and “RSV case” (C, G, K, O, and S) is from an 18-month-old child with RSV infection. Original magnifications as indicated.

Similar articles

Cited by

References

    1. Williams JV, et al. Human metapneumovirus and lower respiratory tract disease in otherwise healthy infants and children. N Engl J Med. 2004;350(5):443–450. doi: 10.1056/NEJMoa025472. - DOI - PMC - PubMed
    1. Deffrasnes C, Hamelin ME, Boivin G. Human meta­pneumovirus. Semin Respir Crit Care Med. 2007;28(2):213–221. doi: 10.1055/s-2007-976493. - DOI - PubMed
    1. Langley GF, Anderson LJ. Epidemiology and prevention of respiratory syncytial virus infections among infants and young children. Pediatr Infect Dis J. 2011;30(6):510–517. - PubMed
    1. Pavia AT. Viral infections of the lower respiratory tract: old viruses, new viruses, and the role of diagnosis. Clin Infect Dis. 2011;52(suppl 4):S284–S289. doi: 10.1093/cid/cir043. - DOI - PMC - PubMed
    1. Kroll JL, Weinberg A. Human metapneumovirus. Semin Respir Crit Care Med. 2011;32(4):447–453. doi: 10.1055/s-0031-1283284. - DOI - PubMed

Publication types

MeSH terms