. 2012 Aug;122(8):2989-3001.
doi: 10.1172/JCI64427. Epub 2012 Jul 17.

Inflammatory priming predisposes mice to age-related retinal degeneration

Affiliations

Inflammatory priming predisposes mice to age-related retinal degeneration

Debarshi Mustafi et al. J Clin Invest. 2012 Aug.

Abstract

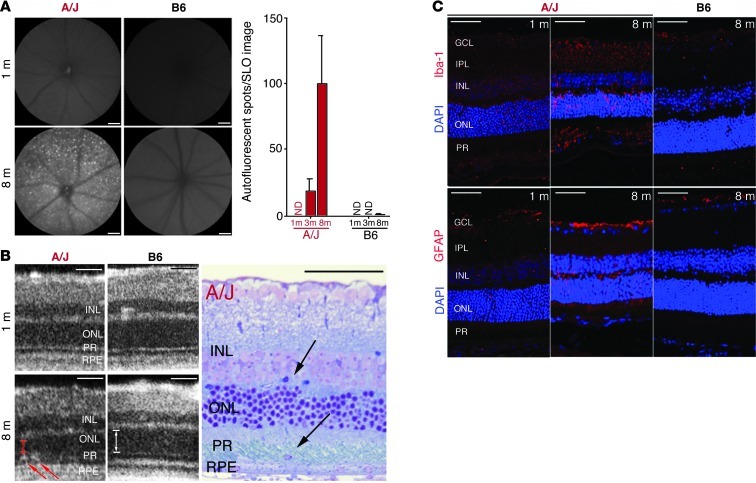
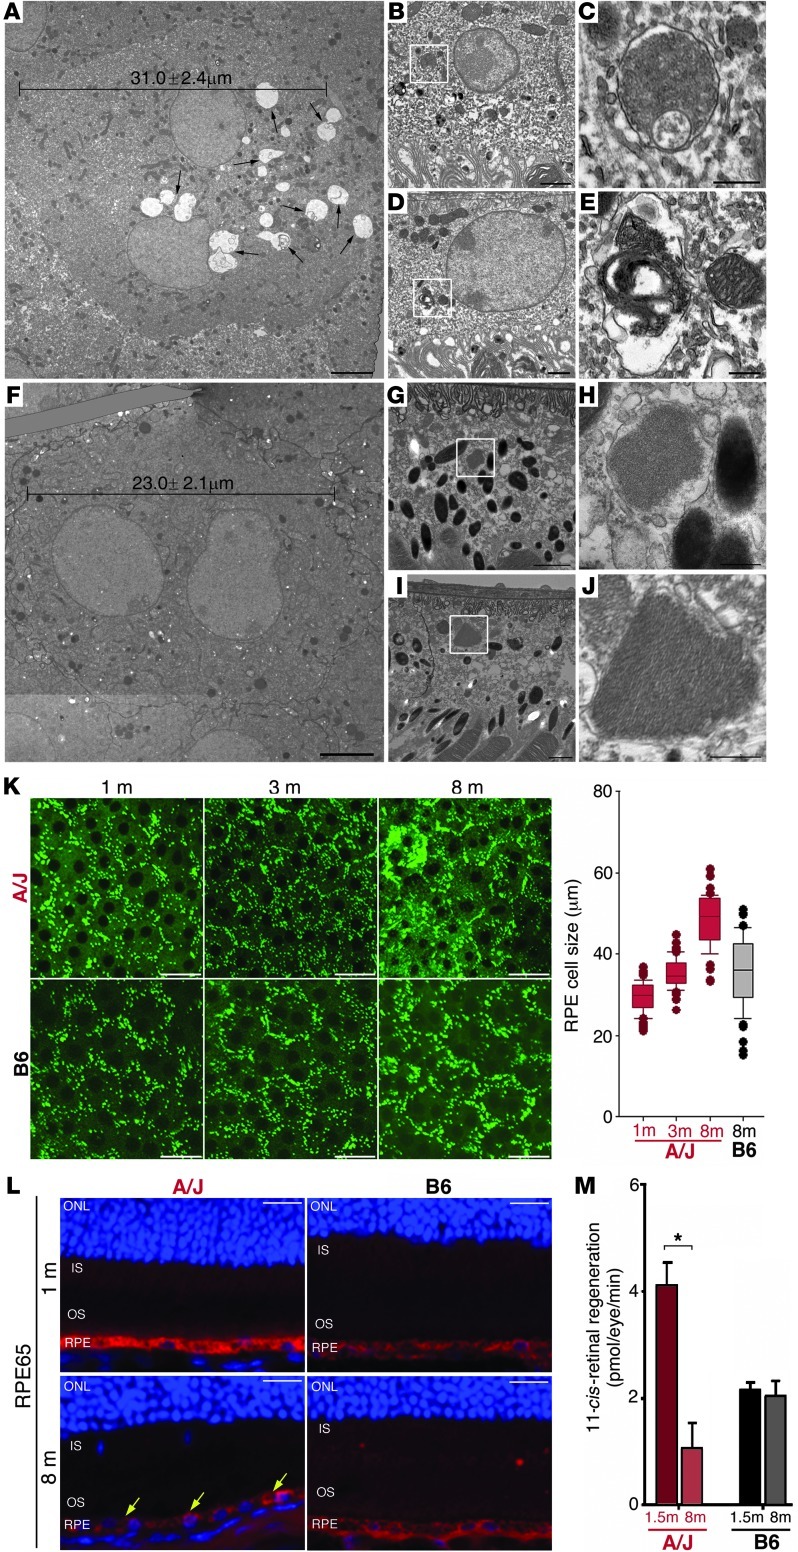
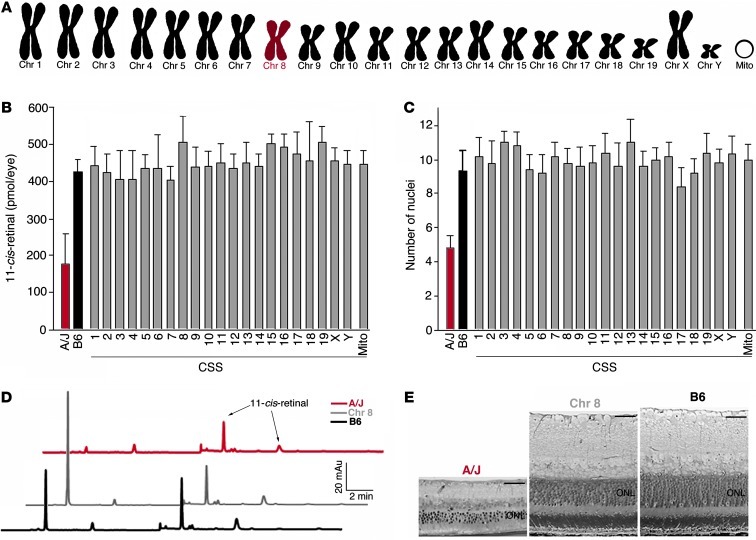
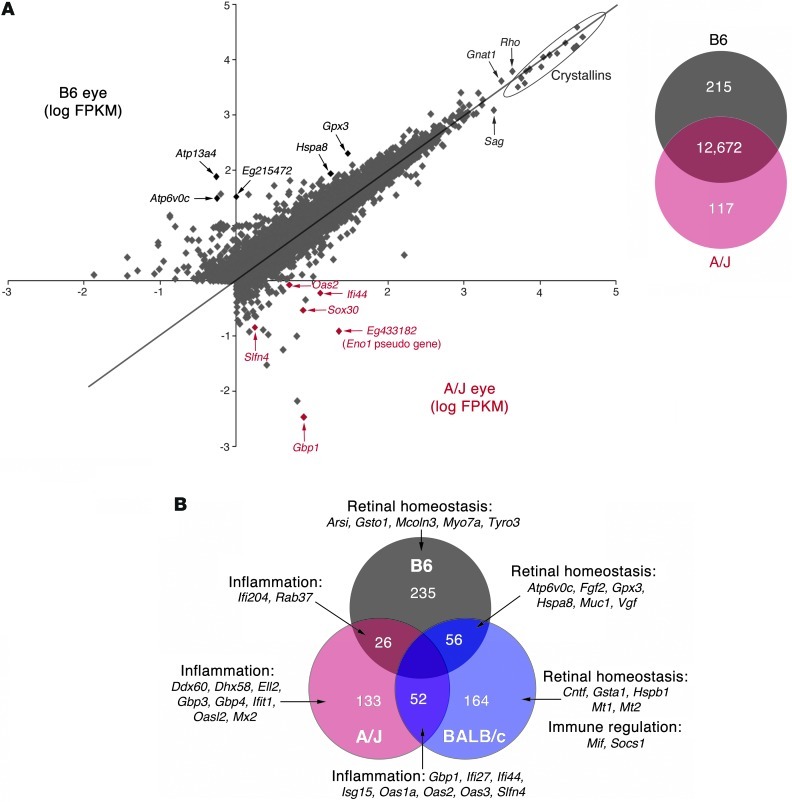
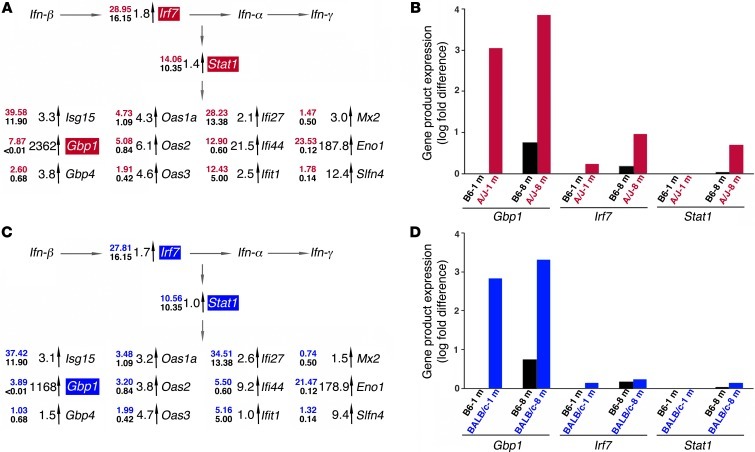
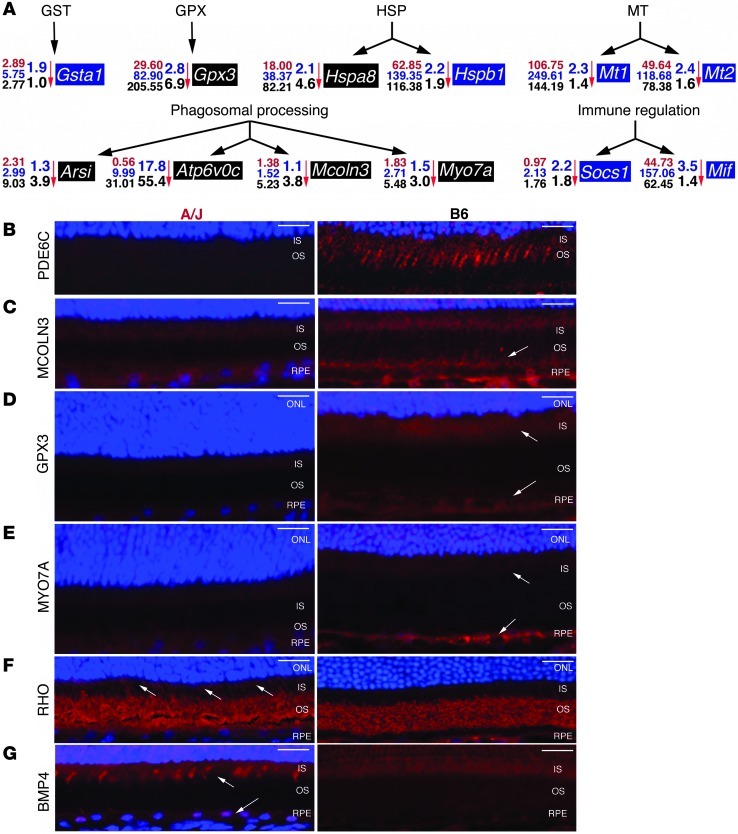
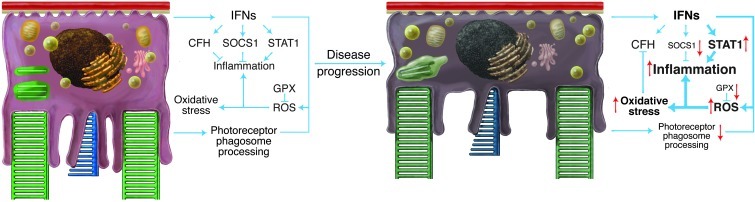
Disruption of cellular processes affected by multiple genes and accumulation of numerous insults throughout life dictate the progression of age-related disorders, but their complex etiology is poorly understood. Postmitotic neurons, such as photoreceptor cells in the retina and epithelial cells in the adjacent retinal pigmented epithelium, are especially susceptible to cellular senescence, which contributes to age-related retinal degeneration (ARD). The multigenic and complex etiology of ARD in humans is reflected by the relative paucity of effective compounds for its early prevention and treatment. To understand the genetic differences that drive ARD pathogenesis, we studied A/J mice, which develop ARD more pronounced than that in other inbred mouse models. Although our investigation of consomic strains failed to identify a chromosome associated with the observed retinal deterioration, pathway analysis of RNA-Seq data from young mice prior to retinal pathological changes revealed that increased vulnerability to ARD in A/J mice was due to initially high levels of inflammatory factors and low levels of homeostatic neuroprotective factors. The genetic signatures of an uncompensated preinflammatory state and ARD progression identified here aid in understanding the susceptible genetic loci that underlie pathogenic mechanisms of age-associated disorders, including several human blinding diseases.


Figures

Figure 1
Figure 1. A/J mice display a pronounced age-dependent decline in vision.
(A) Light microscopy of A/J mouse retinas revealed a marked decrease in ONL and inner nuclear layer (INL) thickness in 8- versus 1-month-old animals, as well as pathological changes in the RPE layer at 8 months of age, as shown by the higher-magnification view of the boxed region (arrow, pyknotic cell). These changes were minimal in B6 mice. (B) ONL thickness, plotted as a function of distance from the optic nerve head (ONH), showed the most pronounced decline occurred between 3 and 8 months of age, a finding that was absent in B6 mice. (C) Cone cell sheaths were imaged by PNA staining at 1, 3, and 8 months of age. Average numbers of cone cells in both the superior and inferior retina in a 100-μm range located 500 μm from the optic nerve head were plotted (red, A/J; black, B6). A/J mice showed a marked decline between 3 and 8 months of age. (D) Representative ERG responses at 1.6 log cd•s•m–2, and functional a-wave and b-wave amplitudes, obtained from A/J (red) and B6 (black) mice at 1, 3, and 8 months of age. ERG responses were more attenuated with age in A/J versus B6 mice under both scotopic and photopic conditions (P < 0.001). Scale bars: 20 μm (A and C).
Figure 2
Figure 2. Increased retinal autofluorescence in A/J mice with age relates to inflammatory changes and immune cell infiltration.
(A) Representative SLO autofluorescent images of the outer retina (480 nm excitation; emission filter, 500–700 nm) of 1- and 8-month-old A/J and B6 mice. A/J mice exhibited increased autofluorescent spots with age, which were negligible in B6 mice (n > 3). ND, not detectable. (B) SD-OCT imaging of A/J and B6 mice at 1 and 8 months of age revealed infiltrating cells only in the subretinal space of 8-month-old A/J mice (left; red arrows) that were also observed in plastic block sections (right; black arrows). Thickness of ONL in OCT images is indicated by arrows to highlight the decline in A/J versus B6 mice at 8 months. (C) The cellular infiltration seen by OCT and in plastic sections was of inflammatory origin, as evidenced by increased Iba-1 staining (activated microglia cells) and increased GFAP staining (activated Müller glial cells and astrocytes) in retinas of 8- versus 1-month-old A/J mice. These age-related changes were absent from 8-month-old B6 mouse retina. GCL, ganglion cell layer; IPL, inner plexiform layer; PR, photoreceptor layer. Scale bars: 50 μm.
Figure 3
Figure 3. Substantial pathological changes are apparent in RPE cells of A/J mice before measurable visual decline.
(AJ) TEM imaging of 3-month-old (AE) A/J and (FJ) B6 retinas. (A) A/J RPE cells had an average width of 31.0 μm, with abnormal disc membrane accumulations (black arrows). (B) Ingested phagosomes in A/J mice showed (C) undigested accumulations. (D) Phagosomes were also disrupted, with (E) phagocytotic material exposed to the cytoplasm. (F) B6 RPE cells had an average width of 23.0 μm, with (G) uptake of discs that (H) were normally processed. (I) Ingested discs trafficked normally, with (J) membrane-enclosed disc elements clearly visible. Boxed regions in B, D, G, and I are shown at higher magnification in C, E, H, and J, respectively. (K) Ex vivo TPM imaging of A/J and B6 RPE cells at 1, 3, and 8 months of age. Dysmorphic features in 3-month-old A/J mice were exacerbated in 8-month-old A/J mice, but were absent in B6 mice. Boxes denote interquartile range, lines within boxes denote median, whiskers denote 10th and 90th percentiles, and symbols denote outliers. (L) RPE65 provided a localized uniform signal in 1-month-old A/J mouse retina, but a decreased and heterogeneously localized signal in 8-month-old A/J mouse retina (yellow arrows). No apparent age-related changes were noted in retinas of B6 mice. (M) Regeneration of 11-cis-retinal decreased 75% in A/J retinas by 8 months of age; no such change was noted in B6 mice. *P < 0.05. Scale bars: 5 μm (A and F); 1 μm (B, D, G, and I); 0.5 μm (C, E, H, and J); 20 μm (K and L).
Figure 4
Figure 4. Genetic panel study reveals no significant phenotypic changes in B6 mice with single A/J chromosome substitutions.
A CSS panel was used in which single chromosomes (Chr) 1–19, X, Y, and mitochondrial DNA (Mito) from A/J mice were substituted into the B6 background. (A) An example of the genetic makeup of chromosome 8–substituted mice, which possess only chromosome 8 from A/J mice and all other chromosomes from B6 mice. No significant functional or structural changes were observed at 8 months when (B) 11-cis-retinal levels and (C) nuclei numbers in the ONL were compared in all CSSs relative to B6 mice. Representative (D) HPLC chromatograms and (E) plastic block sections of A/J, B6, and Chr 8 mice. Scale bars: 40 μm (E).
Figure 5
Figure 5. RNA-Seq of 3 individual biological replicates of 1-month-old A/J, BALB/c and B6 mouse eyes reveals differential transcriptome profiles.
(A) Left: Plot of log FPKM from A/J and B6 runs. The most highly expressed transcripts common to both A/J and B6 eyes were the lens crystallin genes (outlined) and rod photoreceptor genes such as Gnat1, Rho, and Sag. Most genes highly differentially expressed in the A/J eye relate to inflammation (red), whereas genes with the lowest differential expression in the A/J eye encode homeostatic proteins (black). Right: Whereas 12,672 genes had similar expression, 332 were differentially expressed by at least 2-fold (P ≤ 0.05) between A/J and B6 eyes. (B) Examination of all 3 mouse eye transcriptomes revealed those genes exclusively more highly expressed in a single mouse strain compared with the other 2 strains, and those sharing increased expression with respect to the third strain. For example, 235 genes are exclusively more highly expressed in the B6 eye; this strain shares 26 genes also highly expressed in the A/J eye and 56 also higher in the BALB/c eye. Importantly, a large cohort of inflammatory genes exhibits increased expression in A/J mice. Interestingly, although both A/J and BALB/c eyes share increased expression of inflammatory genes, only BALB/c exhibits a counteracting increased expression of retinal homeostatic and immune regulatory genes, either exclusively or shared with B6 eyes.
Figure 6
Figure 6. Pathway analysis of RNA-Seq differential expression profiles reveals age-related inflammatory priming in eyes of A/J mice.
(A) Pathway analysis with Ingenuity software unveiled an aberrant inflammatory network in A/J mice characterized by priming of IFN at 1 month of age, as evidenced by increased activation of Irf7 and Stat1, coordinated increased expression of Stat1-induced secondary response genes, induction of positive regulatory loop genes in the inflammatory process, and expression of genes involved in immune cell activation. Numbers at left of each gene represent the RNA-Seq FPKM values from A/J (top; red) and B6 (bottom; black) eyes; fold differences are indicated next to the vertical arrows. (B) RT-PCR of Gbp1, Irf7, and Stat1 (shaded red in A) showed that this inflammatory priming network was preferentially exacerbated in older mice, with pronounced increases in gene product expression from 1 to 8 months of age in A/J relative to B6 mice. (C) BALB/c mice also exhibited features of inflammatory priming at 1 month of age when the same pathways were examined, but these changes were less pronounced than those in A/J mice. Numbers at left of each gene represent the RNA-Seq FPKM values from BALB/c (top; blue) and B6 (bottom; black) eyes; fold differences are indicated next to the vertical arrows. (D) RT-PCR of Gbp1, Irf7, and Stat1 (shaded blue in C) showed that in BALB/c mice, inflammatory priming was not exacerbated from 1 to 8 months of age, similar to findings in B6 mice.
Figure 7
Figure 7. Homeostatic processing genes with decreased expression in A/J mice display protein expression in RPE and photoreceptor compartments of the retina.
(A) Expression of genes of the GST, GPX, HSP, and MT families, as well as genes involved in phagosomal processing and in immune regulation, exhibited markedly decreased expression in A/J compared with both BALB/c and B6 mice. Numbers at left of each gene represent the RNA-Seq FPKM values from A/J (red), BALB/c (blue), and B6 (black) eyes; fold difference in A/J versus BALB/c (top; blue) and A/J versus B6 (bottom; black) is indicated next to each vertical arrow. Blue shading denotes genes with greater expression in BALB/c; black shading denotes genes with greater expression in B6. (BG) IHC of 1-month-old A/J and B6 retinas was done with (B) PDE6C, cone cell marker; (C) MCOLN3, involved in lysosomal degradation; (D) GPX3, involved in ROS detoxification; (E) MYO7A, involved in protein trafficking; (F) RHO, visual pigment in rod photoreceptors; and (G) BMP4, marker of RPE cell senescence. MCOLN3, GPX3, and MYO7A staining was much more pronounced in B6 RPE (arrows in CE). The aberrant nature of the A/J RPE cell was evidenced by mislocalization of RHO, as evidenced by signals in both the outer and inner segment (OS and IS, respectively; arrows in F) and increased expression of BMP4 in inner segment and RPE (arrows in G) in A/J mice. Scale bars: 20 μm.
Figure 8
Figure 8. Inadequate protection by the RPE from stress drives the retina from an inflammatory-primed state to a chronic disease state.
In a normal homeostatic state (left), there is a delicate balance between stress and the resulting tissue response. Stress caused by POS accumulation in the RPE from daily ingestion of oxidized photoreceptor discs could result in oxidative damage and inflammation unless modulated by a network of enzymes such as GPX. Moreover, activation of inflammatory factors like STAT1 in response to such RPE cell stress is controlled by regulatory factors such as SOCS1 and complement factor H (CFH). In contrast, low or declining levels of protein expression from these complex sets of interconnected gene networks (right) result in inadequate stress protection and inflammatory changes that cause chronic retinal degeneration. Thus, decreased expression of homeostatic genes like Gpx foster increased oxidative stress and can reduce other protective factors like Cfh. This is compounded by decreased expression of immune regulatory factors that can exacerbate inflammation and drive disease progression. Subtle genetic differences therefore can have profound effects on the predisposition to and pathogenesis of ARD.

Similar articles

Cited by

References

    1. Kirkwood TBL. Understanding the odd science of aging. Cell. 2005;120(4):437–447. doi: 10.1016/j.cell.2005.01.027. - DOI - PubMed
    1. Medzhitov R, Schneider DS, Soares MP. Disease tolerance as a defense strategy. Science. 2012;335(6071):936–941. doi: 10.1126/science.1214935. - DOI - PMC - PubMed
    1. Luo DG, Xue T, Yau KW. How vision begins: An odyssey. Proc Natl Acad Sci U S A. 2008;105(29):9855–9862. doi: 10.1073/pnas.0708405105. - DOI - PMC - PubMed
    1. Strauss O. The retinal pigment epithelium in visual function. Physiol Rev. 2005;85(3):845–881. doi: 10.1152/physrev.00021.2004. - DOI - PubMed
    1. Baker DJ, et al. Clearance of p16(Ink4a)-positive senescent cells delays ageing-associated disorders. Nature. 2011;479(7372):232–237. doi: 10.1038/nature10600. - DOI - PMC - PubMed

Publication types