

Formation of complex extrachromosomal T-DNA structures in Agrobacterium tumefaciens-infected plants
- PMID: 22797657
- PMCID: PMC3440224
- DOI: 10.1104/pp.112.200212
Formation of complex extrachromosomal T-DNA structures in Agrobacterium tumefaciens-infected plants
Abstract
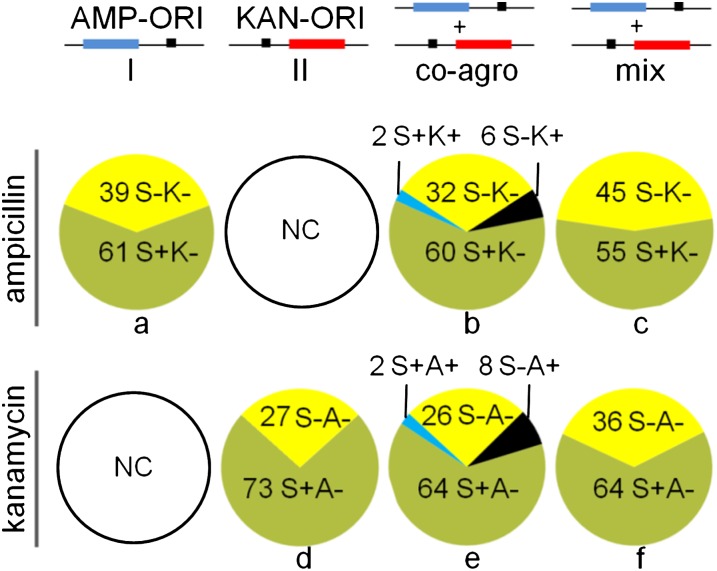
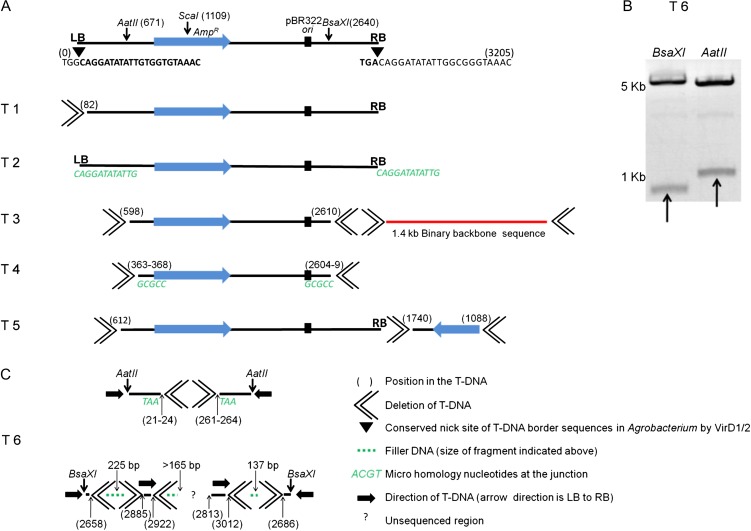
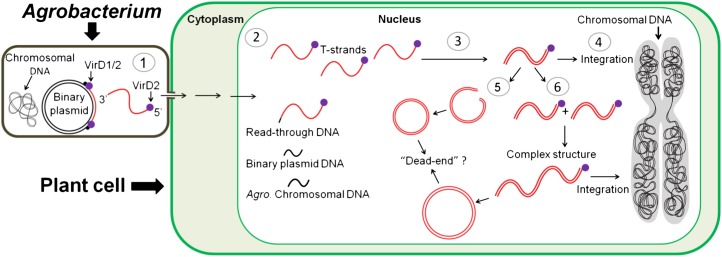
Agrobacterium tumefaciens is a unique plant pathogenic bacterium renowned for its ability to transform plants. The integration of transferred DNA (T-DNA) and the formation of complex insertions in the genome of transgenic plants during A. tumefaciens-mediated transformation are still poorly understood. Here, we show that complex extrachromosomal T-DNA structures form in A. tumefaciens-infected plants immediately after infection. Furthermore, these extrachromosomal complex DNA molecules can circularize in planta. We recovered circular T-DNA molecules (T-circles) using a novel plasmid-rescue method. Sequencing analysis of the T-circles revealed patterns similar to the insertion patterns commonly found in transgenic plants. The patterns include illegitimate DNA end joining, T-DNA truncations, T-DNA repeats, binary vector sequences, and other unknown "filler" sequences. Our data suggest that prior to T-DNA integration, a transferred single-stranded T-DNA is converted into a double-stranded form. We propose that termini of linear double-stranded T-DNAs are recognized and repaired by the plant's DNA double-strand break-repair machinery. This can lead to circularization, integration, or the formation of extrachromosomal complex T-DNA structures that subsequently may integrate.
Figures
Similar articles
-
Small high-yielding binary Ti vectors pLSU with co-directional replicons for Agrobacterium tumefaciens-mediated transformation of higher plants.Plant Sci. 2012 May;187:49-58. doi: 10.1016/j.plantsci.2012.01.012. Epub 2012 Feb 2. Plant Sci. 2012. PMID: 22404832
-
pSa causes oncogenic suppression of Agrobacterium by inhibiting VirE2 protein export.J Bacteriol. 1999 Jan;181(1):186-96. doi: 10.1128/JB.181.1.186-196.1999. J Bacteriol. 1999. PMID: 9864329 Free PMC article.
-
Agrobacterium may delay plant nonhomologous end-joining DNA repair via XRCC4 to favor T-DNA integration.Plant Cell. 2012 Oct;24(10):4110-23. doi: 10.1105/tpc.112.100495. Epub 2012 Oct 12. Plant Cell. 2012. PMID: 23064322 Free PMC article.
-
[T-DNA integration patterns in transgenic plants mediated by Agrobacterium tumefaciens].Yi Chuan. 2011 Dec;33(12):1327-34. doi: 10.3724/sp.j.1005.2011.01327. Yi Chuan. 2011. PMID: 22207378 Review. Chinese.
-
Sorghum (Sorghum bicolor L.).Methods Mol Biol. 2006;343:233-44. doi: 10.1385/1-59745-130-4:233. Methods Mol Biol. 2006. PMID: 16988348 Review.
Cited by
-
Promoter analysis of the SPATULA (FvSPT) and SPIRAL (FvSPR) genes in the woodland diploid strawberry (Fragaria vesca L.).Biol Futur. 2021 Sep;72(3):373-384. doi: 10.1007/s42977-021-00089-x. Epub 2021 Jun 9. Biol Futur. 2021. PMID: 34554560
-
Low-affinity iron transport protein Uvt3277 is important for pathogenesis in the rice false smut fungus Ustilaginoidea virens.Curr Genet. 2017 Feb;63(1):131-144. doi: 10.1007/s00294-016-0620-4. Epub 2016 Jun 15. Curr Genet. 2017. PMID: 27306226
-
Characterization of T-Circles and Their Formation Reveal Similarities to Agrobacterium T-DNA Integration Patterns.Front Plant Sci. 2022 May 6;13:849930. doi: 10.3389/fpls.2022.849930. eCollection 2022. Front Plant Sci. 2022. PMID: 35599900 Free PMC article.
-
Genetic Modification for Wheat Improvement: From Transgenesis to Genome Editing.Biomed Res Int. 2019 Mar 10;2019:6216304. doi: 10.1155/2019/6216304. eCollection 2019. Biomed Res Int. 2019. PMID: 30956982 Free PMC article. Review.
-
Integrative gene transfer in the truffle Tuber borchii by Agrobacterium tumefaciens-mediated transformation.AMB Express. 2014 May 29;4:43. doi: 10.1186/s13568-014-0043-x. eCollection 2014. AMB Express. 2014. PMID: 24949275 Free PMC article.
References
-
- Bakkeren G, Koukolíková-Nicola Z, Grimsley N, Hohn B. (1989) Recovery of Agrobacterium tumefaciens T-DNA molecules from whole plants early after transfer. Cell 57: 847–857 - PubMed
-
- Bleuyard JY, Gallego ME, White CI. (2006) Recent advances in understanding of the DNA double-strand break repair machinery of plants. DNA Repair (Amst) 5: 1–12 - PubMed
Publication types
MeSH terms
Substances
LinkOut - more resources
Full Text Sources
Other Literature Sources
