. 2012 Jul 15;44(8):861-71.
doi: 10.1038/ng.2350.

The Blk pathway functions as a tumor suppressor in chronic myeloid leukemia stem cells

Affiliations

The Blk pathway functions as a tumor suppressor in chronic myeloid leukemia stem cells

Haojian Zhang et al. Nat Genet. .

Abstract

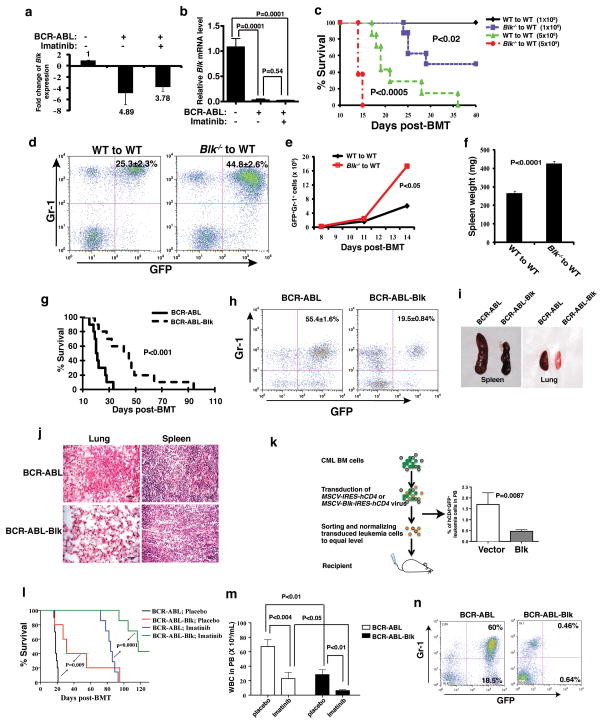
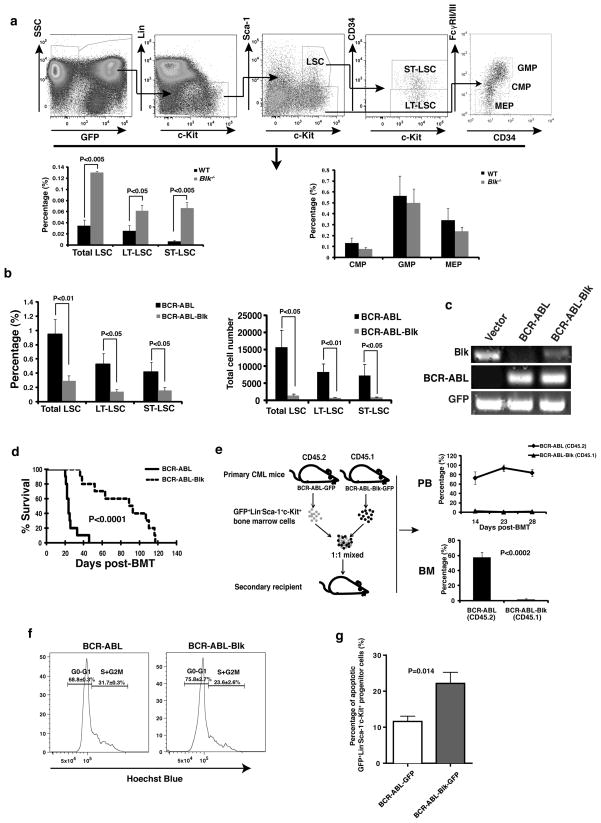
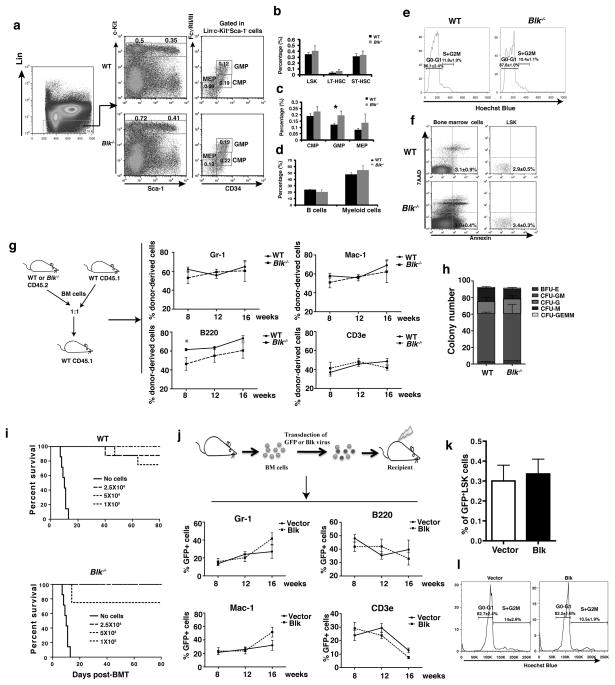
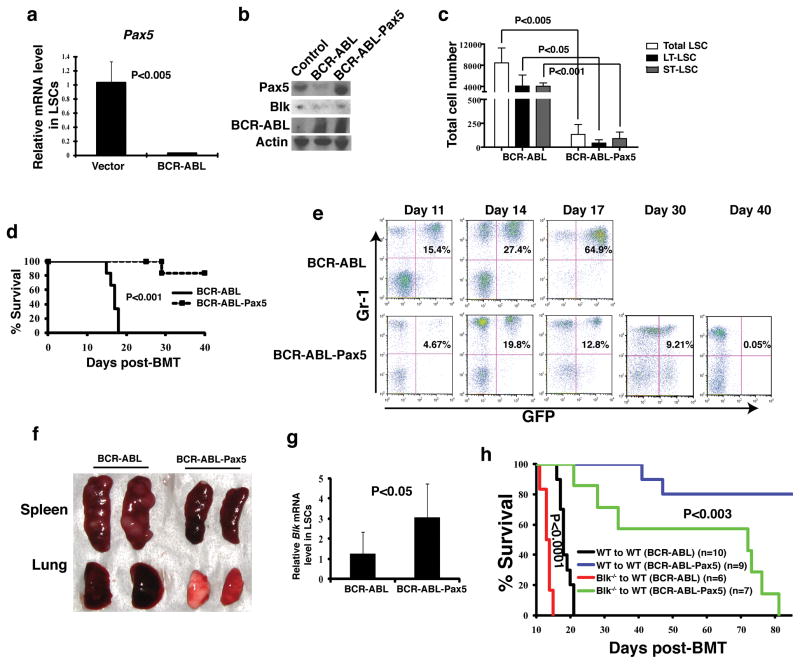
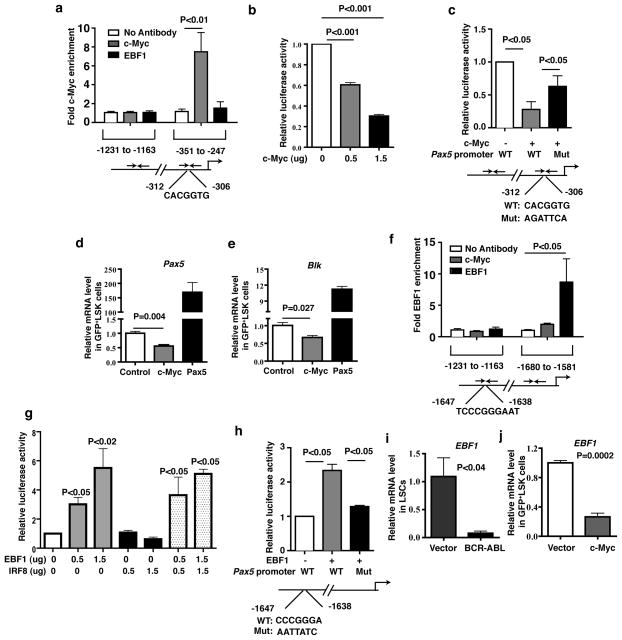
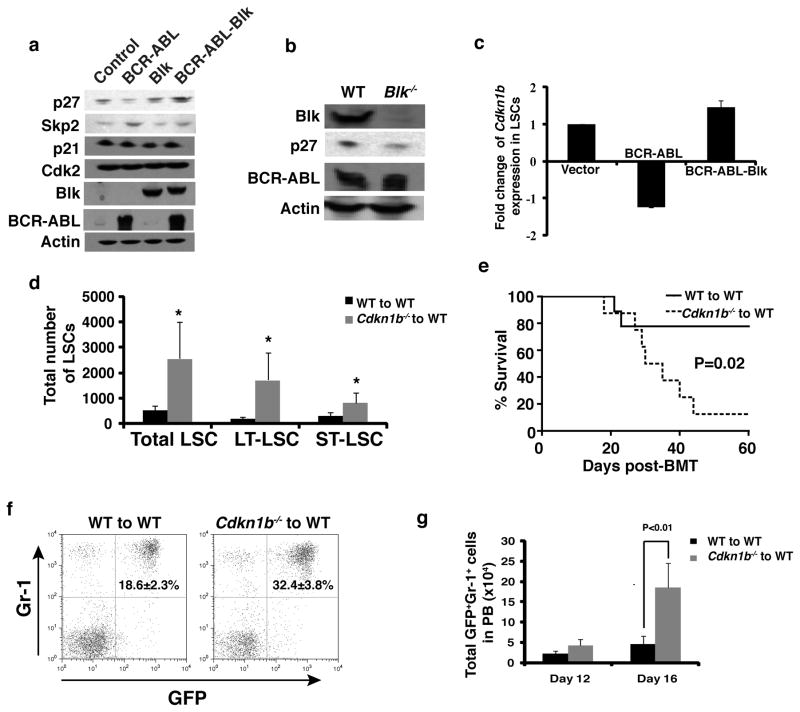
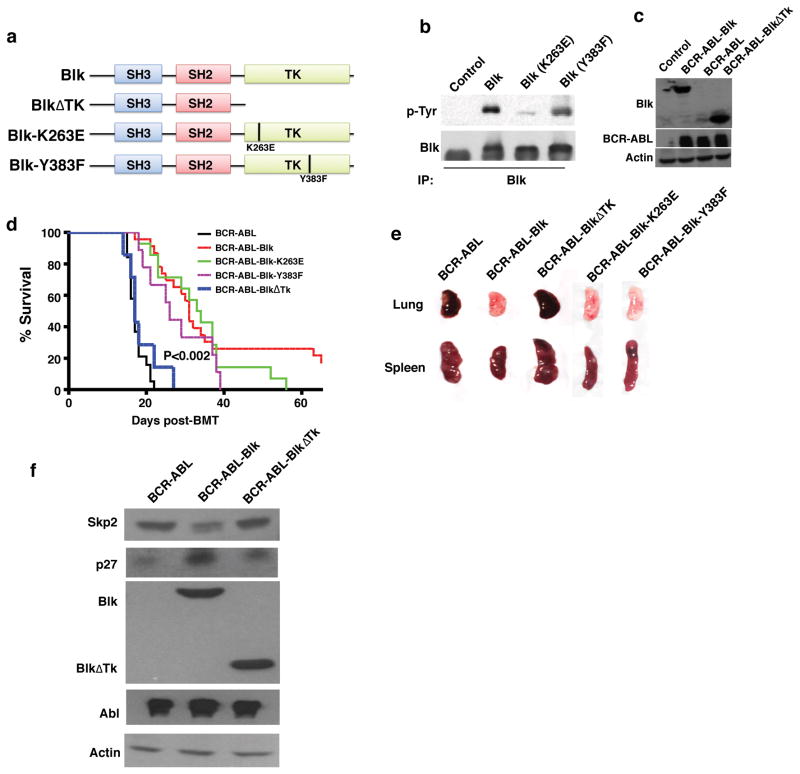
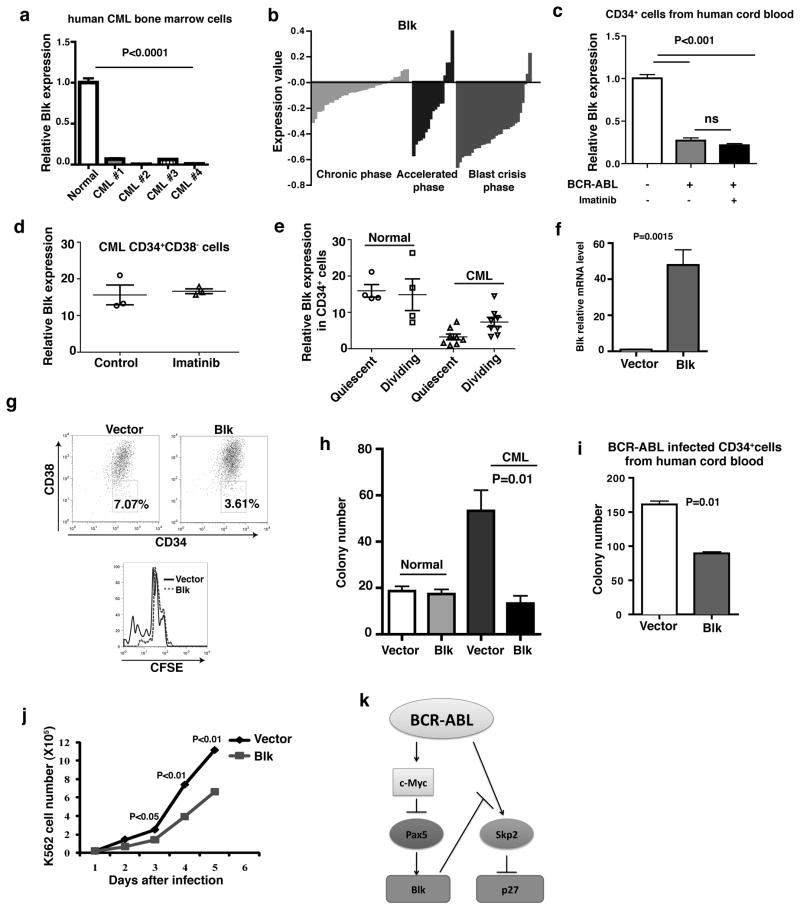
A therapeutic strategy for treating cancer is to target and eradicate cancer stem cells (CSCs) without harming their normal stem cell counterparts. The success of this approach relies on the identification of molecular pathways that selectively regulate CSC function. Using BCR-ABL-induced chronic myeloid leukemia (CML) as a disease model for CSCs, we show that BCR-ABL downregulates the Blk gene (encoding B-lymphoid kinase) through c-Myc in leukemic stem cells (LSCs) in CML mice and that Blk functions as a tumor suppressor in LSCs but does not affect normal hematopoietic stem cells (HSCs) or hematopoiesis. Blk suppresses LSC function through a pathway involving an upstream regulator, Pax5, and a downstream effector, p27. Inhibition of this Blk pathway accelerates CML development, whereas increased activity of the Blk pathway delays CML development. Blk also suppresses the proliferation of human CML stem cells. Our results show the feasibility of selectively targeting LSCs, an approach that should be applicable to other cancers.


Conflict of interest statement

Authors have no competing financial interests.

Figures

Figure 1
Figure 1. Blk suppresses CML induction by BCR-ABL
(a) Microarray analysis Blk expression in LSCs of CML mice and upon imatinib treatment. Mean ± s.e.m. (b) Real-time RT-PCR analysis of Blk expression in LSCs of CML mice compared to GFP vector-transduced normal stem cells. Mean ± s.e.m. (c) Kaplan-Meier survival curves for recipients of BCR-ABL-transduced bone marrow cells from WT (n=7) or Blk−/− (n=8) donor mice. (d) The percentage of GFP+Gr-1+ cells in peripheral blood at day 11 after transplantation. (P<0.002). (e) Total number of GFP+Gr-1+ cells in peripheral blood at days 8, 11, 14 after transplantation. (P<0.05). (f) Spleen weight at day 11 after transplantation. Mean ± s.e.m. (g) Kaplan-Meier survival curves for recipients of BCR-ABL (n=10) or BCR-ABL-Blk (n=10) transduced bone marrow cells. (h) The percentage of GFP+Gr-1+ cells in peripheral blood at day 15 after transplantation. (P<0.001). (i) Gross appearance of the lungs and spleens at day 15 after transplantation. (j) Photomicrographs of haematoxylin and eosin-stained lung and spleen sections (Scale bar = 100μm). (k) Leukemia cell growth in recipients transplanted with equal numbers of GFP+hCD4+ cells. Mean ± s.e.m. (l) Kaplan-Meier survival curves for recipients of BCR-ABL (n=7) or BCR-ABL-Blk (n=7) transduced bone marrow cells treated with a placebo or imatinib (P=0.0001). (m) Total number of white blood cells in peripheral blood at 1 week after the treatment with a placebo or imatinib. Results are given as mean ± s.e.m. (n) FACS analysis showing the percentage of GFP+ leukemia cells at 8 weeks after imatinib treatment.
Figure 2
Figure 2. Blk suppresses LSCs
(a) The percentages of total LSCs, LT-LSCs, ST-LSCs, CMP, GMP and MEP in bone marrow of recipients of BCR-ABL-transduced Blk−/− donor bone marrow cells (n=9) were compared with those in bone marrow of recipients of BCR-ABL-transduced WT donor bone marrow cells (n=5) at day 11 after transplantation. Mean values ± s.e.m. (b) The percentages and numbers of total LSCs, LT-LSCs and ST-LSCs in bone marrow of recipients of BCR-ABL- or BCR-ABL-Blk-transduced bone marrow cells were analyzed at day 15 after transplantation. Mean values ± s.e.m. (n=5). (c) RT-PCR analysis of expression of Blk, BCR-ABL, and GFP in FACS-sorted LSCs at 2 weeks after transplantation. (d) Kaplan-Meier survival curves for secondary CML mice receiving bone marrow cells obtained at day 15 after transplantation from primary CML mice induced by BCR-ABL or BCR-ABL-Blk (n=10 for each group). (e) 103 sorted-LSCs from bone marrow of primary CML mice induced by BCR-ABL-transduced CD45.2 or BCR-ABL-Blk-transduced CD45.1 donor bone marrow cells were mixed at 1:1 ratio, followed by transplantation into recipient mice. The percentages of BCR-ABL- and BCR-ABL-Blk expressing cells in peripheral blood and bone marrow were compared at 2, 3, and 4 weeks after transplantation (n=3 for each time point). (f) Cell cycle analysis of LSCs from bone marrow of CML mice induced by BCR-ABL or BCR-ABL-Blk (n=5 for each group). (P<0.05). (g) The percentage of apoptotic GFP+LinSca-1+c-Kit+ cells in bone marrow from CML mice at day 14 after transplantation. Mean values ± s.e.m.
Figure 3
Figure 3. Blk does not suppress normal HSCs
(a, b and c) FACS analysis of HSCs, CMP, GMP and MEP cells in bone marrow of WT (n=3) or Blk−/− (n=4) mice. (b) The percentages of LSK, LT-HSCs, and ST-HSCs in bone marrow of WT or Blk−/− mice. (c) The percentages of CMP, GMP, and MEP cells in bone marrow of WT (n=3) or Blk−/− (n=4) mice. (d) The percentages of myeloid (Gr-1+Mac-1+) and lymphoid (B220+IgM+) cells in bone marrow of WT or Blk−/− mice. (e) Cell cycle analysis of LSK cells in bone marrow of WT or Blk−/− mice. (f) Apoptosis of bone marrow cells and LSK cells from WT (n=3) or Blk−/− (n=4) mice. (g) FACS analysis of different donor cell lineages in recipient mice at 8, 12 and 16 weeks after transplantation. * P<0.05 (h) Colony forming assay of WT and Blk−/− bone marrow cells. (i) Three doses (1×10⁵, 5×10⁵, 2.5×10⁴) of WT or Blk−/− BM cells were injected into lethally irradiated recipients, and survival of the mice were compared. (j) FACS analysis of cell lineages in peripheral blood of recipients of Blk and vector transduced bone marrow cells at 8, 12, 16 weeks after transplantation. (k) The percentages of GFP+ LSK cells in bone marrow of recipients of vector and Blk transduced bone marrow cells at 16 weeks after transplantation. (l) Cell cycle analysis of LSK cells from bone marrow of recipients of GFP or Blk/GFP transduced bone marrow cells. (P=0.86 for G0-G1; P=0.2 for S+G2M).
Figure 4
Figure 4. Pax5 is an upstream partner of Blk in LSCs
(a) Real time RT-PCR analysis showing expression of Pax5 in LSCs as compared to normal HSCs. Results are given as mean ± s.e.m. (b) Western blot analysis showing expression of Pax5, Blk and BCR-ABL in 293T cells transfected with BCR-ABL and BCR-ABL-Pax5. (c) FACS analysis of the numbers of total LSCs, LT-LSCs, and ST-LSCs from recipients of BCR-ABL- or BCR-ABL-Pax5-transduced BM cells. Results are given as mean ± s.e.m. (d) Kaplan-Meier survival curves for recipients of BCR-ABL-(n=7) or BCR-ABL-Pax5- (n=6) transduced bone marrow cells. (e) FACS analysis showing the percentages of GFP+Gr-1+ cells in peripheral blood of recipients of BCR-ABL- or BCR-ABL-Pax5-transduced bone marrow cells at days 11, 14, 17, 30, and 40 after BMT, and gradual disappearance of GFP+Gr-1+ cells in peripheral blood of recipients of BCR-ABL-Pax5-transduced bone marrow cells but not in recipients of BCR-ABL-transduced bone marrow cells. (f) Gross appearance of the lungs and spleens of recipients of BCR-ABL- or BCR-ABL-Pax5-transduced donor bone marrow cells at day 14 after BMT. (g) Real time RT-PCR analysis monitoring Blk expression in LSCs from bone marrow of recipients of BCR-ABL- and BCR-ABL-Pax5-transduced bone marrow cells. Bone marrow cells from mice with CML induced by BCR-ABL or BCR-ABL-Pax5 were cultured under stem cell conditions for 6 days, and LSCs were sorted by FACS for isolation of total RNA for real time PCR analysis. (h) Kaplan-Meier survival curves for recipients of BCR-ABL- or BCR-ABL-Pax5-transduced WT or Blk−/− bone marrow cells.
Figure 5
Figure 5. c-Myc and EBF1 regulate Pax5 expression
(a) ChIP assay showed c-Myc directly bound to the Pax5 promoter. Results were shown as mean ± s.e.m. (b) A Pax5 promoter luciferase reporter construct was cotransfected with empty vector or c-Myc plasmid into NIH3T3 cells. Cell extracts were analyzed for luciferase activity. Results were shown as mean ± s.e.m.. (c) Luciferase assay showed mutant c-Myc binding site in the Pax5 promoter restored the luciferase activity. Results were shown as mean ± s.e.m. (d and e) Real time RT-PCR analysis monitoring Pax5 and Blk expression in c-Myc-expressing or Pax5-expressing LSK cells. Results were shown as mean ± s.e.m. (f) ChIP assay showed EBF1 directly bind to the Pax5 promoter. Results were shown as mean ± s.e.m. (g) A Pax5 promoter luciferase reporter construct was cotransfected with empty vector, EBF1, or IRF8 plasmids into NIH3T3 cells. Cell extracts were analyzed for luciferase activity. Results were shown as mean ± s.e.m. (h) Luciferase assay showed mutant EBF1 binding site in the Pax5 promoter rescued the luciferase activity. Results were shown as mean ± s.e.m. (i) Real time RT-PCR analysis monitoring EBF1 expression by BCR-ABL in LSCs as compared to normal HSCs. Results are given as mean ± s.e.m. (j) Real time RT-PCR analysis monitoring EBF1 expression in c-Myc-expressing LSK cells. Results are given as mean ± s.e.m.
Figure 6
Figure 6. p27 is a downstream partner of Blk in LSCs
(a) Western blot analysis of the expression of p27, p21, Cdk2 and Skp2 in 293T cells after transfection with BCR-ABL, Blk or BCR-ABL-Blk. (b) Western blot analysis monitoring p27 expression. BCR-ABL-transduced bone marrow cells from WT or Blk−/− mice were grown in Whitlock-Witte culture for 7 days, and protein lysates were isolated for comparing p27 expression regulated by BCR-ABL in the presence and absence of BCR-ABL by Western blotting. (c) Microarray analysis showing Cdkn1b expression in vector-, BCR-ABL- and BCR-ABL-Blk-transduced LSCs. Mean values (± s.e.m) are shown. (d) The total numbers of total LSCs, LT-LSCs, and ST-LSCs in bone marrow of recipients of BCR-ABL-transduced Cdkn1b−/− (n=4) and BCR-ABL-transduced WT (n=3) donor bone marrow cells at day 14 after BMT. Mean values (± s.e.m.) are shown. (*P<0.05) (e) Kaplan-Meier survival curves for recipients of BCR-ABL-transduced bone marrow cells from WT or Cdkn1b−/− donor mice (P=0.02; n=8 for each group). (f) FACS analysis showing the percentages of GFP+Gr-1+ cells in peripheral blood of recipients of BCR-ABL-transduced bone marrow cells from WT or Cdkn1b−/− donor mice at day 12 after BMT. (P<0.02). (g) The total numbers of GFP+Gr-1+ cells in peripheral blood of recipients of BCR-ABL-transduced bone marrow cells from WT or Cdkn1b−/− donor mice at days 12 and 16 after BMT. Mean values (± s.e.m.) are shown.
Figure 7
Figure 7. The inhibitory effect of Blk on CML does not require Blk kinase activity
(a) Schematic structures of Blk mutants. SH, Src-homology; TK, tyrosine kinase. (b) Western blot analysis monitoring the phosphorylation status of Blk-K263E, and the reduced phosphorylation level of Blk-Y383F, as compared to that of WT Blk. (c) Western blot analysis monitoring expression of Blk, BlkΔTk, and BCR-ABL in 293T cells. (d) Kaplan-Meier survival curves for recipients of BCR-ABL (n=19), BCR-ABL-Blk (n=23), BCR-ABL-BlkΔTk (n=8), BCR-ABL-Blk-K263E (n=14) or BCR-ABL-Blk-Y383F (n=9) transduced bone marrow cells. (e) Gross appearance of the lungs and spleens of recipients of BCR-ABL-, BCR-ABL-Blk- or BCR-ABL-BlkΔTk- BCR-ABL-Blk-K263E- or BCR-ABL-Blk-Y383F-transduced bone marrow cells at 14 days after BMT. (f) Western blot analysis indicated that Blk but not the truncated BlkΔTk regulated Skp2 and p27 expression.
Figure 8
Figure 8. Blk functions as a tumor suppressor in human CML cells
(a) Real-time RT-PCR analysis of Blk expression in bone marrow cells from CML patients and normal donors. (P<0.0001). (b) Microarray analysis of Blk expression in bone marrow and peripheral blood CD34+ cells from 42 chronic (green), 17 accelerated (blue) and 31 blast crisis phase (red) CML patients. (c) Real-time RT-PCR analysis of Blk expression in BCR-ABL-transduced human cord blood CD34+ cells. BCR-ABL-transduced CD34+ cells were also treated by imatinib (1 μM) for 24 hours. ns, no significance. Mean values (± s.e.m) are shown. (d) Blk expression in human CD34+CD38 CML stem cells was not affected by imatinib. (n=3) (e) The expression of Blk in normal and CML quiescent and dividing CD34+ cells. (f) Real-time RT-PCR analysis of Blk expression in bone marrow cells from chronic phase CML patients transduced with either an empty or Blk lentivirus (pLenti-puro or pLenti-Blk-puro). (P=0.0015). (g) FACS analysis showed inhibition of proliferation of CD34+CD38 CML stem cells. (h) Equal numbers of human CML bone marrow cells transduced with empty or Blk-expressing lentivirus were plated in cytokine-supplemented methylcellulose in the presence of puromycin. (P=0.01). (i) CD34+ cells from human cord blood were co-transduced with BCR-ABL-GFP retrovirus and either an empty lentivirus or lentivirus expressing Blk, and were plated in cytokine-supplemented methylcellulose in the presence of puromycin. (P=0.01) (j) Growth curves of FACS sorted human K562 cells transduced with Blk-GFP or GFP alone. (k) Molecular model of the Blk pathway in LSCs.

Similar articles

Cited by

References

    1. Huntly BJ, Gilliland DG. Leukaemia stem cells and the evolution of cancer-stem-cell research. Nat Rev Cancer. 2005;5:311–21. - PubMed
    1. Reya T, Morrison SJ, Clarke MF, Weissman IL. Stem cells, cancer, and cancer stem cells. Nature. 2001;414:105–11. - PubMed
    1. Visvader JE, Lindeman GJ. Cancer stem cells in solid tumours: accumulating evidence and unresolved questions. Nat Rev Cancer. 2008;8:755–68. - PubMed
    1. Wang JC, Dick JE. Cancer stem cells: lessons from leukemia. Trends Cell Biol. 2005;15:494–501. - PubMed
    1. Chen Y, Hu Y, Zhang H, Peng C, Li S. Loss of the Alox5 gene impairs leukemia stem cells and prevents chronic myeloid leukemia. Nat Genet. 2009;41:783–92. - PMC - PubMed

Publication types

MeSH terms

Associated data